Sacramento and Elk Grove are two cities in California with their own unique qualities. Sacramento, as the state capital, offers diverse cultural experiences, an established infrastructure, and multiple industries, but may have higher costs of living and crime rates. On the other hand, Elk Grove, though smaller, offers a safer, suburban atmosphere, with a family-focused community, excellent education offerings, and a relatively lower cost of living.
Distance between
Sacramento, CA and
Elk Grove, CA : 9.4 miles
Sacramento's population is larger by 193%. Its population has grown by 118,023 people (29.0%) since 2000. The population of Elk Grove has grown by 119,013 people (198.4%) during that time.
Sacramento has a higher crime rate than the national average, with property crime being more prevalent than violent crime. However, it's worth noting that like most cities, crime rates vary by neighborhood. In contrast, Elk Grove has one of the lowest crime rates in the region, making it a safer option for families and tourists, especially for those who prioritize safety.
City-data.com crime index counts serious crimes and violent crime more heavily. It adjusts for the number of visitors and daily workers commuting into cities. (higher means more crime, U.S. average = 301.1)
City-data.com crime index counts serious crimes and violent crime more heavily. It adjusts for the number of visitors and daily workers commuting into cities. (higher means more crime, U.S. average = 301.1)
Sex Offenders
According to our data, there are 2,237 registered sex offenders living in Sacramento and 154 registered sex offenders living in . The ratio of residents to sex offenders in Sacramento is 221 to 1; the ratio in Elk Grove is 1,102 to 1. The number of registered sex offenders compared to the number of residents is much larger in Sacramento than that in Elk Grove.
Cost of Living
The overall cost of living in Sacramento is higher than in Elk Grove, particularly in terms of housing. However, living expenses such as groceries and healthcare are competitive in both cities. For those looking for affordability, Elk Grove might be a better choice due to its lower housing costs.
Income Tax
Both Sacramento and Elk Grove fall under California’s state income tax jurisdiction, which ranges from 1% to 13.3% depending on income level. There are no city-specific income taxes in these areas.
Property Tax
Property taxes in Sacramento are slightly higher than those in Elk Grove. However, the rates in both cities are still competitive compared to the average rate in California.
Sales Tax
The sales tax in both cities is identical as it's determined by the state. California has a base state sales tax rate of 7.25%, with local districts able to impose additional taxes.
Income
Type
Sacramento
Elk Grove
Estimated median household income
$75,311
$109,242
Estimated per capita income
$37,916
$38,695
Cost of living index (U.S. average is 100)
102.9
102.7
If you make $50,000 in Elk Grove, you will have to make $50,097 in Sacramento to maintain the same standard of living.
Geographical Conditions
Sacramento is located in the Sacramento Valley near the Sacramento River and is relatively flat. Elk Grove, to the south, is also primarily flat with slightly more open, green spaces due to its suburban development.
Both cities offer quality education. Sacramento boasts several renowned universities and a vast public school system, but it has larger classrooms due to its population. Elk Grove, on the other hand, has smaller class sizes, which can lead to more individualized attention for students in its well-rated schools.
Sacramento's economy is diverse, with industries spanning government, healthcare, education, and tech. Whereas Elk Grove's economy leans towards healthcare, retail, and education. Job growth is steady in both cities, but Sacramento's larger economy may offer more diverse job opportunities.
Biggest Employers
The State of California, UC Davis Health System, and Sutter Health are among the biggest employers in Sacramento, while in Elk Grove, top employers include the Elk Grove Unified School District, Kaiser Permanente, and Apple.
There were 1,004 building permits issued in Sacramento in 2012 (943 more than in 2011) compared to 563 building permits issued in Elk Grove in 2012 (311 more than in 2011).
Weather
Both Sacramento and Elk Grove share a similar Mediterranean climate, with hot, dry summers and mild, wet winters. However, Sacramento tends to be slightly hotter in the summer due to its urban layout, while Elk Grove, with its suburban environment and more open spaces, might have slightly cooler temperatures.
Weather and climate
Type
Sacramento
Elk Grove
Temperature - Average
62.2°F
62.1°F
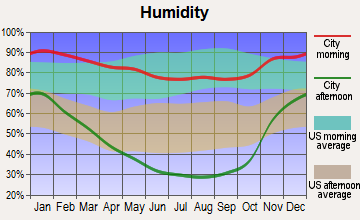
Humidity - Average morning or afternoon humidity
66.8%
66.7%
Humidity - Differences between morning and afternoon humidity
58%
58%
Humidity - Maximum monthly morning or afternoon humidity
87%
87%
Humidity - Minimum monthly morning or afternoon humidity
29%
29%
Precipitation - Yearly average
19 in
19.1 in
Snowfall - Yearly average
0 in
0 in
Clouds - Number of days clear of clouds
31.5%
31.5%
Sunshine amount - Average
83.6%
83.6%
Sunshine amount - Differences during a year
52%
52%
Sunshine amount - Maximum monthly
97%
97%
Sunshine amount - Minimum monthly
45%
45%
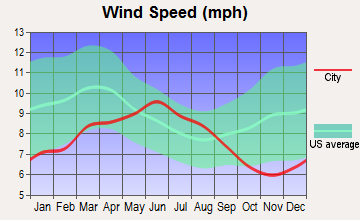
Wind speed - Average
6.8 mph
6.8 mph
Average climate in Sacramento, California
Average climate in Elk Grove, California
Air pollution
Type
AQI
CO
NO2
OZONE
PB
PM10
PM25
SO2
Year
Sacramento
Elk Grove
Sacramento
Elk Grove
Sacramento
Elk Grove
Sacramento
Elk Grove
Sacramento
Elk Grove
Sacramento
Elk Grove
Sacramento
Elk Grove
Sacramento
Elk Grove
2018
121
121
0.32
0.33
9.7
6.1
24.7
25.8
0.002
0.002
28.9
27.6
12.7
12.7
N/A
N/A
2017
117
117
0.33
0.31
9.0
6.2
25.2
26.0
0.002
0.002
22.1
21.3
8.8
9.7
N/A
N/A
2016
103
101
0.44
0.40
8.0
6.3
25.3
25.2
0.002
0.002
14.0
15.6
9.0
8.5
N/A
N/A
2015
105
103
0.25
0.28
9.7
7.4
24.9
25.1
0.002
0.002
16.2
18.4
10.9
10.5
N/A
N/A
2014
99
99
0.24
0.27
10.2
7.7
24.9
25.5
0.002
0.002
15.6
17.7
9.6
8.7
N/A
N/A
2013
102
102
0.29
0.31
11.1
8.9
23.2
24.3
0.002
0.002
21.3
22.0
11.9
10.5
N/A
N/A
2012
107
107
0.31
0.30
10.5
8.5
25.2
26.5
0.002
0.002
15.2
15.4
7.9
8.5
N/A
N/A
2011
106
106
0.29
0.31
11.2
9.2
24.0
25.0
0.002
0.002
17.7
18.5
10.8
11.3
N/A
N/A
2010
109
109
0.29
0.29
11.2
8.8
22.8
23.5
N/A
N/A
16.9
16.5
9.3
8.9
0.5
0.5
2009
118
118
0.40
0.40
12.4
10.0
23.3
24.8
0.003
0.003
20.6
19.5
11.4
10.9
0.5
0.5
2008
130
130
0.40
0.40
14.9
11.2
25.4
26.4
N/A
N/A
24.3
23.5
13.6
13.2
0.5
0.5
2007
129
129
0.39
0.41
14.8
11.7
23.7
25.0
0.005
0.005
19.9
19.7
13.5
12.5
0.6
0.6
2006
124
124
0.49
0.46
15.4
12.5
22.7
26.1
N/A
N/A
23.7
23.3
13.0
12.3
0.5
0.5
2005
125
125
0.42
0.43
15.9
12.0
20.0
23.2
N/A
N/A
22.1
21.0
13.5
13.1
0.6
0.6
2004
119
119
0.49
0.44
15.8
12.3
19.1
22.8
N/A
N/A
22.7
22.4
13.3
12.8
0.6
0.6
2003
119
119
0.47
0.47
16.8
13.4
20.3
25.2
N/A
N/A
23.1
21.2
N/A
N/A
0.9
0.9
2002
114
113
0.50
0.49
18.1
14.8
21.2
25.2
0.004
0.004
25.1
24.0
N/A
N/A
1.5
1.5
2001
111
110
0.43
0.45
18.0
13.9
21.2
24.0
0.004
0.004
20.7
21.8
N/A
N/A
1.4
1.4
2000
107
107
0.55
0.48
17.9
14.3
19.5
21.4
0.004
0.004
19.1
19.9
N/A
N/A
1.4
1.4
Natural disasters
Type
Sacramento
Elk Grove
Tornado activity compared to U.S. average
8.8%
8.8%
Earthquake activity compared to U.S. average
7,798.9%
7,869.8%
Natural disasters compared to U.S. average
18%
18%
Transportation
Sacramento has a comprehensive public transportation system with light rail and bus services, vital for both locals and tourists. Elk Grove has fewer public transit options, but roadways are well-maintained for commuting by car.
Transport
Type
Sacramento
Elk Grove
Amtrak stations
1
0
Amtrak stations nearby
3
2
FAA registered aircraft
414
83
FAA registered aircraft manufacturers and dealers
20
1
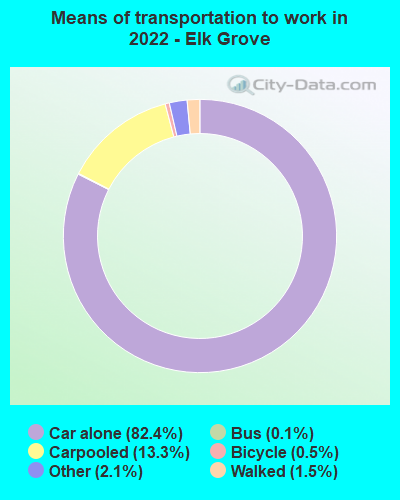
Means of transportation to work
Type
Sacramento
Elk Grove
Bicycle
1.1%
0.2%
Bus
1%
1.4%
Carpooled
12%
14.9%
Car alone
80%
81.9%
Motorcycle
0.2%
0.1%
Railroad
0.4%
0%
Taxicab
0.1%
0%
Walked
2.8%
1.3%
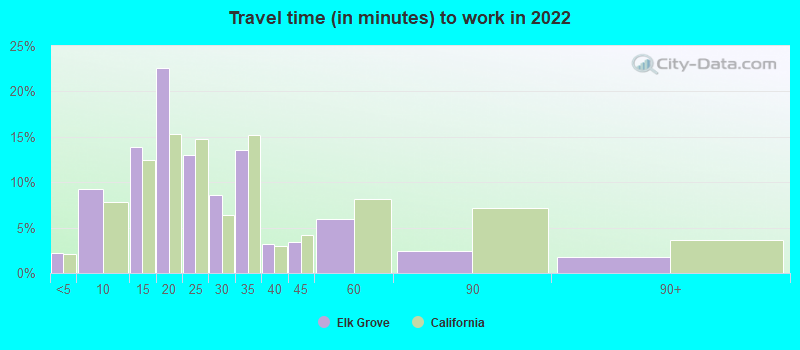
Average travel time to work
Type
Sacramento
Elk Grove
Average
28.5 min
25.1 min
Other means
22.8 min
27.6 min
Public transportation
39 min
43 min
Private vehicle occupancy
Type
Sacramento
Elk Grove
Average
1.2
1.2
Drove alone
88.5%
87.9%
In 2 person carpool
9.4%
8.6%
In 3 person carpool
1.2%
2%
In 4 person carpool
0.4%
0.5%
In 5-6 person carpool
0.5%
0.9%
How many people usually rode to work in the car, truck or van.
Real Estate
Home prices in Sacramento are generally higher than those in Elk Grove, which can make Elk Grove more attractive for families or first-time homeowners. Rental prices are also generally cheaper in Elk Grove compared to Sacramento.
Neighborhoods
Sacramento is known for its diverse neighborhoods like hip Midtown, family-friendly East Sacramento, or upscale Arden. Elk Grove, being smaller, has a more homogenous community but offers family-friendly neighborhoods making it perfect for raising children.
Houses and residents
Type
Sacramento
Elk Grove
Houses
210,715
54,385
Average household size (people)
2.6
3.2
Median year apartment built
1977
2001
Median year house/condo built
1978
2000
Length of stay in the house since moving in
12.8 years
11.7 years
Houses occupied
202,093 (95.9%)
53,724 (98.8%)
Houses occupied by owners
103,994 (51.5%)
39,576 (73.7%)
Houses occupied by renters
98,099 (48.5%)
14,148 (26.3%)
Median rent asked for vacant for-rent units
$976.09
$901.65
Median monthly housing costs
$1,558
$2,029
Median price asked for vacant for-sale houses and condos
$398,191
$504,618
Estimated median house or condo value
$449,600
$569,900
Median numbers of rooms
5
6.4
Median number of rooms in apartments
4.1
5.4
Median number of rooms in houses and condos
5.8
6.8
Median house price - detached houses
$496,462
$395,849
Median house price - in 3-to-4-unit structures
$205,310
$322,665
Median house price - in 5 or more unit structures
$382,635
$206,522
Median house price - mobile homes
$104,325
$82,321
Median house price - Townhouses or other attached units
$463,571
$295,005
Median house price - All housing units
$481,210
$390,398
Median house age
44
21
Renting percentage
50.6%
25.4%
Housing density (houses/condos per square mile)
2,168.8
3,578.6
House value disparities
25.5%
18.1%
Household income disparities
44%
36.1%
Median household income for houses/condes with a mortgage
$109,432
$133,659
Median household income for apartments without a mortgage
$82,443
$101,781
Housing units without a mortgage
1,166 (1.6%)
267 (0.9%)
Housing units with both a second mortgage and home equity loan
4,385 (6.1%)
1,753 (5.8%)
Housing units with a mortgage
70,415 (98.4%)
29,785 (99.1%)
Housing units with a home equity loan
204 (0.3%)
0 (0%)
Housing units with a second mortgage
5,362 (7.5%)
1,923 (6.4%)
House/condo owner moved in on average (years ago)
10
10
House/condo renter moved in on average (years ago)
3
4
Housing units lacking complete kitchen facilities
1.2%
1.4%
Housing units in structures
Housing units in structures
Sacramento
Elk Grove
One, detached
61.7%
87.9%
One, attached
6.8%
2.3%
Two
1.8%
0.1%
3 or 4
4.8%
0.6%
5 to 9
6.9%
2.1%
10 to 19
4.9%
1.2%
20 to 49
3.5%
0.5%
50 or more
7.6%
4.8%
Mobile homes
1.9%
0.5%
Boats, RVs, vans, etc.
0.0%
0.1%
Median real estate property taxes paid for housing units
Self-employed workers in own not incorporated business
12,891
4,526
State government workers
40,274
13,021
Unpaid family workers
755
71
Industries and Occupations
Both cities boast a mix of industries. Sacramento is a hub for government jobs, education, healthcare, and technology. Elk Grove tends to lean towards healthcare and education jobs while retail also makes up a large proportion of occupations.
Health diagnosing and treating practitioners and other technical occupations
5.8%
7.2%
Healthcare support occupations
5.6%
7.1%
Food preparation and serving related occupations
5.3%
6.0%
Community and social service occupations
3.6%
2.5%
Personal care and service occupations
3.5%
3.2%
Computer and mathematical occupations
3.4%
3.3%
Arts, design, entertainment, sports, and media occupations
2.9%
0.7%
Life, physical, and social science occupations
2.7%
2.5%
Production occupations
2.6%
1.6%
Building and grounds cleaning and maintenance occupations
2.6%
0.3%
Legal occupations
2.6%
1.0%
Material moving occupations
2.1%
3.0%
Health technologists and technicians
1.8%
1.6%
Transportation occupations
1.4%
1.1%
Architecture and engineering occupations
0.9%
1.1%
Health Care
Both cities have access to high-quality healthcare facilities. Sacramento is home to several major hospitals while Elk Grove residents often use facilities in nearby Sacramento. The major healthcare players in the region include Sutter Health, Kaiser Permanente, and UC Davis Health.
Sacramento, as a big city, has a developed infrastructure that accommodates a variety of transportation methods, including freeways, light rail, and an international airport. Elk Grove's infrastructure is less complex but well-maintained and improving as the city grows.
Infrastructure
Type
Sacramento
Elk Grove
TV stations
23
22
Bank branches located here
127
29
Bank institutions located here
31
17
Drinking water stations with no reported violations in the past
26
4
Drinking water stations with reported violations in the past
HMDA - Conventional home purchase loans - Applications denied
Year
Sacramento
Elk Grove
1999
1,003
120
2000
1,155
87
2001
983
93
2002
1,197
81
2003
2,258
521
2004
3,872
816
2005
4,610
876
2006
4,276
748
2007
2,386
345
2008
1,381
288
2009
647
152
Culture and Food
Sacramento is a melting pot of cultures with a dynamic art scene and countless food options from around the world. Elk Grove, though smaller, is known for its multicultural festivals and a variety of cuisines, especially its excellent Vietnamese and Mexican food scene.
Sports Teams
Sacramento is home to the Sacramento Kings NBA team and Sacramento Republic FC soccer team. Elk Grove, for its size, doesn't host any major league teams, but it has strong community and youth sports programs.


 Sacramento, CA
 Elk Grove, CA