San Antonio and Southeast Montgomery in Texas offer contrasting living experiences. San Antonio is a large city with vibrant attractions, opportunities, and cultural depth, while Southeast Montgomery, a suburban community near Houston, offers a quieter, high-quality life with access to Houston's amenities. The comparison of these two localities helps potential relocators and tourists understand the differences, ranging from economy, cost of living, education, to culture.
San Antonio, due to its larger population, has a higher crime rate compared to Southeast Montgomery. However, the community policing approach in San Antonio has reduced crime rates significantly over the years. In Southeast Montgomery, the crime rates are comparably lower, owing to its smaller population and robust local law enforcement presence.
Cost of Living
The cost of living in San Antonio is generally lower compared to that of Southeast Montgomery, largely because of cheaper housing. Grocery and healthcare costs are also typically lower in San Antonio. However, both areas offer a lower cost of living compared to the national average.
Income Tax
In line with Texas law, neither San Antonio nor Southeast Montgomery levy a state or city income tax.
Property Tax
Property tax rates vary between the two, with San Antonio generally having a higher rate. Southeast Montgomery enjoys relatively lower property tax rates.
Sales Tax
Both San Antonio and Southeast Montgomery have the same sales tax rate as they are in the same state of Texas. The total sales tax rate in both areas is 8.25%.
Income
Type
San Antonio
Southeast Montgomery
Estimated median household income
$54,923
$85,955
Estimated per capita income
$28,860
$42,611
Cost of living index (U.S. average is 100)
87.7
101.8
If you make $50,000 in San Antonio, you will have to make $58,039 in Southeast Montgomery to maintain the same standard of living.
Geographical Conditions
San Antonio sits at the southern edge of the Texas Hill Country, offering beautiful rolling landscapes. Southeast Montgomery, while mostly flat, is surrounded by several lakes and parks for outdoor recreation.
Geographical information
Type
San Antonio
Southeast Montgomery
Land area
407.6 sq. miles
483.9 sq. miles
Population density
3,562.3 people per sq. mile
596.7 people per sq. mile
Relative area comparison
San Antonio, TX Southeast Montgomery, TX
Education
San Antonio boasts renowned educational institutions, including the University of Texas at San Antonio. Various excellent K-12 schools serve the city. In Southeast Montgomery, the Conroe Independent School District provides high-quality education. Proximity to Houston gives residents access to multiple higher education opportunities.
San Antonio's economy is diverse with sectors like healthcare, tourism, military, and education driving employment. Southeast Montgomery, being part of the Greater Houston metropolitan area, benefits from Houston's various industries like energy, aeronautics, and manufacturing. The employment rate is generally high in both areas.
Biggest Employers
In San Antonio, the largest employers are H-E-B, USAA, and the local government. Southeast Montgomery, due to its proximity to Houston, sees many residents working for major Houston employers such as Texas Medical Center, Houston Independent School District, and Continental Airlines.
In San Antonio (Bexar County), 51.6% voted for Democrats and 47.1% for Republicans in 2012 Presidential Election. In Southeast Montgomery (Montgomery County), 19.1% voted for Democrats and 79.9% for Republicans.
Elections
Type
Democrats
Republicans
Other
Year
San Antonio
Southeast Montgomery
San Antonio
Southeast Montgomery
San Antonio
Southeast Montgomery
2020
58.3%
27.5%
40.1%
71.4%
1.5%
1.2%
2016
54.2%
22.4%
40.8%
73.5%
5.0%
4.0%
2012
51.6%
19.1%
47.1%
79.9%
1.4%
1.0%
2008
52.3%
23.2%
46.7%
75.9%
1.0%
0.9%
2004
44.5%
21.4%
55.0%
78.2%
0.6%
0.4%
2000
44.9%
22.0%
52.3%
76.0%
2.7%
2.0%
1996
49.7%
26.5%
44.6%
65.2%
5.7%
8.3%
Breakdown of population affiliated with a religious congregation
Type
Adherents
Congregations
Religion
San Antonio
Southeast Montgomery
San Antonio
Southeast Montgomery
CATHOLIC CHURCH
30.8%
12.8%
8.6%
1.2%
SOUTHERN BAPTIST CONVENTION
6.8%
19.0%
23.5%
34.7%
MUSLIM ESTIMATE
1.2%
2.2%
0.8%
1.2%
LUTHERAN CHURCH
0.7%
0.3%
1.0%
1.2%
EPISCOPAL CHURCH
0.6%
0.4%
1.6%
0.6%
EVANGELICAL LUTHERAN CHURCH IN AMERICA
0.6%
0.5%
2.2%
1.5%
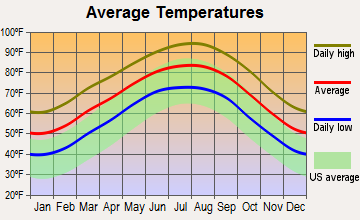
Weather
Both San Antonio and Southeast Montgomery feature a humid subtropical climate. Summers are hot and humid in both areas, while winters are mild to cool. However, San Antonio being further inland, experiences less influence from the Gulf of Mexico, resulting in hotter summers and cooler winters compared to Southeast Montgomery.
Weather and climate
Type
San Antonio
Southeast Montgomery
Temperature - Average
68.7°F
68.1°F
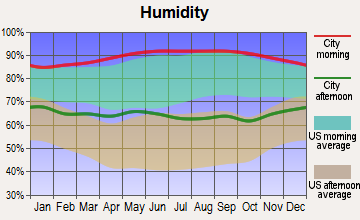
Humidity - Average morning or afternoon humidity
74.9%
80.3%
Humidity - Differences between morning and afternoon humidity
37%
36.9%
Humidity - Maximum monthly morning or afternoon humidity
87%
93%
Humidity - Minimum monthly morning or afternoon humidity
50%
56%
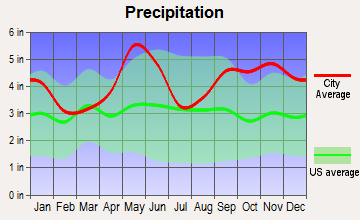
Precipitation - Yearly average
32.2 in
49.8 in
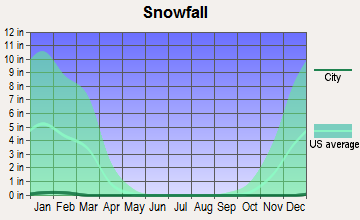
Snowfall - Yearly average
1.2 in
0.6 in
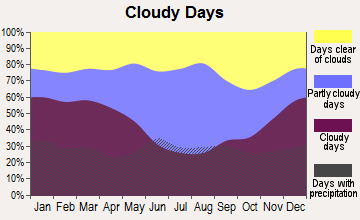
Clouds - Number of days clear of clouds
17.5%
15%
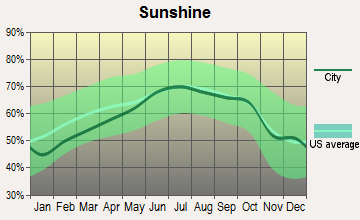
Sunshine amount - Average
62.4%
60.4%
Sunshine amount - Differences during a year
24%
24%
Sunshine amount - Maximum monthly
72%
67%
Sunshine amount - Minimum monthly
48%
43%
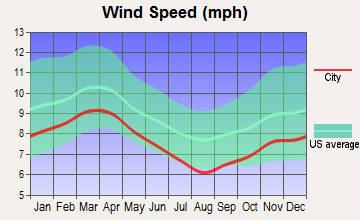
Wind speed - Average
8.9 mph
8.1 mph
Average climate in San Antonio, Texas
Average climate in Southeast Montgomery, Texas
Air pollution
Type
AQI
CO
NO2
OZONE
PM10
PM25
SO2
Year
San Antonio
Southeast Montgomery
San Antonio
San Antonio
Southeast Montgomery
San Antonio
Southeast Montgomery
San Antonio
San Antonio
Southeast Montgomery
San Antonio
2018
83
93
N/A
N/A
4.9
2.9
25.6
26.5
N/A
N/A
8.0
8.3
0.2
N/A
2017
85
92
N/A
N/A
5.1
3.1
26.9
27.5
N/A
N/A
8.4
8.6
1.7
N/A
2016
79
81
N/A
N/A
5.2
3.5
25.7
27.0
N/A
N/A
8.2
8.7
0.8
N/A
2015
76
93
N/A
N/A
4.7
3.4
25.4
26.0
N/A
N/A
9.2
9.2
0.7
N/A
2014
84
84
N/A
N/A
5.5
3.6
27.3
26.3
N/A
N/A
9.5
9.3
0.6
N/A
2013
79
100
N/A
N/A
4.1
3.2
28.2
27.6
N/A
N/A
9.0
9.7
0.7
N/A
2012
77
102
N/A
N/A
4.5
4.6
27.5
26.4
18.1
N/A
9.2
10.2
N/A
N/A
2011
85
113
N/A
N/A
4.6
5.0
29.2
29.5
18.9
N/A
9.9
10.9
N/A
N/A
2010
75
100
0.21
N/A
7.2
5.0
25.8
26.4
17.1
N/A
9.2
11.0
N/A
N/A
2009
74
106
0.23
N/A
8.3
4.9
25.7
25.9
19.5
N/A
9.8
10.9
0.4
N/A
2008
84
99
0.26
N/A
9.3
5.4
26.8
27.2
19.8
N/A
10.1
11.3
0.5
N/A
2007
83
115
0.49
N/A
9.3
5.9
26.3
25.3
23.4
N/A
10.3
11.4
N/A
N/A
2006
86
113
0.51
N/A
9.7
6.5
32.7
28.8
24.8
N/A
9.8
11.3
N/A
N/A
2005
86
120
0.53
N/A
10.7
6.9
30.8
29.2
22.3
N/A
10.1
12.8
N/A
N/A
2004
76
103
0.48
N/A
10.4
6.8
29.6
26.5
22.4
N/A
N/A
N/A
N/A
N/A
2003
77
115
0.57
N/A
10.3
7.4
28.5
26.4
26.7
N/A
N/A
N/A
N/A
N/A
2002
88
113
0.52
N/A
11.2
7.4
30.3
26.6
N/A
N/A
N/A
N/A
N/A
N/A
2001
78
133
0.57
N/A
11.9
7.5
29.3
25.8
N/A
N/A
N/A
N/A
N/A
N/A
2000
82
120
0.52
N/A
11.7
6.3
29.6
27.9
N/A
N/A
N/A
N/A
N/A
N/A
Natural disasters
Type
San Antonio
Southeast Montgomery
Tornado activity compared to U.S. average
91.5%
174%
Earthquake activity compared to U.S. average
73.7%
69.7%
Natural disasters compared to U.S. average
21%
30%
Transportation
San Antonio has a developed public transport system with a bus network and bike-sharing program. In Southeast Montgomery, public transit is less prevalent with many residents relying on cars. Its proximity to Houston provides commuting options for work.
Transport
Type
San Antonio
Southeast Montgomery
Amtrak stations
1
0
Amtrak stations nearby
1
0
FAA registered aircraft
987
0
FAA registered aircraft manufacturers and dealers
29
0
Means of transportation to work
Type
San Antonio
Southeast Montgomery
Bicycle
0.2%
0.2%
Bus
1.6%
1.4%
Carpooled
12.9%
13.6%
Car alone
81.9%
79.1%
Motorcycle
0.1%
0.1%
Walked
1.6%
1.1%
Average travel time to work
Type
San Antonio
Southeast Montgomery
Average
27 min
32 min
Real Estate
San Antonio offers a diverse real estate market with affordable housing options compared to the national average. Southeast Montgomery, due to its desirable suburban location near Houston, also offers a range of housing but at a higher cost.
Neighborhoods
San Antonio offers diverse neighborhoods ranging from the historic King William to hip areas like Southtown. Southeast Montgomery boasts predominantly residential neighborhoods, which feature quiet, secure, and beautifully planned subdivisions.
Houses and residents
Type
San Antonio
Southeast Montgomery
Houses
603,670
77,705
Average household size (people)
2.7
2.8
Houses occupied
549,245 (91%)
72,515 (93.3%)
Houses occupied by owners
290,123 (52.8%)
53,683 (74%)
Houses occupied by renters
259,122 (47.2%)
18,832 (26%)
Median rent asked for vacant for-rent units
$1,143
$1,329
Median price asked for vacant for-sale houses and condos
$189,213
$298,290
Estimated median house or condo value
$197,600
$288,981
Median number of rooms in apartments
4
4
Median number of rooms in houses and condos
6.2
6.8
Renting percentage
43.5%
30.6%
Housing density (houses/condos per square mile)
1,481.2
160.6
Household income disparities
44.7%
43.3%
Housing units without a mortgage
5,815 (3.5%)
10,543 (25.7%)
Housing units with both a second mortgage and home equity loan
6,350 (3.8%)
21 (0.1%)
Housing units with a mortgage
160,674 (96.5%)
30,480 (74.3%)
Housing units with a home equity loan
129 (0.1%)
1,769 (4.3%)
Housing units with a second mortgage
7,761 (4.7%)
1,550 (3.8%)
Housing units lacking complete kitchen facilities
2.1%
1.1%
Housing units lacking complete plumbing facilities
Self-employed workers in own not incorporated business
46,328
6,391
State government workers
29,486
3,200
Unpaid family workers
657
296
Industries and Occupations
In San Antonio, the dominant industries include healthcare, military, education, and tourism. Southeast Montgomery, part of Montgomery County, sees prominence in industries like construction, healthcare, education, oil and gas extraction, offering varying job opportunities.
San Antonio hosts top-tier medical facilities, including the University Health System and Methodist Hospital. Southeast Montgomery residents usually access healthcare services in nearby Houston, home to the world-class Texas Medical Center.
Health (county statistics)
Type
San Antonio
Southeast Montgomery
General health status score of residents in this county from 1 (poor) to 5 (excellent)
San Antonio combines historic charm with modern infrastructure, boasting a developed downtown area, multiple highways, and San Antonio International Airport. Southeast Montgomery, though smaller, enjoys well-planned suburban infrastructure and access to major highways leading to Houston.
Infrastructure
Type
San Antonio
Southeast Montgomery
TV stations
30
27
Culture and Food
San Antonio, with its rich history and multicultural influence, offers a vibrant food and cultural scene backed by events like the annual Fiesta. Southeast Montgomery, while quieter, offers a mix of small-town charm with the culinary and cultural advantages of nearby Houston.
Sports Teams
San Antonio is home to the NBA's San Antonio Spurs. Southeast Montgomery residents usually support Houston's sports teams like the Houston Astros (MLB), Houston Texans (NFL), and Houston Rockets (NBA).
 San Antonio, TX
 Southeast Montgomery, TX