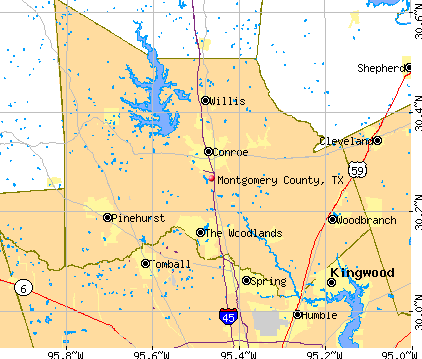
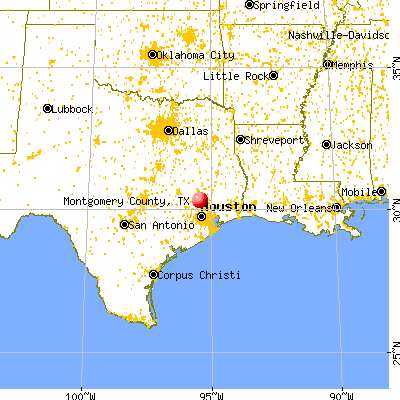
Montgomery County, Texas (TX)
County owner-occupied free and clear houses and condos in 2010: 34,599
County owner-occupied houses and condos in 2000: 80,750
Renter-occupied apartments: 42,523 (it was 22,546 in 2000)
| % of renters here: | 22% |
| State: | 36% |
Land area: 1044 sq. mi.
Water area: 32.8 sq. mi.
Population density: 650 people per square mile (high).
Industries providing employment: Educational, health and social services (19.3%), Professional, scientific, management, administrative, and waste management services (13.0%), Retail trade (12.1%), Construction (11.2%).
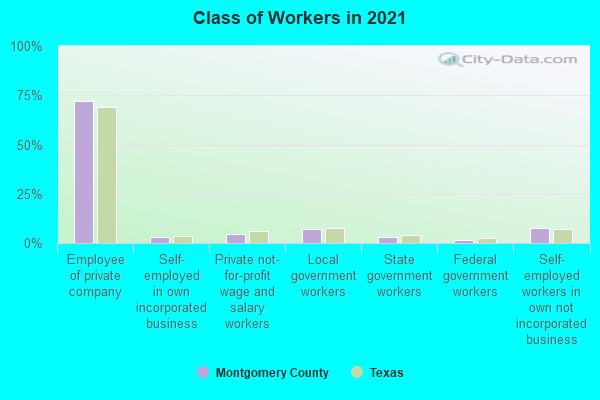
Type of workers:
- Private wage or salary: 80%
- Government: 13%
- Self-employed, not incorporated: 7%
- Unpaid family work: 0%
- OSM Map
- General Map
- Google Map
- MSN Map

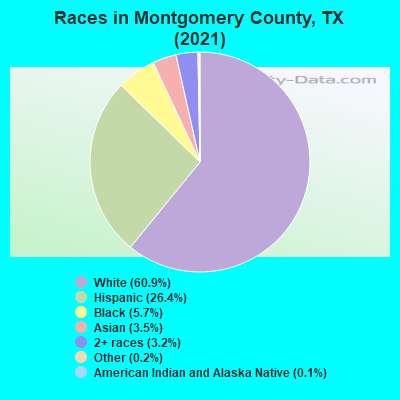
- 404,86059.7%White Non-Hispanic Alone
- 183,73627.1%Hispanic or Latino
- 40,6876.0%Black Non-Hispanic Alone
- 24,0103.5%Two or more races
- 21,4163.2%Asian alone
- 2,5210.4%Some other race alone
- 6740.10%Native Hawaiian and Other
Pacific Islander alone - 5860.09%American Indian and Alaska Native alone
| Median resident age: | 37.3 years |
| Texas median age: | 35.6 years |
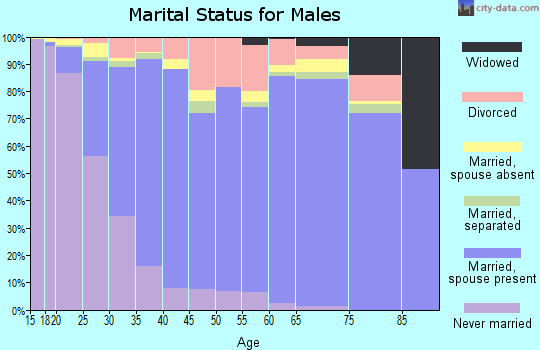
| Males: 337,701 | |
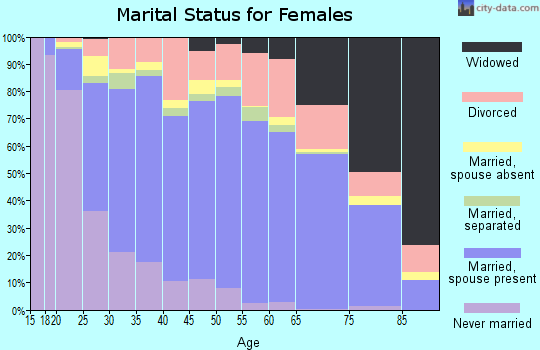
| Females: 340,789 |

 | The Woodlands vs other communities in Montgomery County (0 replies) |
| Houston's economic diversity Thread .. (1244 replies) |
| Conroe the next great suburb? (62 replies) |
| Montgomery County Real Estate Probate (1 reply) |
| Westward Expansion (194 replies) |
| Living in Austin as a non-leftist (48 replies) |
| Montgomery County: | 2.0 people |
| Texas: | 3 people |
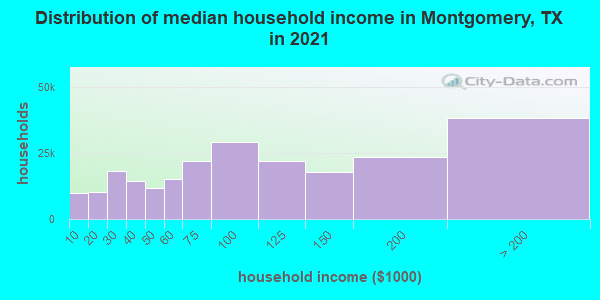
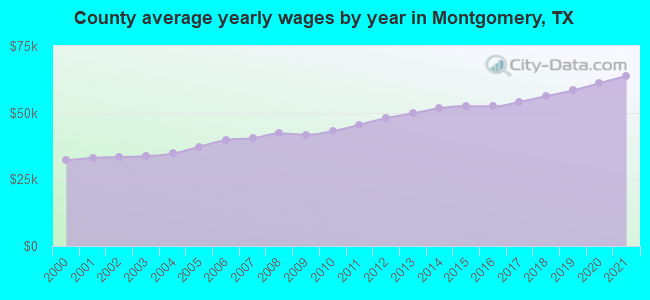
Estimated median household income in 2022: $94,972 ($50,864 in 1999)
| This county: | $94,972 |
| Texas: | $72,284 |
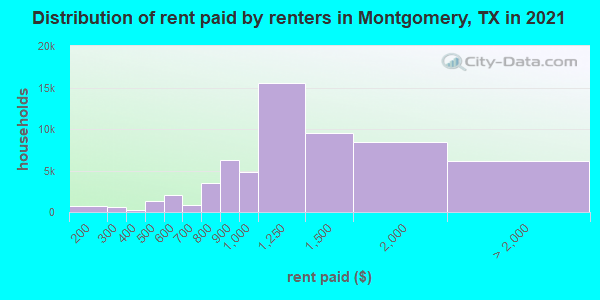
Median contract rent in 2022 for apartments: $1,217 (lower quartile is $956, upper quartile is $1,652)
| This county: | $1217 |
| State: | $1117 |
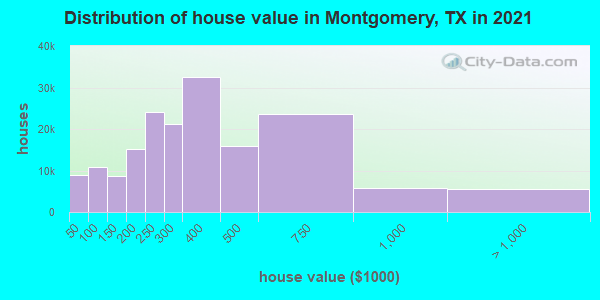
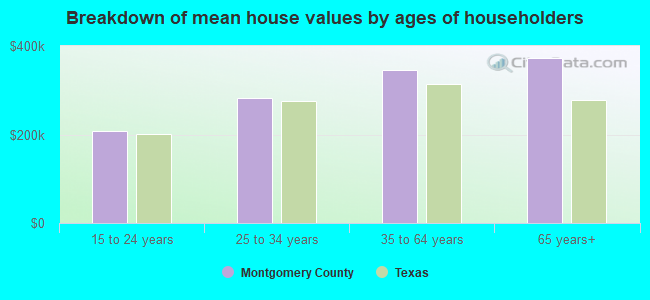
Estimated median house or condo value in 2022: $342,600 (it was $95,600 in 2000)
| Montgomery: | $342,600 |
| Texas: | $275,400 |
Mean price in 2022:
Median monthly housing costs for homes and condos with a mortgage: $2,064Detached houses: $460,310
Here: $460,310 State: $369,058 Townhouses or other attached units: $340,926
Here: $340,926 State: $327,631 In 2-unit structures: $274,259
Here: $274,259 State: $374,947 In 3-to-4-unit structures: $166,268
Here: $166,268 State: $209,652 In 5-or-more-unit structures: $214,194
Here: $214,194 State: $413,944 Mobile homes: $135,719
Here: $135,719 State: $124,413 Occupied boats, RVs, vans, etc.: $59,810
Here: $59,810 State: $73,921
Median monthly housing costs for units without a mortgage: $770
Institutionalized population: 2,937
Crime in 2021 (reported by the sheriff's office or county police, not the county total):
- Murders: 11
- Rapes: 99
- Robberies: 76
- Assaults: 732
- Burglaries: 786
- Thefts: 3442
- Auto thefts: 635
Crime in 2020 (reported by the sheriff's office or county police, not the county total):
- Murders: 13
- Rapes: 39
- Robberies: 81
- Assaults: 601
- Burglaries: 754
- Thefts: 2834
- Auto thefts: 497
Health of residents in Montgomery County based on CDC Behavioral Risk Factor Surveillance System Survey Questionnaires from 2013 to 2021:
General health status score of residents in this county from 1 (poor) to 5 (excellent) is 3.4. This is about average.68.8% of residents exercised in the past month. This is less than average.
37.5% of residents smoked 100+ cigarettes in their lives. This is less than average.
51.1% of adult residents drank alcohol in the past 30 days. This is less than average.
64.1% of residents visited a dentist within the past year. This is less than average.
Average weight of males is 198 pounds. This is about average.
Average weight of females is 164 pounds. This is about average.
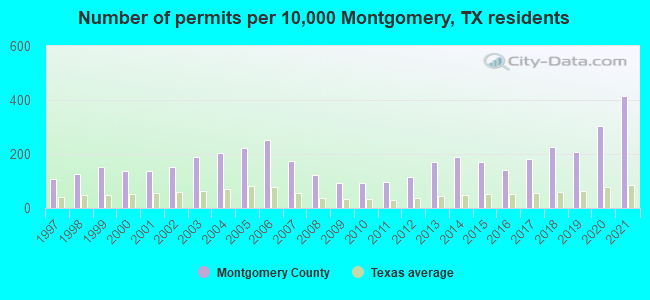
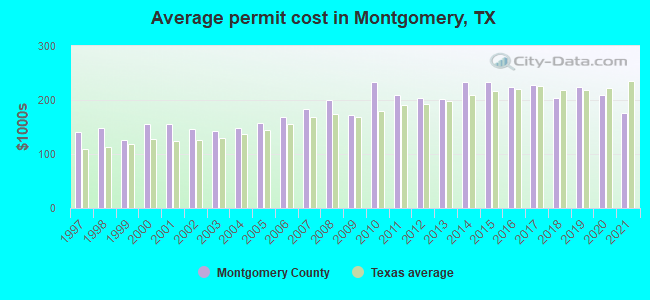
Single-family new house construction building permits:
- 2022: 11818 buildings, average cost: $181,700
- 2021: 12227 buildings, average cost: $175,600
- 2020: 8901 buildings, average cost: $209,800
- 2019: 6082 buildings, average cost: $223,500
- 2018: 6663 buildings, average cost: $203,700
- 2017: 5290 buildings, average cost: $227,800
- 2016: 4175 buildings, average cost: $223,900
- 2015: 4970 buildings, average cost: $234,000
- 2014: 5511 buildings, average cost: $233,200
- 2013: 4976 buildings, average cost: $202,300
- 2012: 3364 buildings, average cost: $203,500
- 2011: 2795 buildings, average cost: $210,200
- 2010: 2723 buildings, average cost: $233,300
- 2009: 2773 buildings, average cost: $172,600
- 2008: 3583 buildings, average cost: $199,600
- 2007: 5074 buildings, average cost: $182,600
- 2006: 7417 buildings, average cost: $168,100
- 2005: 6586 buildings, average cost: $156,700
- 2004: 6023 buildings, average cost: $148,300
- 2003: 5581 buildings, average cost: $143,000
- 2002: 4497 buildings, average cost: $147,400
- 2001: 3997 buildings, average cost: $155,000
- 2000: 4067 buildings, average cost: $154,500
- 1999: 4493 buildings, average cost: $126,000
- 1998: 3674 buildings, average cost: $148,500
- 1997: 3110 buildings, average cost: $139,500
Median real estate property taxes paid for housing units with mortgages in 2022: $6,067 (1.7%)
Median real estate property taxes paid for housing units with no mortgage in 2022: $3,714 (1.2%)
| Montgomery County: | 8.3% |
| Texas: | 14.0% |
Median age of residents in 2022: 37.3 years old
(Males: 36.6 years old, Females: 38.0 years old)
(Median age for: White residents: 42.8 years old, Black residents: 33.6 years old, American Indian residents: 36.0 years old, Asian residents: 38.9 years old, Hispanic or Latino residents: 28.7 years old, Other race residents: 33.9 years old)
Area name: Houston-Baytown-Sugar Land, TX HUD Metro FMR Area
Fair market rent in 2006 for a 1-bedroom apartment in Montgomery County is $612 a month.
Fair market rent for a 2-bedroom apartment is $743 a month.
Fair market rent for a 3-bedroom apartment is $990 a month.
Cities in this county include: Southeast Montgomery, The Woodlands, Conroe, Pinehurst, Willis, Oak Ridge North, Panorama Village, Shenandoah, Porter Heights, Patton Village.
2023 air pollution in Montgomery County:
Nitrogen Dioxide: 0.00 ppm (standard limit: 0.053 ppm). Below U.S. average.
Ozone (1-hour): 0.030 ppm (standard limit: 0.12 ppm). Near U.S. average.
Particulate Matter (PM2.5) Annual: 10.4 µg/m3(standard limit: 15.0 µg/m3). Near U.S. average.
Notable locations in this county outside city limits:
Notable locations in Montgomery County: Chiticote Ranch (A), Coal Mine Ranch (B), Conring Ranch (C), Hidden Windmill (D), Mesquite Ranch (E), Miller Ranch (F), Nancy Anne Ranch (G), Old Chilicote Ranch (H), Roosevelt Ranch (I), South Chiva Windmill (J), Toro Windmill (K), Marfa Municipal Golf Course (L), Tunnel Windmill (M), McCuthen Ranch (N), Quinn Camp (O), Quinn Mesa Windmill (P), Quinn Windmill (Q), Rawls Ranch (R), Samchez Ranch (S), Soldier Windmill (T). Display/hide their locations on the map
Churches in Montgomery County include: Sacred Heart Church (A), Saint Teresa Church (B). Display/hide their locations on the map
Cemeteries: Campo Santo Hernandez (1), Campo Santo Rodriguez (2), Casa Blanca Cemetery (3), Spencer Cemetery (4), Ochoa Cemetery (5), Presidio Cemetery (6), Haciendita Cemetery (7). Display/hide their locations on the map
Lakes, reservoirs, and swamps: Contrabando Waterhole (A), W-Bar Tank (B), Sunny Glen Tank (C), Fowlkes Ranch Lake (D), San Estaban Lake (E), Red Tank (F), Presa Viruelas (G), Presa Rincon (H). Display/hide their locations on the map
Streams, rivers, and creeks: Alamito Creek (A), Perdiz Creek (B), Panther Creek (C), Oak Creek (D), Navajo Creek (E), Naegele Creek (F), Matonoso Creek (G), Holguin Creek (H), White Spring Creek (I). Display/hide their locations on the map
Parks in Montgomery County include: Las Palomas Wildlife Management Area - Ocotillo Unit (1), Fort Leaton State Historic Site (2), Chinati Mountains State Natural Area (3), Big Bend Ranch State Park (4). Display/hide their locations on the map
Neighboring counties: Jefferson County, Florida  , El Paso County
  , Milam County
  .
.
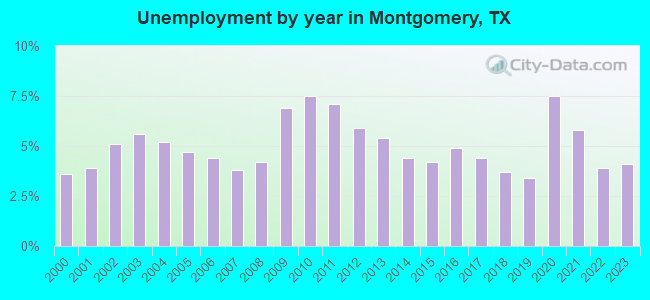
| Here: | 3.5% |
| Texas: | 3.5% |
Current college students: 11,460
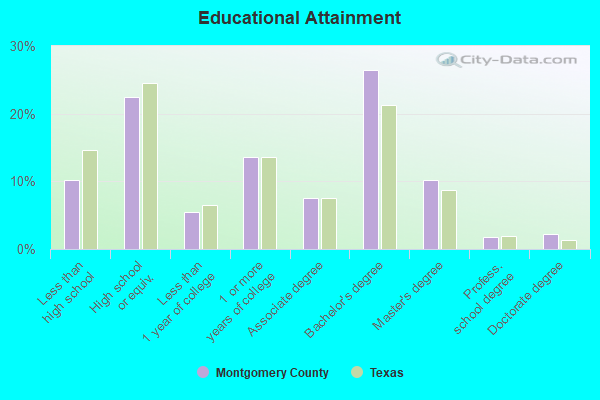
People 25 years of age or older with a high school degree or higher: 91.1%
People 25 years of age or older with a bachelor's degree or higher: 40.4%
Number of foreign born residents: 97,168 (45.7% naturalized citizens)
| Montgomery County: | 14.3% |
| Whole state: | 17.2% |
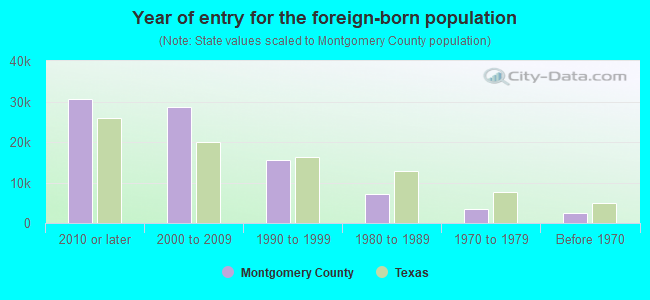
- Year of entry for the foreign-born population
- 40,3292010 or later
- 21,0742000 to 2009
- 20,0671990 to 1999
- 7,0441980 to 1989
- 3,5211970 to 1979
- 2,358Before 1970
Mean travel time to work (commute): minutes
Percentage of county residents living and working in this county: 98.9%
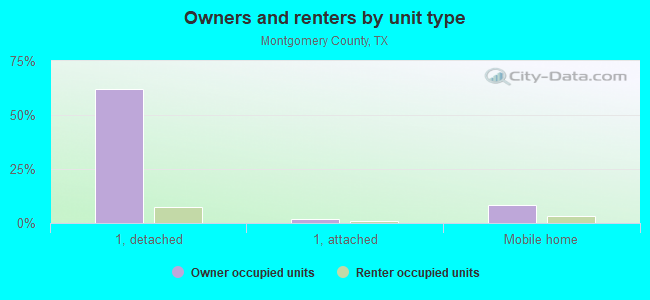
Housing units in structures:
- One, detached: 184,915
- One, attached: 5,542
- Two: 2,007
- 3 or 4: 3,114
- 5 to 9: 5,446
- 10 to 19: 15,041
- 20 to 49: 7,684
- 50 or more: 14,276
- Mobile homes: 25,655
- Boats, RVs, vans, etc.: 1,460
Housing units in Montgomery County with a mortgage: 110,319 (3,820 second mortgage, 172 home equity loan, 3,019 both second mortgage and home equity loan)
Houses without a mortgage: 1,566
| Here: | 99.1% with mortgage |
| State: | 98.4% with mortgage |
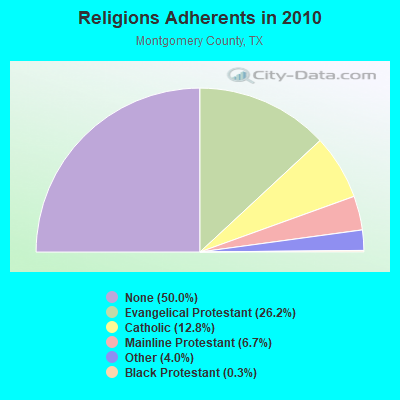
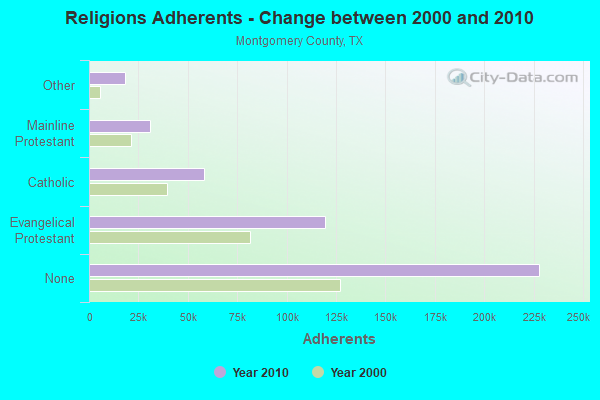
Religion statistics for Montgomery County
| Religion | Adherents | Congregations |
|---|---|---|
| Evangelical Protestant | 119,207 | 259 |
| Catholic | 58,383 | 4 |
| Mainline Protestant | 30,729 | 25 |
| Other | 18,167 | 35 |
| Black Protestant | 1,208 | 10 |
| Orthodox | 90 | 1 |
| None | 227,962 | - |
Source: Clifford Grammich, Kirk Hadaway, Richard Houseal, Dale E.Jones, Alexei Krindatch, Richie Stanley and Richard H.Taylor. 2012. 2010 U.S.Religion Census: Religious Congregations & Membership Study. Association of Statisticians of American Religious Bodies. Jones, Dale E., et al. 2002. Congregations and Membership in the United States 2000. Nashville, TN: Glenmary Research Center.
Food Environment Statistics:
| Montgomery County: | 1.09 / 10,000 pop. |
| State: | 1.47 / 10,000 pop. |
| Here: | 0.15 / 10,000 pop. |
| Texas: | 0.14 / 10,000 pop. |
| This county: | 0.88 / 10,000 pop. |
| Texas: | 1.11 / 10,000 pop. |
| Montgomery County: | 3.45 / 10,000 pop. |
| Texas: | 3.95 / 10,000 pop. |
| This county: | 5.52 / 10,000 pop. |
| State: | 6.13 / 10,000 pop. |
| Montgomery County: | 7.9% |
| Texas: | 8.9% |
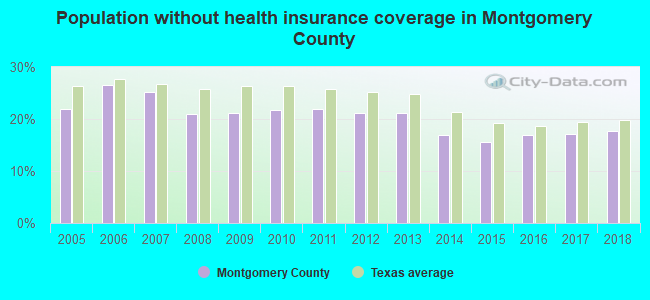
| Montgomery County: | 24.9% |
| State: | 26.6% |
| Here: | 19.5% |
| State: | 15.7% |
Agriculture in Montgomery County:
Average size of farms: 116 acresAverage value of agricultural products sold per farm: $11,798
Average value of crops sold per acre for harvested cropland: $601.73
The value of nursery, greenhouse, floriculture, and sod as a percentage of the total market value of agricultural products sold: 51.36%
The value of livestock, poultry, and their products as a percentage of the total market value of agricultural products sold: 42.47%
Average total farm production expenses per farm: $20,025
Harvested cropland as a percentage of land in farms: 9.70%
Irrigated harvested cropland as a percentage of land in farms: 4.76%
Average market value of all machinery and equipment per farm: $26,397
The percentage of farms operated by a family or individual: 93.65%
Average age of principal farm operators: 54 years
Average number of cattle and calves per 100 acres of all land in farms: 16.57
Milk cows as a percentage of all cattle and calves: 0.13%
All wheat for grain: 69 harvested acres
Vegetables: 37 harvested acres
Land in orchards: 178 acres
Earthquake activity:
Montgomery County-area historical earthquake activity is significantly above Texas state average. It is 29% smaller than the overall U.S. average.On 5/17/2012 at 08:12:00, a magnitude 4.8 (4.8 MW, Depth: 3.1 mi, Class: Light, Intensity: IV - V) earthquake occurred 131.9 miles away from Montgomery County center
On 10/20/2011 at 12:24:41, a magnitude 4.8 (4.8 MW, Depth: 3.1 mi) earthquake occurred 184.7 miles away from the county center
On 9/2/2013 at 23:51:15, a magnitude 4.3 (4.3 MW, Depth: 2.9 mi) earthquake occurred 129.2 miles away from the county center
On 9/2/2013 at 21:52:38, a magnitude 4.2 (4.2 MW, Depth: 3.0 mi) earthquake occurred 130.1 miles away from the county center
On 1/25/2013 at 07:01:19, a magnitude 4.1 (4.1 MB, Depth: 3.1 mi) earthquake occurred 129.2 miles away from Montgomery County center
On 6/16/1978 at 11:46:54, a magnitude 5.3 (4.4 MB, 4.6 UK, 5.3 ML, Class: Moderate, Intensity: VI - VII) earthquake occurred 366.0 miles away from the county center
Magnitude types: body-wave magnitude (MB), local magnitude (ML), moment magnitude (MW)
Most recent natural disasters:
- Texas Covid-19 Pandemic, Incident Period: January 20, 2020, FEMA Id: 4485, Natural disaster type: Other
- Texas Tropical Storm Imeda, Incident Period: September 17, 2019 - September 23, 2019, FEMA Id: 4466, Natural disaster type: Tropical Storm
- Texas Hurricane Harvey, Incident Period: August 23, 2017 - September 15, 2017, FEMA Id: 4332, Natural disaster type: Hurricane
- Texas Severe Storms and Flooding, Incident Period: May 22, 2016 to June 24, 2016, Major Disaster (Presidential) Declared DR-4272: June 11, 2016, FEMA Id: 4272, Natural disaster type: Storm, Flood
- Texas Severe Storms and Flooding, Incident Period: April 17, 2016 to April 30, 2016, Major Disaster (Presidential) Declared DR-4269: April 25, 2016, FEMA Id: 4269, Natural disaster type: Storm, Flood
- Texas Severe Storms, Tornadoes, Straight-line Winds, and Flooding, Incident Period: May 04, 2015 to June 23, 2015, Major Disaster (Presidential) Declared DR-4223: May 29, 2015, FEMA Id: 4223, Natural disaster type: Storm, Tornado, Flood, Wind
- Texas Tamina Fire, Incident Period: September 05, 2011, Fire Management Assistance Declared: September 06, 2011, FEMA Id: 2962, Natural disaster type: Fire
- Texas Riley Road Fire, Incident Period: September 05, 2011 to October 02, 2011, Fire Management Assistance Declared: September 06, 2011, FEMA Id: 2964, Natural disaster type: Fire
- Texas Wildfires, Incident Period: August 30, 2011 to December 31, 2011, Major Disaster (Presidential) Declared DR-4029: September 09, 2011, FEMA Id: 4029, Natural disaster type: Fire
- Texas Hurricane Ike, Incident Period: September 07, 2008 to October 02, 2008, Major Disaster (Presidential) Declared DR-1791: September 13, 2008, FEMA Id: 1791, Natural disaster type: Hurricane
- 20 other natural disasters have been reported since 1953.
The number of natural disasters in Montgomery County (30) is a lot greater than the US average (15).
Major Disasters (Presidential) Declared: 15
Emergencies Declared: 9
Causes of natural disasters: Floods: 11, Storms: 11, Fires: 8, Hurricanes: 8, Tornadoes: 5, Tropical Storm: 1, Wind: 1, Other: 2 (Note: some incidents may be assigned to more than one category).
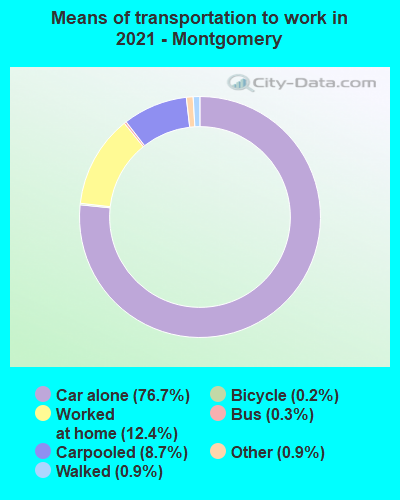
Means of transportation to work:
- Drove a car alone: 180,169 (67.6%)
- Carpooled: 22,797 (8.6%)
- Bus: 296 (0.1%)
- Light rail, streetcar or trolley: 172 (0.1%)
- Ferryboat: 195 (0.1%)
- Taxicab, motorcycle, or other means: 2,698 (1.0%)
- Bicycle: 272 (0.1%)
- Walked: 2,957 (1.1%)
- Worked at home: 57,015 (21.4%)
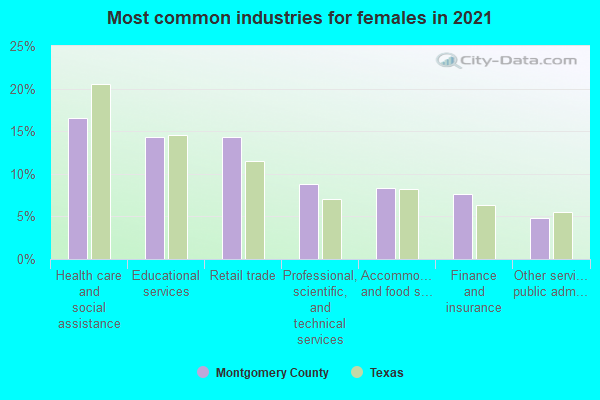
- Health care and social assistance (15%)
- Educational services (12%)
- Retail trade (9%)
- Professional, scientific, and technical services (8%)
- Accommodation and food services (5%)
- Manufacturing (4%)
- Finance and insurance (4%)
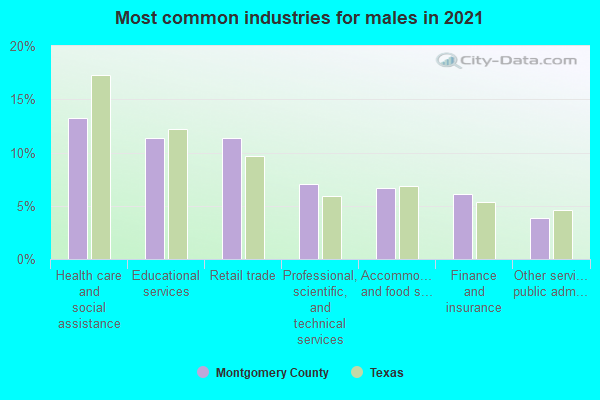
- Health care and social assistance (19%)
- Educational services (15%)
- Retail trade (12%)
- Professional, scientific, and technical services (11%)
- Accommodation and food services (7%)
- Manufacturing (5%)
- Finance and insurance (5%)
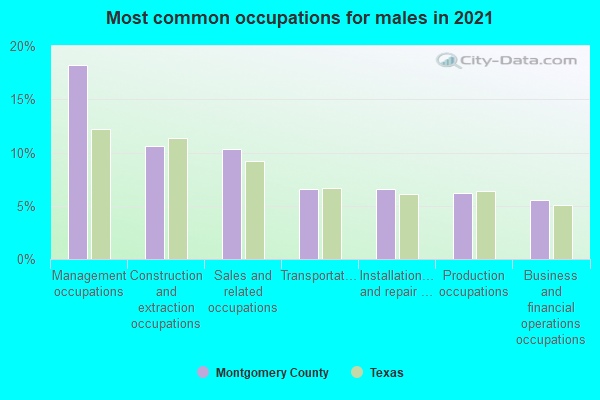
- Management occupations (18%)
- Construction and extraction occupations (12%)
- Sales and related occupations (10%)
- Installation, maintenance, and repair occupations (8%)
- Business and financial operations occupations (5%)
- Office and administrative support occupations (5%)
- Transportation occupations (5%)
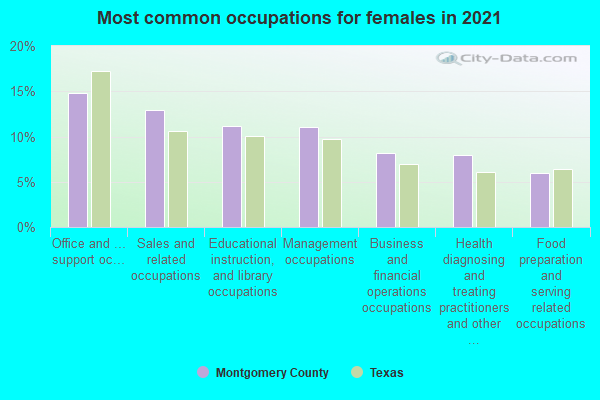
- Office and administrative support occupations (18%)
- Sales and related occupations (12%)
- Management occupations (12%)
- Educational instruction, and library occupations (12%)
- Health diagnosing and treating practitioners and other technical occupations (8%)
- Business and financial operations occupations (7%)
- Food preparation and serving related occupations (4%)
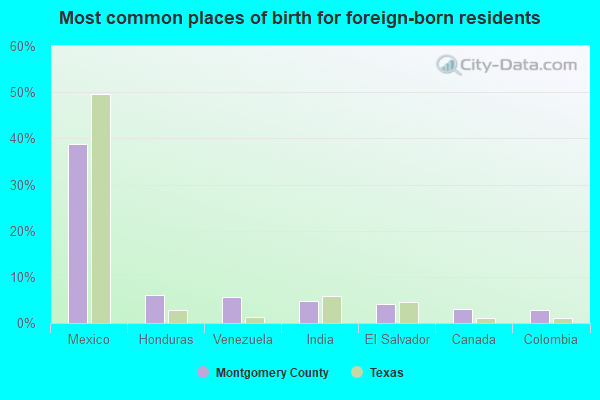
- Mexico (37%)
- Honduras (7%)
- Venezuela (6%)
- El Salvador (5%)
- India (5%)
- Colombia (3%)
- Canada (3%)
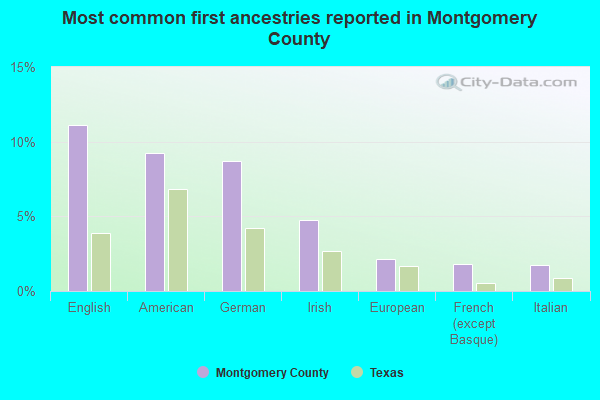
- English (11%)
- American (9%)
- German (8%)
- Irish (5%)
- European (2%)
- Italian (2%)
- French (except Basque) (2%)
People in group quarters in Montgomery County, Texas in 2010:
- 1,075 people in nursing facilities/skilled-nursing facilities
- 938 people in local jails and other municipal confinement facilities
- 856 people in federal detention centers
- 99 people in other noninstitutional facilities
- 89 people in group homes intended for adults
- 65 people in correctional residential facilities
- 59 people in emergency and transitional shelters (with sleeping facilities) for people experiencing homelessness
- 40 people in workers' group living quarters and job corps centers
- 3 people in residential treatment centers for juveniles (non-correctional)
People in group quarters in Montgomery County, Texas in 2000:
- 778 people in nursing homes
- 564 people in local jails and other confinement facilities (including police lockups)
- 87 people in other noninstitutional group quarters
- 53 people in halfway houses
- 38 people in other group homes
- 37 people in other nonhousehold living situations
- 34 people in homes for the mentally retarded
- 22 people in homes for the physically handicapped
- 19 people in orthopedic wards and institutions for the physically handicapped
- 18 people in short-term care, detention or diagnostic centers for delinquent children
- 15 people in religious group quarters
- 11 people in training schools for juvenile delinquents
- 5 people in hospitals/wards and hospices for chronically ill
- 5 people in other hospitals or wards for chronically ill
- 5 people in homes for abused, dependent, and neglected children
- 5 people in agriculture workers' dormitories on farms
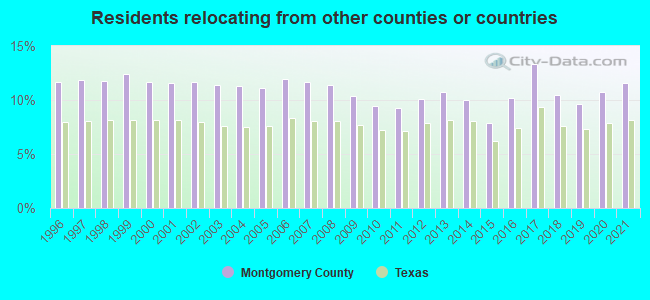
11.57% of this county's 2021 resident taxpayers lived in other counties in 2020 ($89,833 average adjusted gross income)
| Here: | 11.57% |
| Texas average: | 8.12% |
0.02% of residents moved from foreign countries ($117 average AGI)
Montgomery County: 0.02% Texas average: 0.04%
8.34% relocated from other counties in Texas ($60,164 average AGI)
3.21% relocated from other states ($29,552 average AGI)
Montgomery County: 3.21% Texas average: 2.83%
Top counties from which taxpayers relocated into this county between 2020 and 2021:
| from Harris County, TX | |
| from Walker County, TX | |
| from Fort Bend County, TX | |
| from Liberty County, TX | |
| from Travis County, TX | |
| from Los Angeles County, CA | |
| from Galveston County, TX |
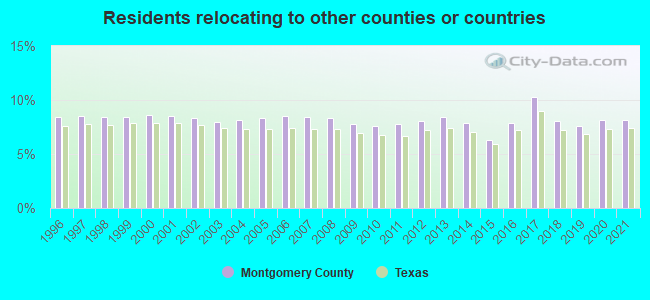
8.11% of this county's 2020 resident taxpayers moved to other counties in 2021 ($93,497 average adjusted gross income)
| Here: | 8.11% |
| Texas average: | 7.40% |
0.01% of residents moved to foreign countries ($103 average AGI)
Montgomery County: 0.01% Texas average: 0.03%
6.07% relocated to other counties in Texas ($66,284 average AGI)
2.03% relocated to other states ($27,109 average AGI)
Montgomery County: 2.03% Texas average: 2.08%
Top counties to which taxpayers relocated from this county between 2020 and 2021:
| to Harris County, TX | |
| to Walker County, TX | |
| to Liberty County, TX | |
| to Travis County, TX | |
| to Fort Bend County, TX | |
| to San Jacinto County, TX | |
| to Dallas County, TX |
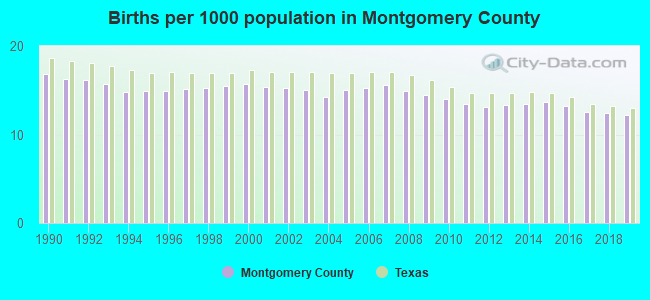
Births per 1000 population from 1990 to 1999: 15.5
Births per 1000 population from 2000 to 2009: 15.1
Births per 1000 population from 2010 to 2022: 11.0
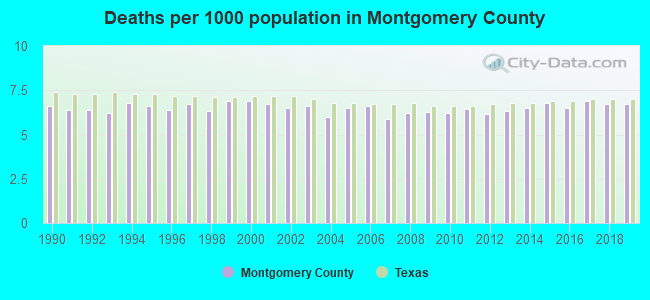
Deaths per 1000 population from 1990 to 1999: 6.5
Deaths per 1000 population from 2000 to 2009: 6.4
Deaths per 1000 population from 2010 to 2020: 6.6
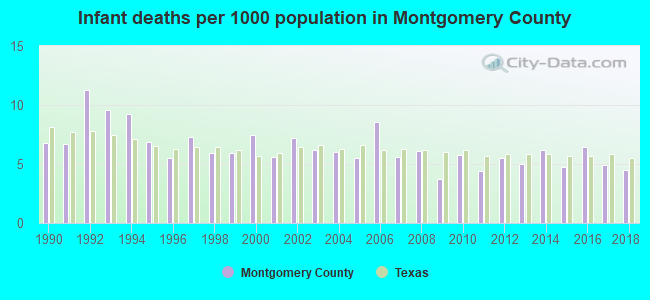
Infant deaths per 1000 live births from 1990 to 1999: 7.5
Infant deaths per 1000 live births from 2000 to 2009: 6.2
Infant deaths per 1000 live births from 2010 to 2021: 5.1
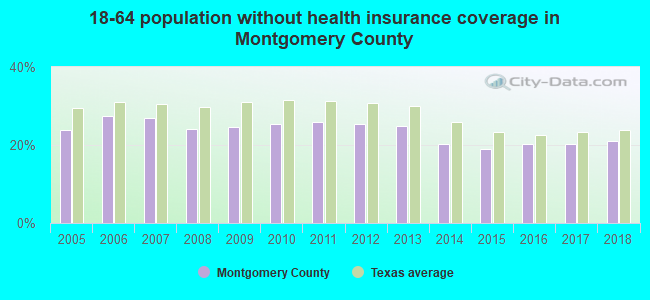
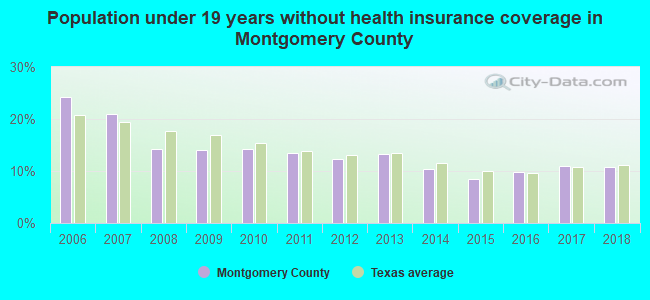
Persons under 19 years old without health insurance coverage in 2018: 10.8%
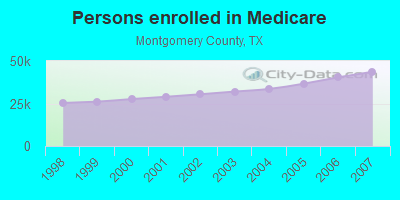
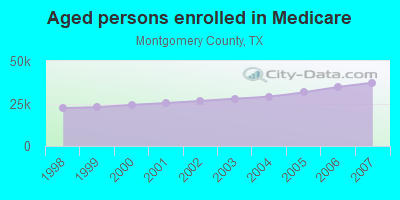
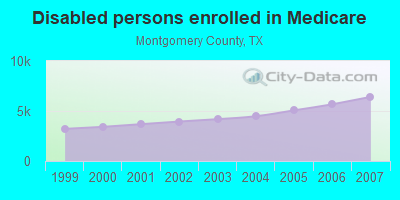
Persons enrolled in hospital insurance and/or supplemental medical insurance (Medicare) in July 1, 2007: 43,666 (37,253 aged, 6,413 disabled)
Children under 18 without health insurance coverage in 2007: 24,706 (20%)
Most common underlying causes of death in Montgomery County, Texas in 1999 - 2019:
- Bronchus or lung, unspecified - Malignant neoplasms (4,025)
- Atherosclerotic heart disease (3,425)
- Acute myocardial infarction, unspecified (2,888)
- Chronic obstructive pulmonary disease, unspecified (2,839)
- Unspecified dementia (1,986)
- Congestive heart failure (1,732)
- Alzheimer disease, unspecified (1,718)
- Atherosclerotic cardiovascular disease, so described (1,436)
- Stroke, not specified as haemorrhage or infarction (1,317)
- Septicaemia, unspecified (1,090)
Population without health insurance coverage in 2000: 14%
Children under 18 without health insurance coverage in 2000: 15%
Short term general hospital admissions per 100,000 population in 2004: 5,115
Short term general hospital beds per 100,000 population in 2004: 94
Emergency room visits per 100,000 population in 2004: 16,275
General practice office based MDs per 100,000 population in 2005: 1,428
Medical specialist MDs per 100,000 population in 2005: 608
Dentists per 100,000 population in 1998: 6
Total births per 100,000 population, July 2005 - July 2006 : 29
Total deaths per 100,000 population, July 2005 - July 2006: 74
Limited-service eating places per 100,000 population in 2005 : 9
Beer, wine & liquor stores per 100,000 population in 2005: 1
Homicides per 1,000,000 population from 2000 to 2006: 45.8. This is less than state average.
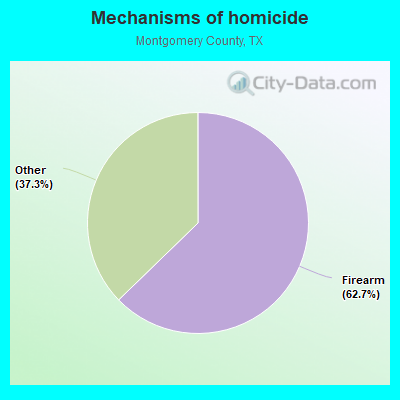
- Firearm - 28.8
- Other - 17.1
Suicides per 1,000,000 population from 2000 to 2006: 135.0. This is more than state average.
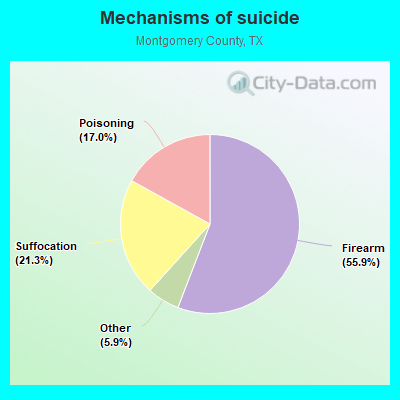
- Firearm - 75.4
- Suffocation - 28.8
- Poisoning - 22.9
- Other - 7.9
Household type by relationship:
Households: 678,490- Male householders: 135,531 (27,942 living alone), Female householders: 114,003 (29,764 living alone)
147,482 spouses (145,037 opposite-sex spouses), 15,571 unmarried partners, (15,155 opposite-sex unmarried partners), 212,067 children (195,086 natural, 5,425 adopted, 11,556 stepchildren), 18,155 grandchildren, 5,883 brothers or sisters, 5,303 parents, 976 foster children, 10,078 other relatives, 10,098 non-relatives
- In group quarters: 3,343
Size of family households: 72,994 2-persons, 41,538 3-persons, 34,972 4-persons, 18,842 5-persons, 8,092 6-persons, 4,218 7-or-more-persons.
Size of nonfamily households: 57,706 1-person, 9,840 2-persons, 551 3-persons, 680 4-persons, 101 6-persons.
127,506 married couples with children.
26,993 single-parent households (7,899 men, 19,094 women).
75.1% of residents of Montgomery speak English at home.
20.4% of residents speak Spanish at home (67% speak English very well, 15% speak English well, 13% speak English not well, 5% don't speak English at all).
2.1% of residents speak other Indo-European language at home (83% speak English very well, 15% speak English well, 1% speak English not well).
1.8% of residents speak Asian or Pacific Island language at home (65% speak English very well, 24% speak English well, 11% speak English not well).
0.7% of residents speak other language at home (67% speak English very well, 26% speak English well, 7% speak English not well).
In fiscal year 2004:
Federal Government expenditure: $1,033,698,000 ($2,853 per capita)
Department of Defense expenditure: $37,745,000
Federal direct payments to individuals for retirement and disability: $586,340,000
Federal other direct payments to individuals: $246,604,000
Federal direct payments not to individuals: $1,869,000
Federal grants: $139,430,000
Federal procurement contracts: $17,902,000 ($7,271,000 Department of Defense)
Federal salaries and wages: $41,552,000 ($4,526,000 Department of Defense)
Federal Government direct loans: $2,908,000
Federal guaranteed/insured loans: $268,439,000
Federal Government insurance: $2,542,229,000
Population change from April 1, 2000 to July 1, 2005:
Births: 25,977| Here: | 69 per 1000 residents |
| State: | 85 per 1000 residents |
Deaths: 11,468
| Here: | 30 per 1000 residents |
| State: | 35 per 1000 residents |
Net international migration: +6,553
| Here: | +17 per 1000 residents |
| State: | +29 per 1000 residents |
Net internal migration: +63,936
| Here: | +169 per 1000 residents |
| State: | +10 per 1000 residents |
Total withdrawal of fresh water for public supply: 48.53 millions of gallons per day (100% from ground, 0% from surface)
| Here: | 6.8 |
| State: | 6.3 |
| Here: | 4.0 |
| State: | 4.0 |
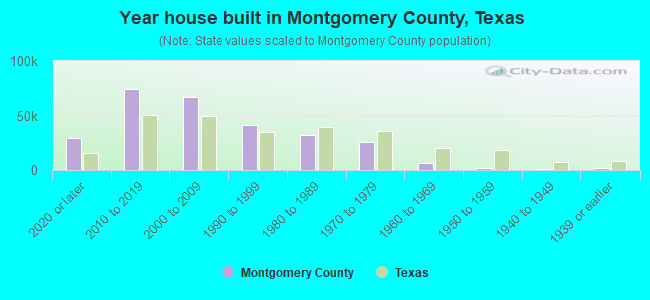
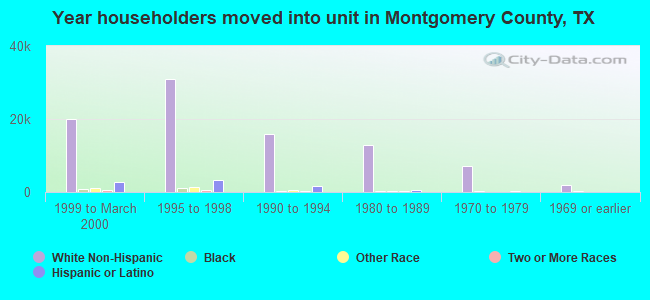
- Year house built in Montgomery County, Texas
- 18,5712020 or later
- 72,1542010 to 2019
- 69,5562000 to 2009
- 41,1861990 to 1999
- 27,6541980 to 1989
- 23,5191970 to 1979
- 6,7211960 to 1969
- 3,5551950 to 1959
- 9391940 to 1949
- 1,2851939 or earlier
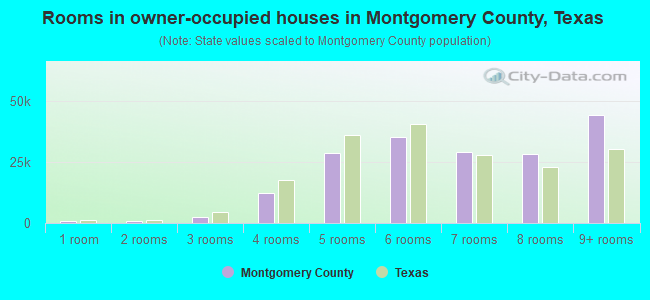
- Rooms in owner-occupied houses in Montgomery County, Texas
- 2471 room
- 7852 rooms
- 5,2953 rooms
- 13,0544 rooms
- 26,7915 rooms
- 35,5126 rooms
- 28,0717 rooms
- 29,5708 rooms
- 39,7849+ rooms
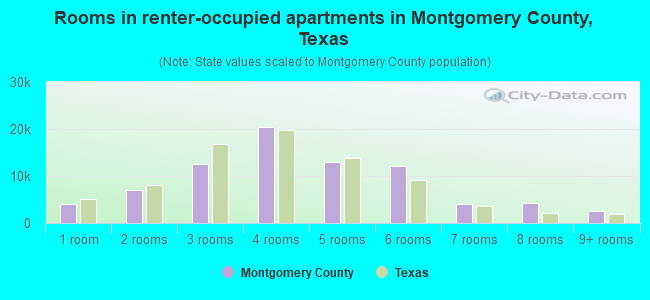
- Rooms in renter-occupied apartments in Montgomery County, Texas
- 3,4201 room
- 6,2262 rooms
- 17,9673 rooms
- 15,4294 rooms
- 10,9675 rooms
- 7,7096 rooms
- 4,3357 rooms
- 1,8988 rooms
- 2,4749+ rooms
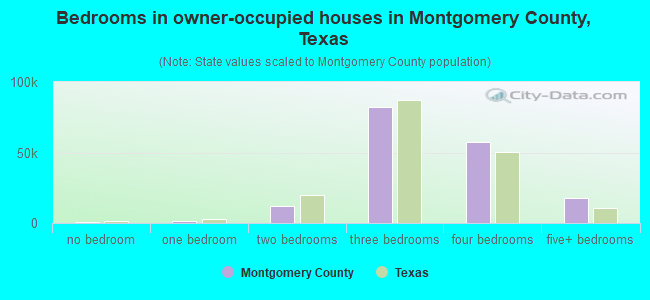
- Bedrooms in owner-occupied houses in Montgomery County, Texas
- 1,059no bedroom
- 3,0161 bedroom
- 13,3532 bedrooms
- 78,8193 bedrooms
- 65,1904 bedrooms
- 17,6725+ bedrooms
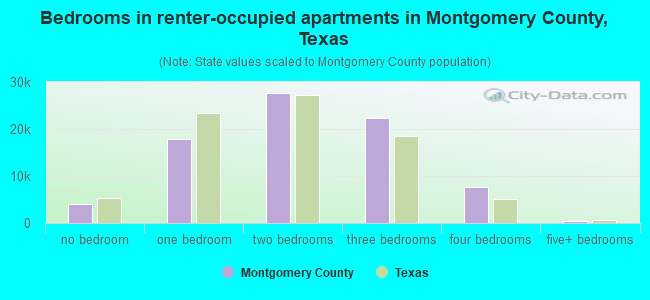
- Bedrooms in renter-occupied apartments in Montgomery County, Texas
- 3,631no bedroom
- 20,9301 bedroom
- 21,4382 bedrooms
- 17,6383 bedrooms
- 5,3594 bedrooms
- 1,4295+ bedrooms
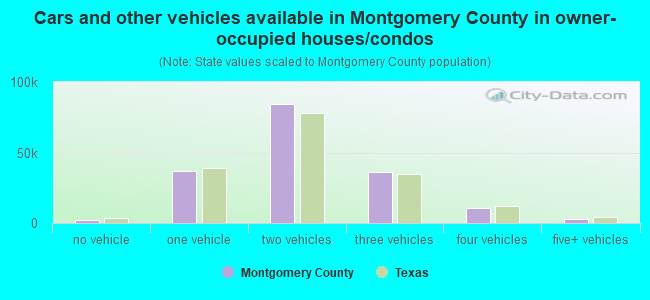
- Cars and other vehicles available in Montgomery County in owner-occupied houses/condos
- 2,841no vehicle
- 35,4981 vehicle
- 85,7492 vehicles
- 36,8033 vehicles
- 13,6634 vehicles
- 4,5555+ vehicles
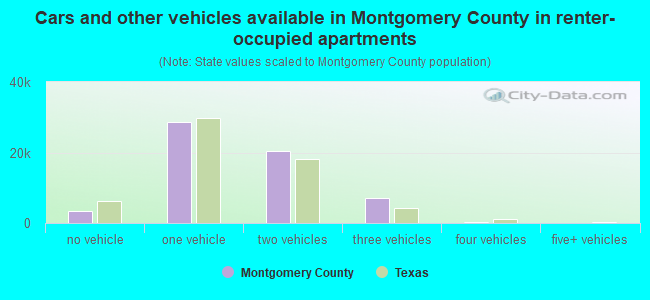
- Cars and other vehicles available in Montgomery County in renter-occupied apartments
- 4,543no vehicle
- 37,9101 vehicle
- 21,9112 vehicles
- 4,6393 vehicles
- 1,3214 vehicles
- 1015+ vehicles
86.4% of Montgomery County residents lived in the same house 1 years ago.
Out of people who lived in different houses, 28% lived in this county.
Out of people who lived in different counties, 72% lived in Texas.
| Montgomery County: | 86.4% |
| State average: | 85.7% |
Place of birth for U.S.-born residents:
- This state: 358,379
- Other state: 204,832
- Northeast: 31,076
- Midwest: 51,791
- South: 74,341
- West: 47,624
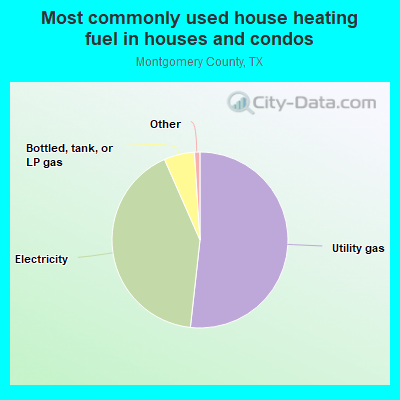
- 53.0%Utility gas
- 39.6%Electricity
- 5.6%Bottled, tank, or LP gas
- 0.6%Other fuel
- 0.5%Wood
- 0.3%No fuel used
- 0.3%Fuel oil, kerosene, etc.
- 0.1%Solar energy
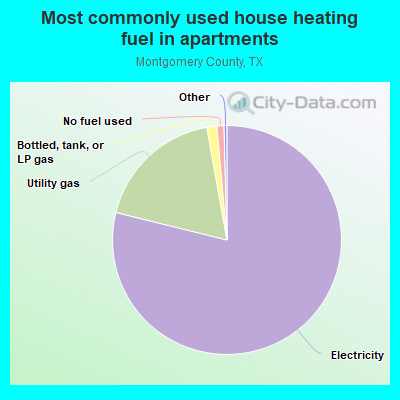
- 76.9%Electricity
- 19.7%Utility gas
- 2.3%Bottled, tank, or LP gas
- 1.0%No fuel used
- 0.2%Other fuel
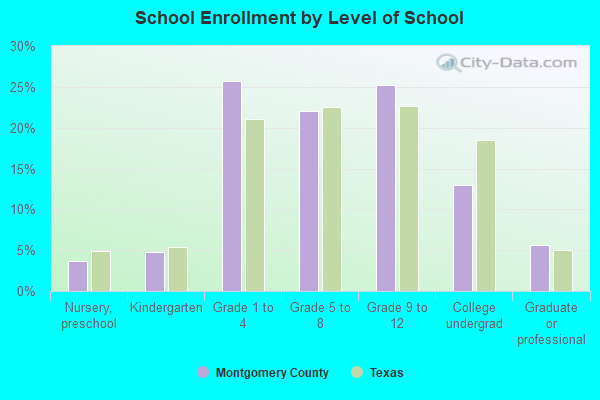
Private vs. public school enrollment:
| Here: | 8.9% |
| Texas: | 8.8% |
| Here: | 8.7% |
| Texas: | 8.0% |
| Here: | 13.4% |
| Texas: | 16.2% |
Montgomery County government finances - Expenditure in 2020:
- Bond Funds - Cash and Securities: $128,808,000
Cash and Securities: $118,863,000
- Charges - Other: $20,051,000
Other: $19,143,000
Toll Highways: $1,489,000
Toll Highways: $1,150,000
Air Transportation: $714,000
Parks and Recreation: $687,000
Regular Highways: $623,000
Regular Highways: $481,000
Air Transportation: $444,000
Parks and Recreation: $422,000
- Construction - Regular Highways: $69,718,000
Regular Highways: $29,672,000
Toll Highways: $8,677,000
Toll Highways: $3,452,000
Police Protection: $3,230,000
Air Transportation: $2,517,000
Police Protection: $2,484,000
Air Transportation: $300,000
Parks and Recreation: $2,000
- Current Operations - Police Protection: $72,205,000
Correctional Institutions: $65,367,000
Police Protection: $65,174,000
Correctional Institutions: $59,721,000
Judicial and Legal Services: $43,678,000
Regular Highways: $41,266,000
Judicial and Legal Services: $38,959,000
Regular Highways: $38,162,000
Health - Other: $22,119,000
Health - Other: $21,098,000
General - Other: $19,846,000
General - Other: $17,618,000
Financial Administration: $16,822,000
Financial Administration: $15,140,000
General Public Buildings: $9,440,000
Libraries: $9,324,000
General Public Buildings: $9,052,000
Libraries: $9,000,000
Corrections - Other: $8,266,000
Corrections - Other: $6,270,000
Central Staff Services: $4,471,000
Central Staff Services: $3,961,000
Housing and Community Development: $3,784,000
Housing and Community Development: $2,327,000
Toll Highways: $2,297,000
Local Fire Protection: $1,554,000
Local Fire Protection: $1,492,000
Parks and Recreation: $1,279,000
Public Welfare - Other: $1,242,000
Parks and Recreation: $1,214,000
Public Welfare - Other: $1,200,000
Air Transportation: $997,000
Air Transportation: $973,000
Natural Resources - Other: $706,000
Natural Resources - Other: $705,000
Toll Highways: $209,000
- Federal Intergovernmental - Other: $42,942,000
Other: $34,071,000
Housing and Community Development: $4,262,000
Housing and Community Development: $2,552,000
Air Transportation: $1,999,000
Air Transportation: $1,030,000
Health and Hospitals: $150,000
- General - Interest on Debt: $22,385,000
Interest on Debt: $20,185,000
- Local Intergovernmental - Other: $1,922,000
Other: $1,514,000
- Long Term Debt - Beginning Outstanding - Unspecified Public Purpose: $457,975,000
Outstanding Unspecified Public Purpose: $443,540,000
Outstanding Unspecified Public Purpose: $426,740,000
Beginning Outstanding - Unspecified Public Purpose: $426,470,000
Issue, Unspecified Public Purpose: $121,500,000
Retired Unspecified Public Purpose: $104,430,000
Retired Unspecified Public Purpose: $31,235,000
Beginning Outstanding - Public Debt for Private Purpose: $9,917,000
Outstanding Nonguaranteed - Industrial Revenue: $9,358,000
Beginning Outstanding - Public Debt for Private Purpose: $8,799,000
Outstanding Nonguaranteed - Industrial Revenue: $8,240,000
Retired Nonguaranteed - Public Debt for Private Purpose: $559,000
Retired Nonguaranteed - Public Debt for Private Purpose: $559,000
- Miscellaneous - General Revenue - Other: $19,768,000
General Revenue - Other: $16,331,000
Interest Earnings: $9,213,000
Fines and Forfeits: $4,757,000
Interest Earnings: $4,375,000
Fines and Forfeits: $4,111,000
Rents: $28,000
Rents: $20,000
- Other Capital Outlay - Police Protection: $9,364,000
Police Protection: $3,965,000
Financial Administration: $1,809,000
General - Other: $1,242,000
Health - Other: $802,000
General - Other: $764,000
Libraries: $692,000
Financial Administration: $653,000
Judicial and Legal Services: $648,000
Libraries: $477,000
Judicial and Legal Services: $340,000
Health - Other: $321,000
Housing and Community Development: $260,000
Corrections - Other: $199,000
General Public Building: $168,000
General Public Building: $154,000
Corrections - Other: $98,000
Parks and Recreation: $87,000
Housing and Community Development: $82,000
Air Transportation: $66,000
Local Fire Protection: $47,000
Correctional Institutions: $36,000
Correctional Institutions: $32,000
Local Fire Protection: $6,000
Air Transportation: $5,000
Central Staff Services: $4,000
- Other Funds - Cash and Securities: $350,981,000
Cash and Securities: $201,997,000
- Sinking Funds - Cash and Securities: $26,448,000
Cash and Securities: $20,252,000
- State Intergovernmental - Other: $24,218,000
Health and Hospitals: $17,729,000
Health and Hospitals: $17,232,000
Other: $7,237,000
Highways: $4,068,000
General Local Government Support: $2,474,000
General Local Government Support: $2,209,000
Highways: $1,736,000
- Tax - Property: $267,697,000
Property: $251,926,000
Motor Vehicle License: $7,600,000
Motor Vehicle License: $6,665,000
Other License: $1,545,000
Other License: $1,533,000
Other Selective Sales: $1,100,000
Other Selective Sales: $1,024,000
Occupation and Business License - Other: $661,000
Occupation and Business License - Other: $599,000
Alcoholic Beverage License: $224,000
Alcoholic Beverage License: $168,000
Amusements Sales: $139,000
Amusements Sales: $124,000
Montgomery County government finances - Revenue in 2020:
- Bond Funds - Cash and Securities: $128,808,000
Cash and Securities: $118,863,000
- Charges - Other: $20,051,000
Other: $19,143,000
Toll Highways: $1,489,000
Toll Highways: $1,150,000
Air Transportation: $714,000
Parks and Recreation: $687,000
Regular Highways: $623,000
Regular Highways: $481,000
Air Transportation: $444,000
Parks and Recreation: $422,000
- Construction - Regular Highways: $69,718,000
Regular Highways: $29,672,000
Toll Highways: $8,677,000
Toll Highways: $3,452,000
Police Protection: $3,230,000
Air Transportation: $2,517,000
Police Protection: $2,484,000
Air Transportation: $300,000
Parks and Recreation: $2,000
- Current Operations - Police Protection: $72,205,000
Correctional Institutions: $65,367,000
Police Protection: $65,174,000
Correctional Institutions: $59,721,000
Judicial and Legal Services: $43,678,000
Regular Highways: $41,266,000
Judicial and Legal Services: $38,959,000
Regular Highways: $38,162,000
Health - Other: $22,119,000
Health - Other: $21,098,000
General - Other: $19,846,000
General - Other: $17,618,000
Financial Administration: $16,822,000
Financial Administration: $15,140,000
General Public Buildings: $9,440,000
Libraries: $9,324,000
General Public Buildings: $9,052,000
Libraries: $9,000,000
Corrections - Other: $8,266,000
Corrections - Other: $6,270,000
Central Staff Services: $4,471,000
Central Staff Services: $3,961,000
Housing and Community Development: $3,784,000
Housing and Community Development: $2,327,000
Toll Highways: $2,297,000
Local Fire Protection: $1,554,000
Local Fire Protection: $1,492,000
Parks and Recreation: $1,279,000
Public Welfare - Other: $1,242,000
Parks and Recreation: $1,214,000
Public Welfare - Other: $1,200,000
Air Transportation: $997,000
Air Transportation: $973,000
Natural Resources - Other: $706,000
Natural Resources - Other: $705,000
Toll Highways: $209,000
- Federal Intergovernmental - Other: $42,942,000
Other: $34,071,000
Housing and Community Development: $4,262,000
Housing and Community Development: $2,552,000
Air Transportation: $1,999,000
Air Transportation: $1,030,000
Health and Hospitals: $150,000
- General - Interest on Debt: $22,385,000
Interest on Debt: $20,185,000
- Local Intergovernmental - Other: $1,922,000
Other: $1,514,000
- Long Term Debt - Beginning Outstanding - Unspecified Public Purpose: $457,975,000
Outstanding Unspecified Public Purpose: $443,540,000
Outstanding Unspecified Public Purpose: $426,740,000
Beginning Outstanding - Unspecified Public Purpose: $426,470,000
Issue, Unspecified Public Purpose: $121,500,000
Retired Unspecified Public Purpose: $104,430,000
Retired Unspecified Public Purpose: $31,235,000
Beginning Outstanding - Public Debt for Private Purpose: $9,917,000
Outstanding Nonguaranteed - Industrial Revenue: $9,358,000
Beginning Outstanding - Public Debt for Private Purpose: $8,799,000
Outstanding Nonguaranteed - Industrial Revenue: $8,240,000
Retired Nonguaranteed - Public Debt for Private Purpose: $559,000
Retired Nonguaranteed - Public Debt for Private Purpose: $559,000
- Miscellaneous - General Revenue - Other: $19,768,000
General Revenue - Other: $16,331,000
Interest Earnings: $9,213,000
Fines and Forfeits: $4,757,000
Interest Earnings: $4,375,000
Fines and Forfeits: $4,111,000
Rents: $28,000
Rents: $20,000
- Other Capital Outlay - Police Protection: $9,364,000
Police Protection: $3,965,000
Financial Administration: $1,809,000
General - Other: $1,242,000
Health - Other: $802,000
General - Other: $764,000
Libraries: $692,000
Financial Administration: $653,000
Judicial and Legal Services: $648,000
Libraries: $477,000
Judicial and Legal Services: $340,000
Health - Other: $321,000
Housing and Community Development: $260,000
Corrections - Other: $199,000
General Public Building: $168,000
General Public Building: $154,000
Corrections - Other: $98,000
Parks and Recreation: $87,000
Housing and Community Development: $82,000
Air Transportation: $66,000
Local Fire Protection: $47,000
Correctional Institutions: $36,000
Correctional Institutions: $32,000
Local Fire Protection: $6,000
Air Transportation: $5,000
Central Staff Services: $4,000
- Other Funds - Cash and Securities: $350,981,000
Cash and Securities: $201,997,000
- Sinking Funds - Cash and Securities: $26,448,000
Cash and Securities: $20,252,000
- State Intergovernmental - Other: $24,218,000
Health and Hospitals: $17,729,000
Health and Hospitals: $17,232,000
Other: $7,237,000
Highways: $4,068,000
General Local Government Support: $2,474,000
General Local Government Support: $2,209,000
Highways: $1,736,000
- Tax - Property: $267,697,000
Property: $251,926,000
Motor Vehicle License: $7,600,000
Motor Vehicle License: $6,665,000
Other License: $1,545,000
Other License: $1,533,000
Other Selective Sales: $1,100,000
Other Selective Sales: $1,024,000
Occupation and Business License - Other: $661,000
Occupation and Business License - Other: $599,000
Alcoholic Beverage License: $224,000
Alcoholic Beverage License: $168,000
Amusements Sales: $139,000
Amusements Sales: $124,000
Montgomery County government finances - Debt in 2020:
- Bond Funds - Cash and Securities: $128,808,000
Cash and Securities: $118,863,000
- Charges - Other: $20,051,000
Other: $19,143,000
Toll Highways: $1,489,000
Toll Highways: $1,150,000
Air Transportation: $714,000
Parks and Recreation: $687,000
Regular Highways: $623,000
Regular Highways: $481,000
Air Transportation: $444,000
Parks and Recreation: $422,000
- Construction - Regular Highways: $69,718,000
Regular Highways: $29,672,000
Toll Highways: $8,677,000
Toll Highways: $3,452,000
Police Protection: $3,230,000
Air Transportation: $2,517,000
Police Protection: $2,484,000
Air Transportation: $300,000
Parks and Recreation: $2,000
- Current Operations - Police Protection: $72,205,000
Correctional Institutions: $65,367,000
Police Protection: $65,174,000
Correctional Institutions: $59,721,000
Judicial and Legal Services: $43,678,000
Regular Highways: $41,266,000
Judicial and Legal Services: $38,959,000
Regular Highways: $38,162,000
Health - Other: $22,119,000
Health - Other: $21,098,000
General - Other: $19,846,000
General - Other: $17,618,000
Financial Administration: $16,822,000
Financial Administration: $15,140,000
General Public Buildings: $9,440,000
Libraries: $9,324,000
General Public Buildings: $9,052,000
Libraries: $9,000,000
Corrections - Other: $8,266,000
Corrections - Other: $6,270,000
Central Staff Services: $4,471,000
Central Staff Services: $3,961,000
Housing and Community Development: $3,784,000
Housing and Community Development: $2,327,000
Toll Highways: $2,297,000
Local Fire Protection: $1,554,000
Local Fire Protection: $1,492,000
Parks and Recreation: $1,279,000
Public Welfare - Other: $1,242,000
Parks and Recreation: $1,214,000
Public Welfare - Other: $1,200,000
Air Transportation: $997,000
Air Transportation: $973,000
Natural Resources - Other: $706,000
Natural Resources - Other: $705,000
Toll Highways: $209,000
- Federal Intergovernmental - Other: $42,942,000
Other: $34,071,000
Housing and Community Development: $4,262,000
Housing and Community Development: $2,552,000
Air Transportation: $1,999,000
Air Transportation: $1,030,000
Health and Hospitals: $150,000
- General - Interest on Debt: $22,385,000
Interest on Debt: $20,185,000
- Local Intergovernmental - Other: $1,922,000
Other: $1,514,000
- Long Term Debt - Beginning Outstanding - Unspecified Public Purpose: $457,975,000
Outstanding Unspecified Public Purpose: $443,540,000
Outstanding Unspecified Public Purpose: $426,740,000
Beginning Outstanding - Unspecified Public Purpose: $426,470,000
Issue, Unspecified Public Purpose: $121,500,000
Retired Unspecified Public Purpose: $104,430,000
Retired Unspecified Public Purpose: $31,235,000
Beginning Outstanding - Public Debt for Private Purpose: $9,917,000
Outstanding Nonguaranteed - Industrial Revenue: $9,358,000
Beginning Outstanding - Public Debt for Private Purpose: $8,799,000
Outstanding Nonguaranteed - Industrial Revenue: $8,240,000
Retired Nonguaranteed - Public Debt for Private Purpose: $559,000
Retired Nonguaranteed - Public Debt for Private Purpose: $559,000
- Miscellaneous - General Revenue - Other: $19,768,000
General Revenue - Other: $16,331,000
Interest Earnings: $9,213,000
Fines and Forfeits: $4,757,000
Interest Earnings: $4,375,000
Fines and Forfeits: $4,111,000
Rents: $28,000
Rents: $20,000
- Other Capital Outlay - Police Protection: $9,364,000
Police Protection: $3,965,000
Financial Administration: $1,809,000
General - Other: $1,242,000
Health - Other: $802,000
General - Other: $764,000
Libraries: $692,000
Financial Administration: $653,000
Judicial and Legal Services: $648,000
Libraries: $477,000
Judicial and Legal Services: $340,000
Health - Other: $321,000
Housing and Community Development: $260,000
Corrections - Other: $199,000
General Public Building: $168,000
General Public Building: $154,000
Corrections - Other: $98,000
Parks and Recreation: $87,000
Housing and Community Development: $82,000
Air Transportation: $66,000
Local Fire Protection: $47,000
Correctional Institutions: $36,000
Correctional Institutions: $32,000
Local Fire Protection: $6,000
Air Transportation: $5,000
Central Staff Services: $4,000
- Other Funds - Cash and Securities: $350,981,000
Cash and Securities: $201,997,000
- Sinking Funds - Cash and Securities: $26,448,000
Cash and Securities: $20,252,000
- State Intergovernmental - Other: $24,218,000
Health and Hospitals: $17,729,000
Health and Hospitals: $17,232,000
Other: $7,237,000
Highways: $4,068,000
General Local Government Support: $2,474,000
General Local Government Support: $2,209,000
Highways: $1,736,000
- Tax - Property: $267,697,000
Property: $251,926,000
Motor Vehicle License: $7,600,000
Motor Vehicle License: $6,665,000
Other License: $1,545,000
Other License: $1,533,000
Other Selective Sales: $1,100,000
Other Selective Sales: $1,024,000
Occupation and Business License - Other: $661,000
Occupation and Business License - Other: $599,000
Alcoholic Beverage License: $224,000
Alcoholic Beverage License: $168,000
Amusements Sales: $139,000
Amusements Sales: $124,000
Montgomery County government finances - Cash and Securities in 2020:
- Bond Funds - Cash and Securities: $128,808,000
Cash and Securities: $118,863,000
- Charges - Other: $20,051,000
Other: $19,143,000
Toll Highways: $1,489,000
Toll Highways: $1,150,000
Air Transportation: $714,000
Parks and Recreation: $687,000
Regular Highways: $623,000
Regular Highways: $481,000
Air Transportation: $444,000
Parks and Recreation: $422,000
- Construction - Regular Highways: $69,718,000
Regular Highways: $29,672,000
Toll Highways: $8,677,000
Toll Highways: $3,452,000
Police Protection: $3,230,000
Air Transportation: $2,517,000
Police Protection: $2,484,000
Air Transportation: $300,000
Parks and Recreation: $2,000
- Current Operations - Police Protection: $72,205,000
Correctional Institutions: $65,367,000
Police Protection: $65,174,000
Correctional Institutions: $59,721,000
Judicial and Legal Services: $43,678,000
Regular Highways: $41,266,000
Judicial and Legal Services: $38,959,000
Regular Highways: $38,162,000
Health - Other: $22,119,000
Health - Other: $21,098,000
General - Other: $19,846,000
General - Other: $17,618,000
Financial Administration: $16,822,000
Financial Administration: $15,140,000
General Public Buildings: $9,440,000
Libraries: $9,324,000
General Public Buildings: $9,052,000
Libraries: $9,000,000
Corrections - Other: $8,266,000
Corrections - Other: $6,270,000
Central Staff Services: $4,471,000
Central Staff Services: $3,961,000
Housing and Community Development: $3,784,000
Housing and Community Development: $2,327,000
Toll Highways: $2,297,000
Local Fire Protection: $1,554,000
Local Fire Protection: $1,492,000
Parks and Recreation: $1,279,000
Public Welfare - Other: $1,242,000
Parks and Recreation: $1,214,000
Public Welfare - Other: $1,200,000
Air Transportation: $997,000
Air Transportation: $973,000
Natural Resources - Other: $706,000
Natural Resources - Other: $705,000
Toll Highways: $209,000
- Federal Intergovernmental - Other: $42,942,000
Other: $34,071,000
Housing and Community Development: $4,262,000
Housing and Community Development: $2,552,000
Air Transportation: $1,999,000
Air Transportation: $1,030,000
Health and Hospitals: $150,000
- General - Interest on Debt: $22,385,000
Interest on Debt: $20,185,000
- Local Intergovernmental - Other: $1,922,000
Other: $1,514,000
- Long Term Debt - Beginning Outstanding - Unspecified Public Purpose: $457,975,000
Outstanding Unspecified Public Purpose: $443,540,000
Outstanding Unspecified Public Purpose: $426,740,000
Beginning Outstanding - Unspecified Public Purpose: $426,470,000
Issue, Unspecified Public Purpose: $121,500,000
Retired Unspecified Public Purpose: $104,430,000
Retired Unspecified Public Purpose: $31,235,000
Beginning Outstanding - Public Debt for Private Purpose: $9,917,000
Outstanding Nonguaranteed - Industrial Revenue: $9,358,000
Beginning Outstanding - Public Debt for Private Purpose: $8,799,000
Outstanding Nonguaranteed - Industrial Revenue: $8,240,000
Retired Nonguaranteed - Public Debt for Private Purpose: $559,000
Retired Nonguaranteed - Public Debt for Private Purpose: $559,000
- Miscellaneous - General Revenue - Other: $19,768,000
General Revenue - Other: $16,331,000
Interest Earnings: $9,213,000
Fines and Forfeits: $4,757,000
Interest Earnings: $4,375,000
Fines and Forfeits: $4,111,000
Rents: $28,000
Rents: $20,000
- Other Capital Outlay - Police Protection: $9,364,000
Police Protection: $3,965,000
Financial Administration: $1,809,000
General - Other: $1,242,000
Health - Other: $802,000
General - Other: $764,000
Libraries: $692,000
Financial Administration: $653,000
Judicial and Legal Services: $648,000
Libraries: $477,000
Judicial and Legal Services: $340,000
Health - Other: $321,000
Housing and Community Development: $260,000
Corrections - Other: $199,000
General Public Building: $168,000
General Public Building: $154,000
Corrections - Other: $98,000
Parks and Recreation: $87,000
Housing and Community Development: $82,000
Air Transportation: $66,000
Local Fire Protection: $47,000
Correctional Institutions: $36,000
Correctional Institutions: $32,000
Local Fire Protection: $6,000
Air Transportation: $5,000
Central Staff Services: $4,000
- Other Funds - Cash and Securities: $350,981,000
Cash and Securities: $201,997,000
- Sinking Funds - Cash and Securities: $26,448,000
Cash and Securities: $20,252,000
- State Intergovernmental - Other: $24,218,000
Health and Hospitals: $17,729,000
Health and Hospitals: $17,232,000
Other: $7,237,000
Highways: $4,068,000
General Local Government Support: $2,474,000
General Local Government Support: $2,209,000
Highways: $1,736,000
- Tax - Property: $267,697,000
Property: $251,926,000
Motor Vehicle License: $7,600,000
Motor Vehicle License: $6,665,000
Other License: $1,545,000
Other License: $1,533,000
Other Selective Sales: $1,100,000
Other Selective Sales: $1,024,000
Occupation and Business License - Other: $661,000
Occupation and Business License - Other: $599,000
Alcoholic Beverage License: $224,000
Alcoholic Beverage License: $168,000
Amusements Sales: $139,000
Amusements Sales: $124,000
Supplemental Security Income (SSI) in 2006:
- Total number of recipients: 5,197
- Number of aged recipients: 652
- Number of blind and disabled recipients: 4,545
- Number of recipients under 18: 972
- Number of recipients between 18 and 64: 3,217
- Number of recipients older than 64: 1,008
- Number of recipients also receiving OASDI: 1,724
- Amount of payments (thousands of dollars): 2,441
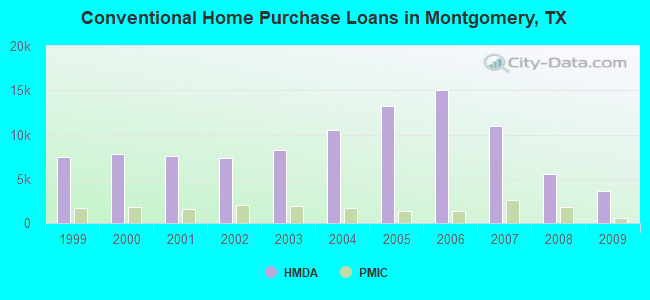
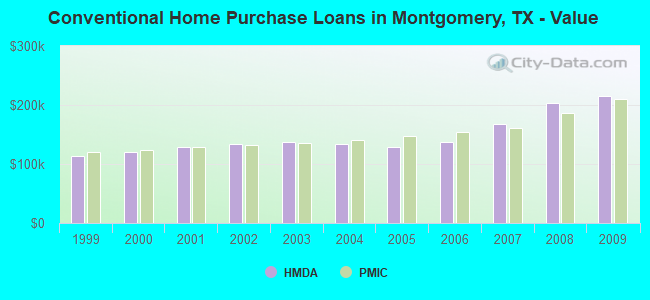
| Home Mortgage Disclosure Act Aggregated Statistics For Year 2009 (Based on 47 full tracts) | ||||||||||||||
| A) FHA, FSA/RHS & VA Home Purchase Loans | B) Conventional Home Purchase Loans | C) Refinancings | D) Home Improvement Loans | E) Loans on Dwellings For 5+ Families | F) Non-occupant Loans on < 5 Family Dwellings (A B C & D) | G) Loans On Manufactured Home Dwelling (A B C & D) | ||||||||
|---|---|---|---|---|---|---|---|---|---|---|---|---|---|---|
| Number | Average Value | Number | Average Value | Number | Average Value | Number | Average Value | Number | Average Value | Number | Average Value | Number | Average Value | |
| LOANS ORIGINATED | 2,590 | $159,080 | 3,632 | $215,937 | 7,197 | $208,020 | 408 | $65,439 | 7 | $3,784,286 | 711 | $172,795 | 150 | $57,500 |
| APPLICATIONS APPROVED, NOT ACCEPTED | 149 | $143,047 | 318 | $198,601 | 745 | $188,183 | 87 | $51,736 | 0 | $0 | 65 | $151,015 | 65 | $54,892 |
| APPLICATIONS DENIED | 426 | $148,242 | 654 | $191,777 | 2,597 | $182,837 | 676 | $42,908 | 2 | $580,000 | 237 | $145,612 | 215 | $53,572 |
| APPLICATIONS WITHDRAWN | 251 | $163,594 | 468 | $211,780 | 1,656 | $195,287 | 103 | $91,350 | 0 | $0 | 135 | $165,985 | 24 | $73,250 |
| FILES CLOSED FOR INCOMPLETENESS | 64 | $137,062 | 74 | $234,514 | 472 | $197,530 | 84 | $74,929 | 0 | $0 | 32 | $163,812 | 40 | $72,925 |
| Private Mortgage Insurance Companies Aggregated Statistics For Year 2009 (Based on 46 full tracts) | ||||||||
| A) Conventional Home Purchase Loans | B) Refinancings | C) Non-occupant Loans on < 5 Family Dwellings (A & B) | D) Loans On Manufactured Home Dwelling (A & B) | |||||
|---|---|---|---|---|---|---|---|---|
| Number | Average Value | Number | Average Value | Number | Average Value | Number | Average Value | |
| LOANS ORIGINATED | 599 | $209,760 | 291 | $202,935 | 8 | $141,625 | 1 | $51,000 |
| APPLICATIONS APPROVED, NOT ACCEPTED | 210 | $233,324 | 129 | $215,287 | 16 | $141,312 | 2 | $133,500 |
| APPLICATIONS DENIED | 88 | $212,443 | 70 | $220,129 | 5 | $245,400 | 0 | $0 |
| APPLICATIONS WITHDRAWN | 52 | $229,635 | 44 | $217,727 | 1 | $167,000 | 0 | $0 |
| FILES CLOSED FOR INCOMPLETENESS | 26 | $234,500 | 13 | $225,769 | 6 | $106,667 | 0 | $0 |
| Most common first names in Montgomery County, TX among deceased individuals | ||
| Name | Count | Lived (average) |
|---|---|---|
| James | 870 | 70.0 years |
| John | 859 | 73.3 years |
| William | 791 | 72.6 years |
| Mary | 761 | 77.7 years |
| Robert | 648 | 69.9 years |
| Charles | 480 | 70.0 years |
| George | 360 | 74.6 years |
| Dorothy | 347 | 76.4 years |
| Richard | 264 | 67.4 years |
| Thomas | 261 | 70.1 years |
| Most common last names in Montgomery County, TX among deceased individuals | ||
| Last name | Count | Lived (average) |
|---|---|---|
| Smith | 506 | 73.8 years |
| Johnson | 341 | 74.9 years |
| Williams | 307 | 74.4 years |
| Jones | 266 | 74.1 years |
| Brown | 224 | 72.9 years |
| Davis | 218 | 72.2 years |
| Taylor | 177 | 71.0 years |
| Moore | 150 | 72.9 years |
| Wilson | 150 | 73.9 years |
| Martin | 146 | 72.6 years |
| Businesses in Montgomery County, TX | ||||
| Name | Count | Name | Count | |
|---|---|---|---|---|
| 24 Hour Fitness | 2 | KFC | 4 | |
| 99 Cents Only Stores | 2 | Kohl's | 2 | |
| AMF Bowling | 1 | Kroger | 9 | |
| AT&T | 6 | La Quinta | 3 | |
| Abercrombie & Fitch | 1 | La-Z-Boy | 1 | |
| Abercrombie Kids | 1 | Lane Bryant | 3 | |
| Academy Sports + Outdoors | 2 | Lane Furniture | 8 | |
| Ace Hardware | 1 | LensCrafters | 1 | |
| Advance Auto Parts | 2 | Levi Strauss & Co. | 1 | |
| Aeropostale | 1 | Little Caesars Pizza | 4 | |
| American Eagle Outfitters | 1 | Long John Silver's | 5 | |
| Ann Taylor | 1 | Lowe's | 2 | |
| Apple Store | 1 | Macy's | 1 | |
| Applebee's | 1 | Marriott | 7 | |
| Arby's | 3 | Marshalls | 1 | |
| Ashley Furniture | 1 | MasterBrand Cabinets | 13 | |
| AutoZone | 6 | Maurices | 1 | |
| BMW | 1 | Mazda | 1 | |
| Bakers | 1 | McDonald's | 21 | |
| Banana Republic | 1 | Men's Wearhouse | 2 | |
| Barnes & Noble | 1 | Motel 6 | 1 | |
| Baskin-Robbins | 1 | Motherhood Maternity | 2 | |
| Bath & Body Works | 4 | New Balance | 2 | |
| Baymont Inn | 1 | New York & Co | 1 | |
| Bebe | 1 | Nike | 26 | |
| Bed Bath & Beyond | 2 | Nissan | 1 | |
| Best Western | 3 | Office Depot | 2 | |
| Blockbuster | 5 | OfficeMax | 2 | |
| Brooks Brothers | 1 | Old Navy | 2 | |
| Brookstone | 1 | Olive Garden | 2 | |
| Budget Car Rental | 1 | Outback | 2 | |
| Burger King | 7 | Outback Steakhouse | 2 | |
| CVS | 7 | Pac Sun | 2 | |
| Cache | 1 | Panda Express | 2 | |
| Casual Male XL | 2 | Panera Bread | 2 | |
| Catherines | 1 | Papa John's Pizza | 5 | |
| Chevrolet | 1 | Payless | 6 | |
| Chick-Fil-A | 6 | Penske | 3 | |
| Chico's | 1 | PetSmart | 3 | |
| Chipotle | 2 | Pier 1 Imports | 2 | |
| Chuck E. Cheese's | 1 | Pizza Hut | 9 | |
| Church's Chicken | 8 | Plato's Closet | 1 | |
| Cinnabon | 1 | Popeyes | 7 | |
| Cold Stone Creamery | 1 | Pottery Barn | 1 | |
| Coldwater Creek | 1 | Pottery Barn Kids | 1 | |
| Comfort Inn | 1 | Quiznos | 5 | |
| Comfort Suites | 1 | RadioShack | 6 | |
| Cracker Barrel | 1 | Ramada | 1 | |
| Cricket Wireless | 5 | Red Lobster | 2 | |
| Curves | 8 | Red Robin | 1 | |
| DHL | 8 | Rue21 | 1 | |
| Days Inn | 2 | Ryan's Grill | 1 | |
| Decora Cabinetry | 1 | SAS Shoes | 1 | |
| Dennys | 2 | SONIC Drive-In | 12 | |
| Discount Tire | 5 | Safeway | 3 | |
| Domino's Pizza | 3 | Sam's Club | 2 | |
| DressBarn | 2 | Sears | 5 | |
| Dressbarn | 2 | Sephora | 2 | |
| Eddie Bauer | 1 | Shoe Carnival | 1 | |
| Express | 1 | Soma Intimates | 1 | |
| Extended Stay America | 1 | Spencer Gifts | 1 | |
| Famous Footwear | 2 | Sprint Nextel | 6 | |
| FedEx | 55 | Starbucks | 19 | |
| Finish Line | 1 | Subway | 9 | |
| Firestone Complete Auto Care | 2 | Super 8 | 4 | |
| Foot Locker | 1 | T-Mobile | 16 | |
| Forever 21 | 1 | T.G.I. Driday's | 1 | |
| GNC | 5 | T.J.Maxx | 2 | |
| GameStop | 5 | Taco Bell | 11 | |
| Gap | 2 | Talbots | 1 | |
| Goodwill | 2 | Target | 3 | |
| Gymboree | 1 | The Cheesecake Factory | 1 | |
| H&R Block | 7 | The Room Place | 2 | |
| Hilton | 2 | Toyota | 1 | |
| Hobby Lobby | 2 | Toys"R"Us | 2 | |
| Holiday Inn | 2 | True Value | 2 | |
| Hollister Co. | 1 | U-Haul | 17 | |
| Home Depot | 4 | UPS | 47 | |
| Honda | 1 | Urban Outfitters | 1 | |
| Hot Topic | 1 | Vans | 3 | |
| IHOP | 4 | Verizon Wireless | 5 | |
| IZOD | 1 | Victoria's Secret | 1 | |
| J. Jill | 1 | Volkswagen | 1 | |
| J.Crew | 1 | Vons | 3 | |
| JCPenney | 2 | Waffle House | 2 | |
| Jack In The Box | 9 | Walgreens | 13 | |
| Jamba Juice | 1 | Walmart | 6 | |
| JoS. A. Bank | 1 | Wendy's | 5 | |
| Jones New York | 3 | Wet Seal | 1 | |
| Journeys | 1 | YMCA | 2 | |
| Justice | 3 | Z Gallerie | 1 | |
Montgomery County on our top lists:
- #12 on the list of "Top 101 counties with the lowest Nitrogen Dioxide air pollution readings in 2012 (ppm)"
- #14 on the list of "Top 101 counties with highest percentage of residents voting for Romney (Republican) in the 2012 Presidential Election (pop. 50,000+)"
- #16 on the list of "Top 101 counties with the lowest surface withdrawal of fresh water for public supply (pop. 50,000+)"
- #27 on the list of "Top 101 counties with the largest number of people moving in compared to moving out (pop. 50,000+)"
- #41 on the list of "Top 101 counties with the largest decrease in the number of infant deaths per 1000 residents 2000-2006 to 2007-2013 (pop. 50,000+)"
- #45 on the list of "Top 101 counties with the highest ground withdrawal of fresh water for public supply"
- #45 on the list of "Top 101 counties with the highest ground withdrawal of fresh water for public supply (pop. 50,000+)"
- #59 on the list of "Top 101 counties with the most Evangelical Protestant adherents"
- #59 on the list of "Top 101 counties with the most Evangelical Protestant adherents (pop. 50,000+)"
- #78 on the list of "Top 101 counties with the lowest number of infant deaths per 1000 residents 2007-2013 (pop. 50,000+)"
- #94 on the list of "Top 101 counties with the lowest surface withdrawal of fresh water for public supply"
- #97 on the list of "Top 101 counties with the most Evangelical Protestant congregations"
- #97 on the list of "Top 101 counties with the most Evangelical Protestant congregations (pop. 50,000+)"