San Antonio, TX vs Tulsa, OK - Advanced U.S. city comparison tool

San Antonio, TX vs Tulsa, OK

San Antonio, Texas, and Tulsa, Oklahoma, both offer unique advantages for residents and visitors alike. Enriched with history, culture, and unique attractions, these two cities offer contrasting yet inviting atmospheres. However, contrasting geographical conditions, weather, cost of living, employment opportunities, and cultural offerings all influence the overall experience of living, working, or visiting these vibrant urban centers.
 
 
Distance between San Antonio, TX and Tulsa, OK : 485.1 miles

San Antonio's population is larger by 253%. Its population has grown by 307,207 people (26.8%) since 2000. The population of Tulsa has grown by 18,352 people (4.7%) during that time.

Population
Type San Antonio Tulsa
Population 1,451,853 411,401
Female / male percentage 50.7% / 49.3%
50.7%
49.3%
50.8% / 49.2%
50.8%
49.2%
Racial makeup - percentage
Ethnicity San AntonioTulsa
Hispanic 66.4% 17.1%
White Non-Hispanic 22.1% 52.7%
Black 5.8% 14.2%
Asian 2.7% 3.2%
Two or more 2.3% 8.3%
American Indian 0.1% 3.9%
Pacific Islander 0.1% 0.2%
Racial makeup - absolute values
Ethnicity San AntonioTulsa
Hispanic 963,897 70,255
White Non-Hispanic 321,468 216,990
Black 84,366 58,545
Asian 39,158 13,174
Two or more 33,711 34,307
Pacific Islander 2,089 948
American Indian 1,614 15,942

Crime and Safety

Safety is a significant concern for both residents and tourists. Oklahoma's crime rates, including Tulsa, are higher than Texas's average, with San Antonio reporting fewer violent crimes per capita. However, San Antonio has a higher property crime rate. Both cities have numerous community initiatives aiming to enhance neighborhood safety. It’s important for residents and tourists to stay informed and take necessary precautions, irrespective of the location.

Cost of Living

Overall, the cost of living in Tulsa is generally lower than in San Antonio. Lower housing prices majorly contribute to this difference. However, basic amenities like food, healthcare, and transportation can be comparable in both cities. Besides, state taxes in Texas are generally higher than in Oklahoma.

Income Tax

Texas, including San Antonio, doesn’t levy state income tax, which can be a significant advantage for those relocating. On the other hand, Oklahoma, including Tulsa, imposes a state income tax, varying due to income brackets.

Property Tax

San Antonio has a higher median property tax than Tulsa. It’s worth noting for prospect home buyers or long-term residents that Texas has one of the highest median property taxes in the US.

Sales Tax

Both residents and visitors will notice a higher city and state sales tax in San Antonio, Texas (8.25%) than in Tulsa, Oklahoma (8.517%). These sales taxes are used to fund various state and local services.
Income
Type San Antonio Tulsa
Estimated median household income $54,923 $51,008
Estimated per capita income $28,860 $33,002
Cost of living index (U.S. average is 100) 87.7 86.5

If you make $50,000 in Tulsa, you will have to make $50,694 in San Antonio to maintain the same standard of living.

Geographical Conditions

San Antonio enjoys a location in the southeastern part of Texas, with flat to rolling terrain sprinkled with hills. Conversely, Tulsa is located in the "Green Country" region of Oklahoma, known for its green vegetation and hilly terrains.
Geographical information
Type San Antonio Tulsa
Land area 407.6 sq. miles 182.6 sq. miles
Population density 3,562.3 people per sq. mile 2,252.4 people per sq. mile
Relative area comparison
San Antonio, TX Tulsa, OK
First ancestry reported - percentage
Ancestry San AntonioTulsa
German 2.9% 5.5%
Irish 1.7% 4.4%
English 1.6% 6.1%
Italian 0.6% 1.1%
Polish 0.4% 0.4%
French 0.3% 0.6%
Scotch-Irish 0.3% 0.7%
Scottish 0.3% 1.1%
Dutch 0.1% 0.3%
Norwegian 0.1% 0.4%
Swedish 0.1% 0.3%
Welsh 0.1% 0.2%
Population origin - absolute values
Ancestry San AntonioTulsa
German 27,787 11,499
Irish 15,975 9,154
English 15,429 12,701
Italian 6,027 2,199
Polish 3,706 906
French 3,128 1,171
Scottish 2,905 2,373
Scotch-Irish 2,557 1,419
Norwegian 1,176 764
Dutch 1,089 686
Arab 982 150
Russian 950 290
Czech 873 184
Swedish 740 598
French Canadian 690 301
Portuguese 638 181
Welsh 596 500
Hungarian 443 178
Greek 434 316
Danish 343 110
Foreign born residents - absolute values
Type Count
Region San AntonioTulsa
All 211,380 43,617
Africa 5,275 2,599
Asia 37,127 10,940
Europe 7,886 2,435
Latin America 155,191 29,002
North America 1,425 487
Oceania 528 372
Foreign born residents - percentage
Type Percentage
Region San AntonioTulsa
All 14.5% 10.5%
Africa 0.4% 0.6%
Asia 2.5% 2.6%
Europe 0.5% 0.6%
Latin America 10.6% 7.0%
North America 0.1% 0.1%

Education

Both cities are known for their commitment to education. San Antonio hosts several well-known universities, like the University of Texas at San Antonio. Tulsa also boasts of respected institutions such as the University of Tulsa. San Antonio offers more diversity in terms of academic programs, while Tulsa has a more focused curriculum.
School enrollment
Type San Antonio Tulsa
Nursery, preschool 21,297 (5.7%) 5,253 (5.2%)
Kindergarten 19,263 (5.2%) 6,559 (6.5%)
Grade 1 to 4 80,911 (21.7%) 21,842 (21.6%)
Grade 5 to 8 77,401 (20.8%) 23,156 (22.9%)
Grade 9 to 12 81,405 (21.9%) 20,515 (20.3%)
College undergrad 73,408 (19.7%) 17,295 (17.1%)
Graduate or professional 18,390 (4.9%) 6,281 (6.2%)
Students in private schools - absolute values
Type Count
Grade San AntonioTulsa
Grades 1 to 8 (elementary and middle school) 15,798 8,641
Grades 9 to 12 (high school) 6,486 4,225
Undergraduate colleges 16,895 7,647
Students in private schools - percentage
Type Percentage
Grade San AntonioTulsa
Grades 1 to 8 (elementary and middle school) 10.0% 19.2%
Grades 9 to 12 (high school) 8.0% 20.6%
Undergraduate colleges 23.0% 44.2%
Educational attainment
Type San Antonio Tulsa
Less than high school 16.6% 12%
High school or equiv. 25.3% 25.2%
Less than 1 year of college 7.3% 6.6%
1 or more years of college 14.7% 13.9%
Associate degree 7.9% 7%
Bachelor's degree 17.4% 21.8%
Master's degree 7.3% 8.8%
Profess. school degree 2.2% 2.9%
Doctorate degree 1.4% 1.9%
Education level (25-year-olds and older)
Type San Antonio Tulsa
Bachelor's degree or higher 28.3% 35.3%
Graduate or professional degree 10.9% 13.5%
High school or higher 83.4% 88%

Work and Economy

San Antonio has a more diversified economy, with key industries including healthcare, tourism, military, and cybersecurity. On the other hand, Tulsa's economy traditionally relies on the oil industry, but has diversified into sectors like aerospace and technology in recent years. Both cities offer ample employment opportunities, but job-seekers in specialized industries might find one city more attractive than the other based on their specific skill set.

Biggest Employers

In San Antonio, major employers include H-E-B, USAA, and the Northside Independent School District. In Tulsa, some of the biggest employers are American Airlines, Saint Francis Health System, and the Tulsa Public Schools.
Employment and residency - absolute values
Kind San AntonioTulsa
Work and live in this city 428,926 156,679
Work and live in this county 643,655 174,406
Workers who work outside the city they live in 715,720 236,370
Workers who work outside the county they live in 33,919 12,357
Working at home 102,316 25,446
Not working at home 575,258 161,317
Daytime population change due to commuting 67,989 74,836
Employment and residency - percentage
Kind San AntonioTulsa
Work and live in this city 87.3% 83.5%
Work and live in this county 95.0% 93.4%
Workers who work outside the city they live in 12.7% 16.5%
Workers who work outside the county they live in 5.0% 6.6%
Working at home 15.1% 13.6%
Not working at home 84.9% 86.4%
Daytime population change due to commuting 5.9% 19.0%
Geographical mobility: all
Type all
Mobility San AntonioTulsa
Same house 1 year ago 83.6% 82.2%
Moved from abroad 0.6% 0.4%
Moved within same county 11.2% 12.0%
Moved from different state 1.9% 2.9%
Moved within same state 2.7% 2.5%
Geographical mobility: Asian
Type Asian
Mobility San AntonioTulsa
Same house 1 year ago 83.7% 84.4%
Moved from abroad 1.1% 0.7%
Moved within same county 5.1% 8.0%
Moved from different state 6.6% 5.9%
Moved within same state 3.5% 1.0%
Geographical mobility: Black
Type Black
Mobility San AntonioTulsa
Same house 1 year ago 78.7% 78.7%
Moved from abroad 0.2% 0.2%
Moved within same county 13.9% 14.6%
Moved from different state 2.2% 2.5%
Moved within same state 5.0% 4.0%
Geographical mobility: White
Type White
Mobility San AntonioTulsa
Same house 1 year ago 81.5% 83.2%
Moved from abroad 0.8% 0.2%
Moved within same county 11.4% 11.6%
Moved from different state 2.8% 2.7%
Moved within same state 3.6% 2.3%
Building permits
Type Average valueCount
City San AntonioTulsaSan AntonioTulsa
1997 $60,500 $141,000 4,323 488
1998 $69,900 $140,300 5,752 594
1999 $68,900 $149,500 5,892 685
2000 $72,700 $152,300 5,570 632
2001 $73,200 $157,900 6,281 590
2002 $68,300 $158,500 6,454 444
2003 $129,500 $157,700 6,105 461
2004 $131,300 $176,700 7,431 519
2005 $144,500 $191,600 8,266 717
2006 $155,100 $241,600 7,266 699
2007 $166,500 $230,600 4,253 667
2008 $174,900 $245,300 2,665 436
2009 $178,000 $209,100 2,836 372
2010 $176,100 $227,600 2,337 335
2011 $179,700 $227,000 1,594 319
2012 $185,200 $198,400 1,896 577
2013 $177,200 $241,300 2,102 436
2014 $214,100 $261,200 2,270 402
2015 $208,100 $284,300 2,217 344
2016 $205,700 $241,200 2,152 436
2017 $200,100 $271,200 2,489 389
2018 $197,900 $223,400 3,266 471
2019 $237,200 $241,500 3,890 629
2020 $234,300 $251,000 4,275 521
2021 $237,500 $254,500 6,567 652

There were 6,567 building permits issued in San Antonio in 2012 (4973 more than in 2011) compared to 652 building permits issued in Tulsa in 2012 (333 more than in 2011).

In San Antonio (Bexar County), 51.6% voted for Democrats and 47.1% for Republicans in 2012 Presidential Election. In Tulsa (Tulsa County), 36.3% voted for Democrats and 63.7% for Republicans.

Elections
Type DemocratsRepublicansOther
Year San AntonioTulsaSan AntonioTulsaSan AntonioTulsa
2020 58.3% 40.9% 40.1% 56.5% 1.5% 2.7%
2016 54.2% 35.6% 40.8% 58.4% 5.0% 6.1%
2012 51.6% 36.3% 47.1% 63.7% 1.4% 0.0%
2008 52.3% 37.8% 46.7% 62.2% 1.0% 0.0%
2004 44.5% 35.6% 55.0% 64.4% 0.6% 0.0%
2000 44.9% 37.3% 52.3% 61.3% 2.7% 1.3%
1996 49.7% 37.1% 44.6% 53.6% 5.7% 9.3%
Breakdown of population affiliated with a religious congregation
Type AdherentsCongregations
Religion San AntonioTulsaSan AntonioTulsa
CATHOLIC CHURCH 30.8% 8.1% 8.6% 3.1%
SOUTHERN BAPTIST CONVENTION 6.8% 14.9% 23.5% 18.6%
MUSLIM ESTIMATE 1.2% 0.5% 0.8% 0.7%
LUTHERAN CHURCH 0.7% 0.7% 1.0% 1.2%
EPISCOPAL CHURCH 0.6% 0.8% 1.6% 1.3%
EVANGELICAL LUTHERAN CHURCH IN AMERICA 0.6% 0.4% 2.2% 0.9%
AMERICAN BAPTIST CHURCHES IN THE USA 0.2% 0.3% 0.3% 0.5%
SEVENTH DAY ADVENTIST CHURCH 0.2% 0.4% 1.3% 1.1%
EVANGELICAL PRESBYTERIAN CHURCH 0.0% 0.4% 0.1% 0.1%
INTERNA PENTECO HOLINESS CHURCH 0.0% 0.7% 0.4% 0.7%
NATIONAL ASSOCIATION FREE WILL BAPTISTS 0.0% 0.5% 0.2% 3.1%

Weather

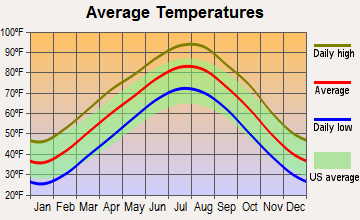
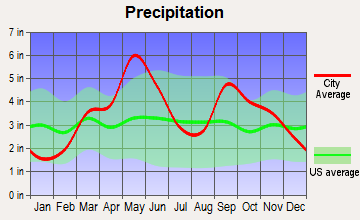
San Antonio enjoys a subtropical climate, with hot summers and mild winters, while Tulsa experiences a more varied climate with hot summers and colder winters. Tornadoes can occur in Tulsa, given Oklahoma's location in the US's "Tornado Alley". Conversely, San Antonio is susceptible to hot, dry conditions, sometimes leading to droughts.
Weather and climate
Type San Antonio Tulsa
Temperature - Average 68.7°F 60.4°F
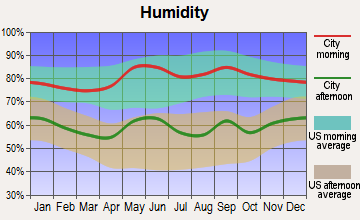
Humidity - Average morning or afternoon humidity 74.9% 73.8%
Humidity - Differences between morning and afternoon humidity 37% 33%
Humidity - Maximum monthly morning or afternoon humidity 87% 85%
Humidity - Minimum monthly morning or afternoon humidity 50% 52%
Precipitation - Yearly average 32.2 in 42.1 in
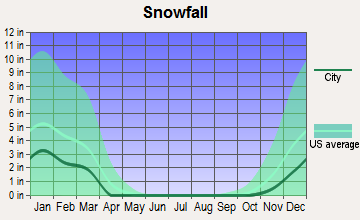
Snowfall - Yearly average 1.2 in 18.4 in
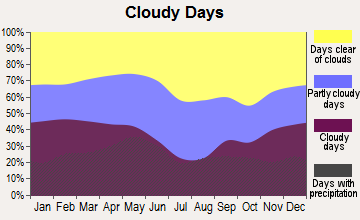
Clouds - Number of days clear of clouds 17.5% 21.1%
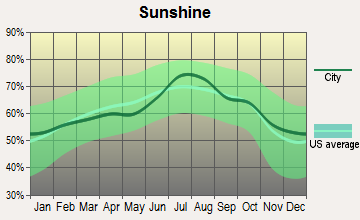
Sunshine amount - Average 62.4% 64.8%
Sunshine amount - Differences during a year 24% 24%
Sunshine amount - Maximum monthly 72% 74%
Sunshine amount - Minimum monthly 48% 50%
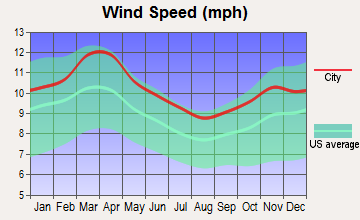
Wind speed - Average 8.9 mph 10.2 mph

Average climate in San Antonio, Texas

Chicago, Illinois average temperatures Chicago, Illinois average precipitation Chicago, Illinois humidity Chicago, Illinois wind speed Chicago, Illinois snowfall Chicago, Illinois sunshine Chicago, Illinois clear and cloudy days
 

Average climate in Tulsa, Oklahoma

Chicago, Illinois average temperatures Chicago, Illinois average precipitation Chicago, Illinois humidity Chicago, Illinois wind speed Chicago, Illinois snowfall Chicago, Illinois sunshine Chicago, Illinois clear and cloudy days
 

Air pollution
Type AQICONO2OZONEPBPM10PM25SO2
Year San AntonioTulsaSan AntonioTulsaSan AntonioTulsaSan AntonioTulsaTulsa San Antonio San AntonioTulsaSan AntonioTulsa
2018 83 88 N/A 0.24 4.9 N/A 25.6 28.6 0.004 N/A N/A N/A 8.0 11.6 0.2 0.4
2017 85 80 N/A 0.22 5.1 N/A 26.9 29.9 0.004 N/A N/A N/A 8.4 10.2 1.7 0.5
2016 79 86 N/A 0.24 5.2 N/A 25.7 29.1 0.005 N/A N/A N/A 8.2 9.5 0.8 0.5
2015 76 74 N/A 0.25 4.7 N/A 25.4 28.1 0.004 N/A N/A N/A 9.2 8.6 0.7 0.8
2014 84 74 N/A 0.16 5.5 N/A 27.3 29.2 0.005 N/A N/A N/A 9.5 9.2 0.6 0.3
2013 79 85 N/A 0.21 4.1 N/A 28.2 29.8 0.005 N/A N/A N/A 9.0 10.1 0.7 0.5
2012 77 103 N/A 0.21 4.5 N/A 27.5 32.4 0.007 N/A 18.1 N/A 9.2 11.7 N/A 0.7
2011 85 108 N/A 0.27 4.6 N/A 29.2 33.8 0.005 N/A 18.9 N/A 9.9 13.8 N/A 0.8
2010 75 83 0.21 0.26 7.2 N/A 25.8 30.1 0.004 N/A 17.1 N/A 9.2 12.2 N/A 0.7
2009 74 88 0.23 0.26 8.3 N/A 25.7 29.8 0.004 N/A 19.5 N/A 9.8 12.2 0.4 0.7
2008 84 71 0.26 N/A 9.3 N/A 26.8 26.7 0.007 N/A 19.8 N/A 10.1 N/A 0.5 N/A
2007 83 77 0.49 0.32 9.3 N/A 26.3 28.8 0.007 N/A 23.4 N/A 10.3 N/A N/A 0.8
2006 86 95 0.51 N/A 9.7 N/A 32.7 32.9 N/A N/A 24.8 N/A 9.8 N/A N/A N/A
2005 86 84 0.53 N/A 10.7 N/A 30.8 28.9 N/A N/A 22.3 N/A 10.1 N/A N/A N/A
2004 76 71 0.48 N/A 10.4 N/A 29.6 27.5 N/A N/A 22.4 N/A N/A N/A N/A N/A
2003 77 94 0.57 N/A 10.3 N/A 28.5 29.2 N/A N/A 26.7 N/A N/A N/A N/A N/A
2002 88 85 0.52 0.83 11.2 7.8 30.3 27.7 N/A N/A N/A N/A N/A N/A N/A N/A
2001 78 102 0.57 0.75 11.9 14.4 29.3 30.6 N/A N/A N/A N/A N/A N/A N/A N/A
2000 82 101 0.52 0.69 11.7 15.3 29.6 28.9 N/A N/A N/A N/A N/A N/A N/A N/A
Natural disasters
Type San Antonio Tulsa
Tornado activity compared to U.S. average 91.5% 277.6%
Earthquake activity compared to U.S. average 73.7% 901.9%
Natural disasters compared to U.S. average 21% 34%

Transportation

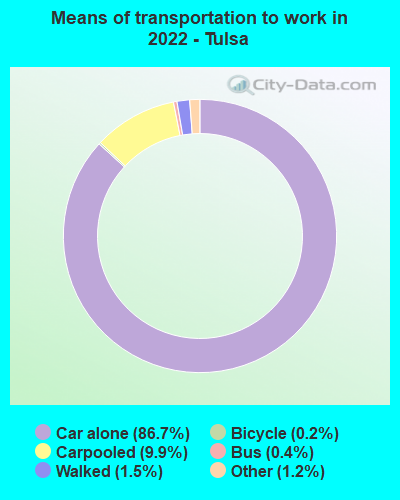
San Antonio, being larger, has a greater extent of public transportation with buses, bike-sharing programs and growing rideshare availability. Tulsa too has a decent public transportation system, though less extensive. Both cities are car-dependent, with commuting best done by personal vehicle.
Transport
Type San Antonio Tulsa
Amtrak stations 1 1
Amtrak stations nearby 1 1
FAA registered aircraft 987 808
FAA registered aircraft manufacturers and dealers 29 35
Means of transportation to work
Type San Antonio Tulsa
Bicycle 0.2% 0.1%
Bus 1.6% 0.1%
Carpooled 12.9% 9%
Car alone 81.9% 87.9%
Motorcycle 0.1% 0.1%
Taxicab 0.1% 0.1%
Walked 1.6% 1.4%
Means of transportation to work
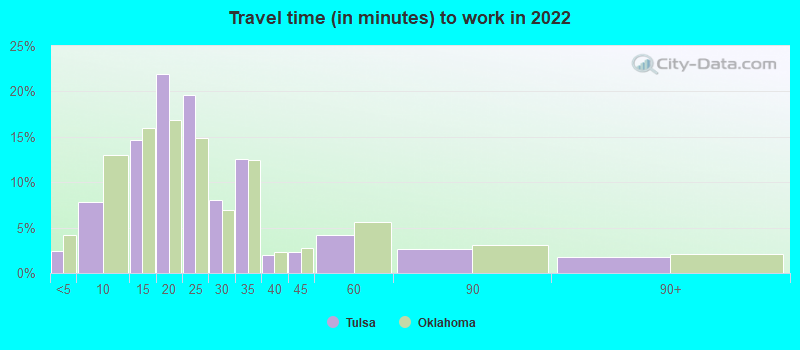
Average travel time to work
Type San Antonio Tulsa
Average 27 min 23.8 min
Other means 23.4 min 19.2 min
Public transportation 43.5 min 40.1 min
Travel time to work
Time leaving to work
Travel time to work
Time leaving to work
Private vehicle occupancy
Type San Antonio Tulsa
Average 1.2 1.2
Drove alone 84.6% 88.9%
In 2 person carpool 10.4% 8.7%
In 3 person carpool 3.3% 1.5%
In 4 person carpool 1% 0.3%
In 5-6 person carpool 0.6% 0.5%
In 7+ person carpool 0.1% 0.1%

How many people usually rode to work in the car, truck or van.

Real Estate

Real estate is more expensive in San Antonio than in Tulsa, with median home prices being higher in San Antonio. However, San Antonio also offers a more diverse housing market with options ranging from downtown condos to single-family homes. But the lower cost in Tulsa could be more attractive to some homebuyers or renters.

Neighborhoods

Both cities boast diverse neighborhoods. In San Antonio, the River Walk area is popular for its blend of history, culture, and modern entertainment. In Tulsa, the Brookside and Cherry Street areas are trendy thanks to a mix of shopping, restaurants, and nightlife.
Houses and residents
Type San Antonio Tulsa
Houses 603,670 194,402
Average household size (people) 2.7 2.3
Median year apartment built 1987 1975
Median year house/condo built 1981 1969
Length of stay in the house since moving in 14.3 years 12.9 years
Houses occupied 549,245 (91%) 173,943 (89.5%)
Houses occupied by owners 290,123 (52.8%) 89,307 (51.3%)
Houses occupied by renters 259,122 (47.2%) 84,636 (48.7%)
Median rent asked for vacant for-rent units $1,143 $899.30
Median monthly housing costs $1,101 $897
Median price asked for vacant for-sale houses and condos $189,213 $163,212
Estimated median house or condo value $197,600 $172,000
Median numbers of rooms 5.1 5.2
Median number of rooms in apartments 4 4.1
Median number of rooms in houses and condos 6.2 6.4
Median house price - detached houses $238,319 $247,367
Median house price - in 2-unit structures $407,491 $496,968
Median house price - in 3-to-4-unit structures $120,363 $94,964
Median house price - in 5 or more unit structures $163,867 $176,274
Median house price - mobile homes $105,850 $73,235
Median house price - occupied boats, rvs, vans etc. $20,297 $166,906
Median house price - Townhouses or other attached units $188,542 $184,309
Median house price - All housing units $234,615 $241,263
Median house age 37 49
Renting percentage 43.5% 46.5%
Housing density (houses/condos per square mile) 1,481.2 1,064.4
House value disparities 33.6% 41.8%
Household income disparities 44.7% 48.1%
Median household income for houses/condes with a mortgage $87,382 $84,820
Median household income for apartments without a mortgage $60,785 $57,403
Housing units without a mortgage 5,815 (3.5%) 855 (1.7%)
Housing units with both a second mortgage and home equity loan 6,350 (3.8%) 2,464 (4.8%)
Housing units with a mortgage 160,674 (96.5%) 50,494 (98.3%)
Housing units with a home equity loan 129 (0.1%) 93 (0.2%)
Housing units with a second mortgage 7,761 (4.7%) 3,580 (7%)
House/condo owner moved in on average (years ago) 13 11
House/condo renter moved in on average (years ago) 1 1
Housing units lacking complete kitchen facilities 2.1% 2.9%
Housing units lacking complete plumbing facilities 1.3% 1.7%
Housing units in structures
Housing units in structures San AntonioTulsa
One, detached 60.4% 62.9%
One, attached 2.7% 2.8%
Two 2.2% 1.9%
3 or 4 4.9% 5.0%
5 to 9 7.8% 6.8%
10 to 19 8.5% 9.2%
20 to 49 5.4% 4.4%
50 or more 6.6% 5.8%
Mobile homes 1.5% 1.1%
Boats, RVs, vans, etc. 0.0% 0.2%
Median real estate property taxes paid for housing units
Type San Antonio Tulsa
With mortgages $4,486 (2%) $1,934 (1%)
With no mortgages $2,691 (1.6%) $1,521 (1%)
Marital status
Type San Antonio Tulsa
Divorced 11.6% 13.7%
Never married 37.4% 36.2%
Now married 43.6% 42.6%
Separated 2.6% 2.1%
Widowed 4.8% 5.4%
Class of workers - percentage
Class of Workers San AntonioTulsa
Employee of private company 68.4% 68.9%
Local government workers 7.5% 5.3%
Private not-for-profit wage and salary workers 6.9% 8.9%
Self-employed workers in own not incorporated business 6.8% 7.4%
State government workers 4.3% 3.1%
Federal government workers 3.2% 2.2%
Self-employed in own incorporated business 2.7% 4.0%
Unpaid family workers 0.1% 0.2%
Class of workers - absolute values
Class of Workers San AntonioTulsa
Employee of private company 464,438 130,609
Federal government workers 21,964 4,148
Local government workers 50,959 10,080
Private not-for-profit wage and salary workers 46,650 16,859
Self-employed in own incorporated business 18,647 7,641
Self-employed workers in own not incorporated business 46,328 13,964
State government workers 29,486 5,897
Unpaid family workers 657 284

Industries and Occupations

San Antonio offers more diversity in industries which ranges from healthcare to tourism, military, and cybersecurity. In contrast, Tulsa has traditionally depended on the oil industry, although there’s been considerable growth in aerospace and technology sectors recently.
Most common male industries
Industry San AntonioTulsa
Construction 16.5% 12.2%
Retail trade 10.3% 12.3%
Accommodation and food services 8.3% 6.1%
Professional, scientific, and technical services 7.9% 8.1%
Transportation and warehousing 7.5% 7.8%
Manufacturing 7.1% 12.2%
Health care and social assistance 6.6% 7.2%
Finance and insurance 6.0% 3.2%
Educational services 6.0% 5.6%
Administrative and support and waste management services 5.5% 4.7%
Other services, except public administration 5.0% 3.9%
Public administration 4.1% 3.0%
Wholesale trade 2.6% 3.1%
Information 1.7% 3.2%
Real estate and rental and leasing 1.4% 1.9%
Arts, entertainment, and recreation 1.4% 2.5%
Mining, quarrying, and oil and gas extraction 0.8% 1.1%
Utilities 0.8% 1.2%
Agriculture, forestry, fishing and hunting 0.5% 0.6%
Management of companies and enterprises 0.1% 0.2%
Most common female industries
Industry San AntonioTulsa
Health care and social assistance 21.2% 23.3%
Educational services 15.0% 11.7%
Accommodation and food services 11.7% 8.3%
Retail trade 10.0% 12.3%
Finance and insurance 8.1% 4.6%
Administrative and support and waste management services 5.2% 4.3%
Professional, scientific, and technical services 5.2% 6.0%
Other services, except public administration 5.1% 5.3%
Manufacturing 4.3% 5.0%
Public administration 3.8% 3.3%
Transportation and warehousing 2.4% 2.5%
Arts, entertainment, and recreation 1.7% 2.8%
Construction 1.6% 1.3%
Real estate and rental and leasing 1.6% 2.1%
Wholesale trade 1.2% 2.0%
Information 0.8% 2.2%
Management of companies and enterprises 0.3% 0.2%
Agriculture, forestry, fishing and hunting 0.3% 0.6%
Mining, quarrying, and oil and gas extraction 0.2% 0.8%
Utilities 0.2% 1.4%
Most common male occupations
Occupation San AntonioTulsa
Construction and extraction occupations 13.5% 10.5%
Management occupations 9.3% 11.0%
Sales and related occupations 9.0% 7.4%
Installation, maintenance, and repair occupations 6.6% 5.9%
Office and administrative support occupations 6.5% 6.0%
Food preparation and serving related occupations 6.4% 3.9%
Transportation occupations 6.1% 4.8%
Computer and mathematical occupations 5.5% 4.6%
Material moving occupations 5.4% 6.8%
Production occupations 4.7% 8.9%
Building and grounds cleaning and maintenance occupations 4.3% 4.3%
Business and financial operations occupations 3.6% 4.4%
Educational instruction, and library occupations 3.5% 2.8%
Health diagnosing and treating practitioners and other technical occupations 2.4% 3.3%
Architecture and engineering occupations 2.3% 3.2%
Personal care and service occupations 1.5% 1.3%
Healthcare support occupations 1.4% 0.6%
Community and social service occupations 1.4% 1.2%
Firefighting and prevention, and other protective service workers including supervisors 1.3% 1.7%
Legal occupations 1.2% 2.4%
Most common female occupations
Occupation San AntonioTulsa
Office and administrative support occupations 18.9% 17.7%
Sales and related occupations 11.0% 10.1%
Management occupations 9.2% 9.3%
Educational instruction, and library occupations 9.2% 8.3%
Food preparation and serving related occupations 8.6% 6.8%
Healthcare support occupations 7.2% 5.8%
Business and financial operations occupations 5.8% 5.9%
Health diagnosing and treating practitioners and other technical occupations 5.1% 7.1%
Building and grounds cleaning and maintenance occupations 4.2% 3.2%
Personal care and service occupations 3.0% 4.1%
Production occupations 2.8% 3.6%
Health technologists and technicians 2.6% 3.1%
Community and social service occupations 2.4% 2.2%
Arts, design, entertainment, sports, and media occupations 2.2% 2.1%
Computer and mathematical occupations 1.5% 1.3%
Material moving occupations 1.4% 3.0%
Legal occupations 0.9% 1.9%
Architecture and engineering occupations 0.4% 1.3%
Food environment data per 10,000 residents
Food environment statistics San AntonioTulsa
Number of convenience stores (no gas) 3.1 2.8
Number of convenience stores (with gas) 1.1 0.5
Number of full-service restaurants 6.8 8.4
Number of grocery stores 1.0 1.5
Number of supercenters and club stores 0.1 0.2
Food environment - absolute values
Food environment statistics San AntonioTulsa
Number of convenience stores (no gas) 487 166
Number of convenience stores (with gas) 181 30
Number of full-service restaurants 1,073 489
Number of grocery stores 162 88
Number of supercenters and club stores 19 9
Obesity and diabetes
Food environment statistics rate San AntonioTulsa
Adult diabetes rate 8.3% 9.4%
Adult obesity rate 26.3% 27.3%
Low-income preschool obesity rate 16.8% 0.0%

Health Care

Both cities boast excellent healthcare facilities. San Antonio is home to the South Texas Medical Center, a healthcare and bioscience giant, while Tulsa houses some of Oklahoma's top hospitals, including the Saint Francis Hospital and the Hillcrest Medical Center.
Health (county statistics)
Type San Antonio Tulsa
General health status score of residents in this county from 1 (poor) to 5 (excellent) 3.4 3.4
Average weight of females (lbs) 162.7 lbs 165.7 lbs
Average weight of males (lbs) 199.1 lbs 202 lbs
Residents visited a dentist within the past year 65.4% 62.3%
Residents exercised in the past month 71.2% 67.7%
Adult residents drank alcohol in the past 30 days 53.6% 41.3%
Residents smoked 100+ cigarettes in their lives 37.5% 44.3%

Fatal vehicle accidents per 100,000 residents
Type Total count per 100,000Drunk per 100,000Fatal count per 100,000Pedestrian count per 100,000Person count per 100,000Vehicle count per 100,000
Year San AntonioTulsaSan AntonioTulsaSan AntonioTulsaSan AntonioTulsaSan AntonioTulsaSan AntonioTulsa
2021 12.8 17.0 0.0 0.0 13.8 19.2 5.0 6.1 26.2 35.2 19.8 24.8
2020 10.2 14.1 3.3 3.9 10.9 14.8 4.4 4.4 22.8 30.5 16.5 23.0
2019 9.9 9.0 2.9 2.0 10.0 9.5 4.3 5.0 22.2 16.7 14.9 11.7
2018 9.5 11.7 2.4 2.5 9.7 12.5 3.5 4.2 21.7 19.2 14.9 19.5
2017 9.6 11.2 2.9 5.2 9.8 11.2 3.3 4.5 23.1 22.4 14.6 14.9
2016 12.4 12.1 3.0 5.2 13.4 13.1 5.1 3.7 26.4 24.5 18.9 17.6
2015 9.9 10.9 3.2 2.0 10.6 11.2 3.6 4.7 21.4 24.8 15.0 14.6
2014 9.7 12.3 3.1 4.3 10.5 12.8 4.0 3.3 20.5 26.8 14.1 19.8
2013 10.9 11.3 4.0 3.3 12.0 11.6 4.1 4.3 24.6 27.6 15.8 20.8
2012 9.0 11.2 2.7 5.8 10.0 11.9 3.4 2.0 19.9 25.1 14.4 15.2
2011 8.6 11.1 3.9 4.3 8.9 12.1 2.4 3.0 18.7 24.5 12.6 18.9
2010 8.4 10.7 4.3 5.9 9.2 11.2 2.6 1.8 18.6 24.5 12.7 16.8
2009 8.9 12.3 3.9 4.4 9.3 13.3 2.5 1.8 21.8 30.3 14.3 20.0
2008 8.3 13.5 4.2 6.0 8.8 14.3 1.9 2.6 22.0 36.3 13.5 23.1
2007 7.8 11.2 3.2 6.0 9.0 12.5 1.7 6.2 19.9 31.7 11.9 18.7
2006 9.0 10.5 1.7 4.4 9.6 10.7 2.5 2.1 23.8 27.5 13.7 16.7
2005 10.1 11.8 2.4 4.2 11.3 11.8 3.5 3.9 29.6 31.0 16.8 19.7
2004 11.0 12.0 4.0 3.7 13.2 12.3 3.4 3.9 30.9 33.4 17.1 17.2
2003 9.9 9.3 2.4 4.6 11.0 9.8 2.5 3.1 28.2 28.4 15.4 15.2
2002 11.3 9.2 2.4 2.6 12.3 9.5 2.8 2.0 31.7 24.8 17.6 15.3
2001 7.7 9.4 1.4 3.8 8.6 10.5 2.5 1.8 21.2 27.0 11.8 16.1
2000 10.2 10.4 2.9 3.6 11.7 11.7 3.2 2.0 29.8 28.8 14.6 18.1
1999 9.2 13.4 3.6 6.0 9.8 14.7 3.1 4.2 24.3 37.7 13.4 20.7
1998 10.7 8.7 3.4 1.8 11.5 8.9 3.7 2.9 29.6 22.0 15.8 13.4
1997 10.0 12.1 3.0 3.2 10.5 12.7 3.4 3.2 27.8 34.3 16.4 19.0
1996 10.8 9.0 4.0 2.1 12.2 9.6 2.8 2.7 28.7 23.9 15.8 13.3
1995 10.8 9.1 3.8 2.4 11.7 9.9 3.8 2.9 30.5 24.8 16.3 15.2
1994 9.7 10.1 3.1 2.9 10.7 11.4 3.4 2.7 27.0 30.0 13.6 16.5
1993 10.5 6.4 4.5 2.4 10.9 6.4 2.9 2.1 28.3 15.1 14.7 8.7
1992 8.9 10.1 4.7 3.7 9.5 10.9 2.9 2.9 25.8 29.0 13.6 16.7
1991 9.0 9.7 4.4 3.2 9.4 9.9 2.7 2.4 26.1 24.4 13.9 13.7
1990 8.8 10.9 4.3 4.1 9.1 12.8 0.0 0.0 19.3 31.5 12.0 18.2
1989 13.0 10.4 7.1 3.3 14.1 11.2 0.0 0.0 33.4 22.6 19.8 13.9
1988 12.5 8.2 6.1 3.8 14.1 9.0 0.0 0.0 34.7 19.9 18.1 12.3
1987 13.4 8.8 4.7 1.9 14.1 9.0 0.0 0.0 38.7 24.1 19.5 15.1
1986 16.9 11.2 4.8 3.0 18.0 11.8 0.0 0.0 45.2 34.8 24.4 17.5
1985 15.7 8.5 2.3 3.6 17.3 9.1 0.0 0.0 42.7 25.3 24.0 13.5
1984 17.0 11.3 4.8 5.5 19.0 11.8 0.0 0.0 37.7 24.2 22.1 17.1
1983 14.4 12.4 4.0 3.9 16.2 13.5 0.0 0.0 34.2 31.1 20.1 20.4
1982 16.7 14.9 3.9 9.4 18.4 16.8 0.0 0.0 36.5 35.6 21.8 22.6
1981 17.7 16.0 2.4 8.6 19.2 17.7 0.0 0.0 40.1 40.1 21.6 26.0
1980 18.4 13.9 2.2 6.4 20.1 15.2 0.0 0.0 42.8 29.1 25.1 19.7
1979 15.5 11.5 2.8 4.2 16.7 11.5 0.0 0.0 35.3 24.0 21.4 17.6
1978 15.9 11.8 3.0 3.7 17.0 13.0 0.0 0.0 33.4 26.5 19.4 16.1
1977 18.9 10.8 4.8 4.0 20.2 11.4 0.0 0.0 50.0 27.3 26.7 18.5
1976 12.4 10.6 0.3 2.9 14.2 11.5 0.0 0.0 31.5 26.1 16.5 17.8
1975 12.6 10.7 0.3 2.9 14.4 11.6 0.0 0.0 32.1 26.3 16.8 17.9

Fatal vehicle accidents
Type Total countDrunkFatal countPedestrian countPerson countVehicle count
Year San AntonioTulsaSan AntonioTulsaSan AntonioTulsaSan AntonioTulsaSan AntonioTulsaSan AntonioTulsa
1975 91 37 2 10 104 40 0 0 231 91 121 62
1976 91 37 2 10 104 40 0 0 231 91 121 62
1977 141 38 36 14 151 40 0 0 373 96 199 65
1978 121 42 23 13 129 46 0 0 254 94 147 57
1979 120 41 22 15 129 41 0 0 273 86 165 63
1980 145 50 17 23 158 55 0 0 336 105 197 71
1981 142 58 19 31 154 64 0 0 321 145 173 94
1982 136 54 32 34 150 61 0 0 298 129 178 82
1983 120 45 33 14 135 49 0 0 284 113 167 74
1984 144 41 41 20 161 43 0 0 319 88 187 62
1985 135 31 20 13 149 33 0 0 368 92 207 49
1986 148 41 42 11 158 43 0 0 396 127 214 64
1987 119 32 42 7 126 33 0 0 345 88 174 55
1988 113 30 55 14 128 33 0 0 314 73 164 45
1989 120 38 65 12 130 41 0 0 308 83 182 51
1990 88 40 43 15 91 47 0 0 193 116 120 67
1991 91 36 45 12 95 37 27 9 264 91 141 51
1992 92 38 49 14 98 41 30 11 266 109 140 63
1993 110 24 47 9 115 24 31 8 297 57 154 33
1994 104 38 33 11 115 43 36 10 289 113 146 62
1995 117 34 41 9 127 37 41 11 331 93 177 57
1996 119 34 44 8 134 36 31 10 316 90 174 50
1997 112 46 33 12 117 48 38 12 311 130 184 72
1998 121 33 38 7 130 34 42 11 336 84 179 51
1999 106 51 41 23 112 56 36 16 279 144 154 79
2000 117 41 33 14 134 46 37 8 341 113 167 71
2001 91 37 16 15 101 41 29 7 249 106 139 63
2002 135 36 29 10 148 37 34 8 380 97 211 60
2003 120 36 29 18 134 38 31 12 343 110 188 59
2004 136 46 49 14 163 47 42 15 383 128 212 66
2005 127 45 30 16 142 45 44 15 373 118 211 75
2006 116 40 22 17 124 41 32 8 307 105 177 64
2007 103 43 43 23 119 48 23 24 263 122 158 72
2008 112 52 57 23 119 55 26 10 297 140 182 89
2009 122 48 53 17 128 52 34 7 299 118 196 78
2010 111 42 57 23 122 44 34 7 247 96 168 66
2011 117 44 53 17 121 48 32 12 254 97 172 75
2012 124 44 38 23 138 47 47 8 275 99 199 60
2013 154 45 56 13 169 46 58 17 347 110 222 83
2014 139 49 45 17 151 51 57 13 295 107 203 79
2015 145 44 47 8 155 45 52 19 313 100 219 59
2016 184 49 44 21 199 53 76 15 393 99 282 71
2017 145 45 44 21 148 45 50 18 349 90 221 60
2018 145 47 37 10 149 50 54 17 332 77 228 78
2019 153 36 45 8 155 38 67 20 343 67 230 47
2020 147 58 47 16 157 61 63 18 328 126 237 95
2021 186 70 0 0 200 79 73 25 381 145 288 102
Local government: full-time employees
Job San AntonioTulsa
Airports 407 140
Financial administration 597 271
Firefighters 1,791 735
Fire - other 110 16
Gas supply 313 0
Health 486 25
Judicial and legal 205 62
Local libraries 313 0
Natural resources 111 0
Other and unallocable 697 339
Other government administration 297 206
Parks and recreation 1,079 78
Police - other 636 169
Police protection - officers 2,549 823
Sewerage 470 170
Solid waste management 672 41
Streets and highways 587 288
Totals for government 16,101 3,874
Water supply 1,352 320
Welfare 337 0
Local government: part-time employees
Job San AntonioTulsa
Airports 4 0
Health 14 2
Judicial and legal 8 1
Local libraries 199 0
Other and unallocable 10 0
Other government administration 6 7
Parks and recreation 39 12
Police - other 233 39
Sewerage 1 0
Streets and highways 0 2
Totals for government 565 66
Transit 0 2
Water supply 22 0
Welfare 22 0
Place of birth - Foreign born
Residents San AntonioTulsa
All residents 14.6% 10.5%
American Indian / Alaska Native residents 31.2% 4.3%
Asian residents 68.6% 67.8%
Black or African American residents 7.0% 2.7%
Native Hawaiian / Pacific Islander residents 8.7% 40.6%
Other race residents 21.1% 47.3%
Two or more races residents 15.8% 12.0%
White residents 5.8% 3.2%
White alone, not Hispanic / Latino residents 4.9% 2.3%
Place of birth - Native, outside of US
Residents San AntonioTulsa
All residents 2.6% 1.3%
American Indian / Alaska Native residents 0.5% 1.7%
Asian residents 1.7% 2.3%
Black or African American residents 1.9% 0.3%
Native Hawaiian / Pacific Islander residents 46.0% 5.4%
Other race residents 3.2% 1.8%
Two or more races residents 2.8% 1.8%
White residents 2.3% 0.9%
White alone, not Hispanic / Latino residents 2.2% 0.9%
Place of birth - Born in state of residence
Residents San AntonioTulsa
All residents 65.4% 56.6%
American Indian / Alaska Native residents 58.0% 78.6%
Asian residents 20.6% 18.1%
Black or African American residents 56.6% 68.8%
Native Hawaiian / Pacific Islander residents 18.3% 36.8%
Other race residents 66.3% 34.2%
Two or more races residents 70.4% 65.5%
White residents 64.8% 56.1%
White alone, not Hispanic / Latino residents 50.0% 55.6%
Place of birth - Born in other state
Residents San AntonioTulsa
All residents 17.4% 31.6%
American Indian / Alaska Native residents 10.3% 15.3%
Asian residents 9.1% 11.8%
Black or African American residents 34.4% 28.2%
Native Hawaiian / Pacific Islander residents 27.1% 17.2%
Other race residents 9.4% 16.7%
Two or more races residents 11.0% 20.6%
White residents 27.2% 39.8%
White alone, not Hispanic / Latino residents 42.8% 41.3%
English speakers (speaking English at home)
Type San Antonio Tulsa
Born in the United States residents 82.3% 90.6%
Foreign born residents 10.3% 13.3%
Native, born elsewhere residents 49.8% 57.7%
Total residents 58.3% 81.2%
Mechanisms of homicide
Mechanism San AntonioTulsa
Homicides from 2000 to 2006 787 350
Cut / Pierce 113 38
Firearm 458 239
Suffocation 38 0
Mechanisms of homicide per 1,000,000 residents
Mechanism San AntonioTulsa
Homicides from 2000 to 2006 76.7 87.8
Cut / Pierce 11.0 9.5
Firearm 44.6 60.0
Suffocation 3.7 0
Mechanisms of suicide per 1,000,000 residents
Mechanism San AntonioTulsa
Suicides from 2000 to 2006 100.2 155.6
Firearm 51.5 88.8
Poisoning 18.6 29.4
Suffocation 22.5 29.1

Infrastructure

San Antonio is larger in area and population than Tulsa, leading to more urban development and better infrastructure. Tulsa, however, also boasts of well-developed infrastructure with continuous efforts for improvement and modernization. Both cities are historically rich, contributing to the preservation and restoration of various landmarks.
Infrastructure
Type San Antonio Tulsa
Hospitals 130 45
TV stations 30 20
Arenas or stadiums 2 2
Bank branches located here 333 160
Bank institutions located here 41 40
Main business address for public companies 23 27
Drinking water stations with no reported violations in the past 7 0
Drinking water stations with reported violations in the past 32 1

Schools

School facilities
Type San Antonio Tulsa
Private elementary/middle schools 43 15
Private high schools 28 18
Public elementary/middle schools 367 85
Public high schools 110 15
Colleges/Universities 49 26
HMDA - Conventional home purchase loans - Applications denied
Year San AntonioTulsa
1999 6,847 2,135
2000 2,930 1,531
2001 2,383 1,216
2002 2,313 1,106
2003 3,759 1,243
2004 5,180 1,354
2005 6,554 1,709
2006 6,983 1,756
2007 4,562 1,014
2008 1,781 517
2009 847 327

Culture and Food

Both cities have rich cultural scenes with a variety of festivals, museums, music, and food. San Antonio reflects a blend of Mexican and Texan cultures while Tulsa is known for its arts and music scene, including the famous Tulsa Sound in Country and Western Music. San Antonio's culinary scene is rich in Mexican cuisine, while Tulsa offers a variety of options including BBQ and Southern comfort food.

Sports Teams

San Antonio is home to the NBA's San Antonio Spurs, while Tulsa doesn't have a major league sports team. However, Tulsa does have minor league teams and college sports, with the University of Tulsa competing in NCAA Division I.