Tulsa, Oklahoma

Tulsa: Tulsa twilight.

Tulsa: The Philbrook Museum Of Art renovated gardens.

Tulsa: Tulsa October Sunset, facing west at 18th and Riverside

Tulsa: Tulsa
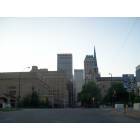
Tulsa: 8th St Downtown
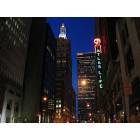
Tulsa: Main Street

Tulsa: Tulsa Salutes Freedom with fireworks launched from the 21st St. bridge, viewable from both sides of the Arkansas River.
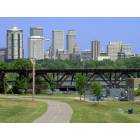
Tulsa: Tulsa
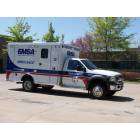
Tulsa: EMSA Ambulance
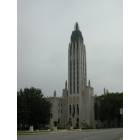
Tulsa: Boston Avenue Methodist Church

Tulsa: Tulsa
- see
85
more - add
your
Submit your own pictures of this city and show them to the world
- OSM Map
- General Map
- Google Map
- MSN Map
Population change since 2000: +4.8%
 |
| Males: 201,082 | |
| Females: 210,785 |
| Median resident age: | 35.8 years |
| Oklahoma median age: | 37.1 years |
Zip codes: 74103, 74104, 74105, 74106, 74110, 74112, 74114, 74115, 74119, 74120, 74128, 74129, 74130, 74135, 74136, 74145.
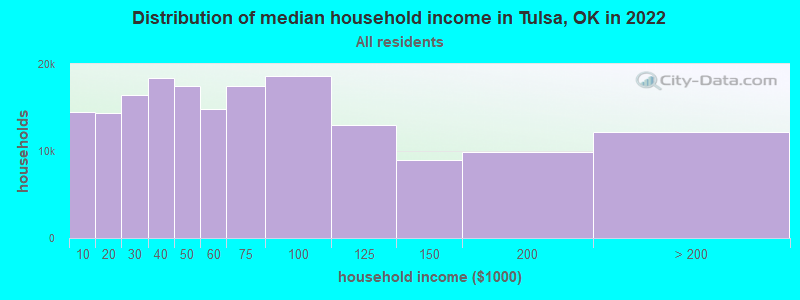
Tulsa Zip Code Map| Tulsa: | $54,040 |
| OK: | $59,673 |
Estimated per capita income in 2022: $35,447 (it was $21,534 in 2000)
Tulsa city income, earnings, and wages data
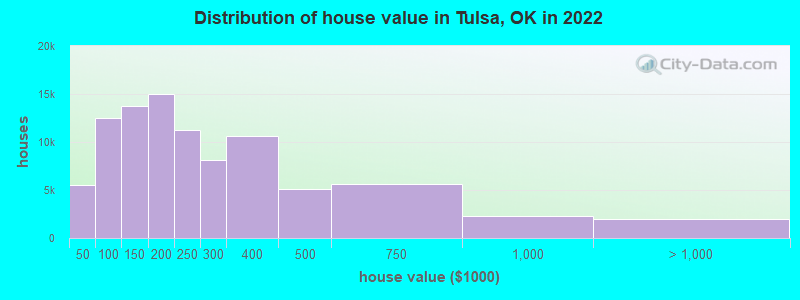
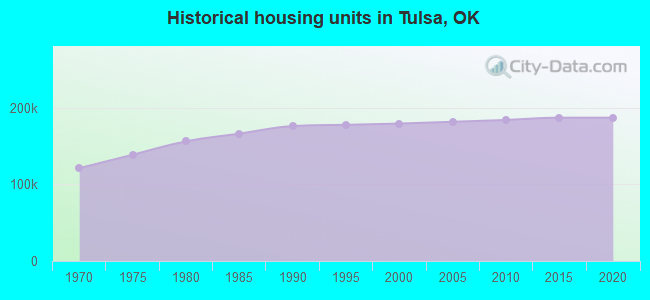
Estimated median house or condo value in 2022: $199,600 (it was $81,900 in 2000)
| Tulsa: | $199,600 |
| OK: | $191,700 |
Mean prices in 2022: all housing units: $277,293; detached houses: $287,211; townhouses or other attached units: $182,112; in 2-unit structures: $374,039; in 3-to-4-unit structures: $141,586; in 5-or-more-unit structures: $205,125; mobile homes: $58,926; occupied boats, rvs, vans, etc.: $133,193
Median gross rent in 2022: $971.
(13.3% for White Non-Hispanic residents, 32.7% for Black residents, 25.3% for Hispanic or Latino residents, 26.0% for American Indian residents, 37.6% for Native Hawaiian and other Pacific Islander residents, 26.2% for other race residents, 24.1% for two or more races residents)
Detailed information about poverty and poor residents in Tulsa, OK


Compare current foreclosures in Tulsa, OK:
| Photo | Address | Area | Beds / Baths | Price | Details |
|---|---|---|---|---|---|

|
#1
S. 80th East Ave 27d
Tulsa, OK 74133
|
1,030 sq. feet
|
2 baths 1 beds |
$46,500
|
show details |

|
#2
139th E Ave
Tulsa, OK 74134
|
1,708 sq. feet
|
2 baths 3 beds |
show details | |

|
#3
N Evanston Ave
Tulsa, OK 74110
|
- sq. feet
|
- baths - beds |
$29,900
|
show details |

|
#4
E Archer St
Tulsa, OK 74115
|
- sq. feet
|
- baths - beds |
$26,900
|
show details |

|
#5
S Oxford Ave
Tulsa, OK 74137
|
2,862 sq. feet
|
2 baths 4 beds |
show details | |

|
#6
S 27th West Ave
Tulsa, OK 74107
|
1,202 sq. feet
|
1 baths 3 beds |
show details | |

|
#7
S Louisville Ave
Tulsa, OK 74135
|
939 sq. feet
|
1 baths 2 beds |
show details | |

|
#8
E Newton St
Tulsa, OK 74115
|
1,308 sq. feet
|
1 baths 3 beds |
show details | |

|
#9
E 68th St # A2-120
Tulsa, OK 74136
|
1,402 sq. feet
|
2 baths 3 beds |
show details | |

|
#10
N Frankfort Pl
Tulsa, OK 74126
|
1,348 sq. feet
|
1 baths 2 beds |
show details |
| Photo | Address | Area | Beds / Baths | Price | Details |
|---|---|---|---|---|---|

|
#11
S 142nd East Ave
Tulsa, OK 74108
|
1,583 sq. feet
|
2 baths 3 beds |
show details | |

|
#12
E 30th Pl
Tulsa, OK 74114
|
1,540 sq. feet
|
1 baths 3 beds |
show details | |

|
#13
S Norwood Ave
Tulsa, OK 74112
|
2,010 sq. feet
|
2 baths 3 beds |
show details | |

|
#14
W Easton St
Tulsa, OK 74127
|
1,395 sq. feet
|
2 baths 4 beds |
show details | |

|
#15
S Granite Ave
Tulsa, OK 74136
|
2,412 sq. feet
|
2 baths 3 beds |
show details | |

|
#16
E 3rd St
Tulsa, OK 74128
|
1,056 sq. feet
|
1 baths 3 beds |
show details | |

|
#17
119th E Ave
Tulsa, OK 74129
|
999 sq. feet
|
1 baths 3 beds |
show details | |

|
#18
73rd East Ave
Tulsa, OK 74133
|
2,886 sq. feet
|
3 baths 4 beds |
show details | |

|
#19
S 111th East Ave
Tulsa, OK 74133
|
1,963 sq. feet
|
2 baths 3 beds |
show details | |

|
#20
S 107th East Ave
Tulsa, OK 74128
|
1,022 sq. feet
|
1 baths 2 beds |
show details |
| Photo | Address | Area | Beds / Baths | Price | Details |
|---|---|---|---|---|---|

|
#21
S 45th West Ave
Tulsa, OK 74127
|
1,176 sq. feet
|
1 baths 3 beds |
show details | |

|
#22
E Zion St
Tulsa, OK 74106
|
1,247 sq. feet
|
1 baths 4 beds |
show details | |

|
#23
W Independence Pl
Tulsa, OK 74127
|
2,020 sq. feet
|
2 baths 3 beds |
show details | |

|
#24
E 24th Pl
Tulsa, OK 74114
|
1,036 sq. feet
|
1 baths 2 beds |
show details | |

|
#25
N 158th East Ave
Tulsa, OK 74116
|
1,656 sq. feet
|
2 baths 3 beds |
show details | |

|
#26
W Xyler St
Tulsa, OK 74127
|
1,947 sq. feet
|
2 baths 4 beds |
show details | |

|
#27
E 26th Pl N
Tulsa, OK 74110
|
952 sq. feet
|
1 baths - beds |
show details | |

|
#28
W Virgin St
Tulsa, OK 74127
|
2,190 sq. feet
|
2 baths 4 beds |
show details | |

|
#29
S 119th East Ave
Tulsa, OK 74129
|
999 sq. feet
|
1 baths - beds |
show details | |

|
#30
W Oklahoma Pl
Tulsa, OK 74127
|
1,595 sq. feet
|
2 baths 3 beds |
show details |
| Photo | Address | Area | Beds / Baths | Price | Details |
|---|---|---|---|---|---|

|
#31
E 103rd St
Tulsa, OK 74133
|
3,579 sq. feet
|
3 baths 4 beds |
show details | |

|
#32
S 93rd East Ave
Tulsa, OK 74145
|
1,240 sq. feet
|
1 baths - beds |
show details | |

|
#33
N Union Pl
Tulsa, OK 74127
|
1,477 sq. feet
|
2 baths 3 beds |
show details | |

|
#34
S Allegheny Ave
Tulsa, OK 74137
|
3,330 sq. feet
|
3 baths - beds |
show details | |

|
#35
W Haskell Pl
Tulsa, OK 74127
|
1,368 sq. feet
|
1 baths 2 beds |
show details | |

|
#36
W 49th Pl
Tulsa, OK 74107
|
1,032 sq. feet
|
1 baths - beds |
show details | |

|
#37
S 104th East Ave
Tulsa, OK 74128
|
1,556 sq. feet
|
1 baths - beds |
show details | |

|
#38
N Utica Pl
Tulsa, OK 74130
|
1,780 sq. feet
|
1 baths - beds |
show details | |

|
#39
N Hartford Ave
Tulsa, OK 74126
|
1,073 sq. feet
|
1 baths - beds |
show details | |

|
#40
S Richmond Ave
Tulsa, OK 74114
|
1,356 sq. feet
|
1 baths - beds |
show details |
| Photo | Address | Area | Beds / Baths | Price | Details |
|---|---|---|---|---|---|

|
#41
S 68th East Ave
Tulsa, OK 74133
|
1,808 sq. feet
|
3 baths - beds |
show details | |

|
#42
E 49th St
Tulsa, OK 74105
|
3,336 sq. feet
|
2 baths - beds |
show details | |

|
#43
N Madison Pl
Tulsa, OK 74106
|
1,412 sq. feet
|
2 baths - beds |
show details | |

|
#44
E 28th St
Tulsa, OK 74129
|
1,122 sq. feet
|
1 baths - beds |
show details | |

|
#45
S Canton Ave
Tulsa, OK 74112
|
1,230 sq. feet
|
1 baths - beds |
show details | |

|
#46
E 10th St
Tulsa, OK 74120
|
1,168 sq. feet
|
2 baths - beds |
show details | |

|
#47
E 5th Pl
Tulsa, OK 74112
|
948 sq. feet
|
1 baths - beds |
show details | |

|
#48
E 25th Pl
Tulsa, OK 74129
|
1,117 sq. feet
|
2 baths - beds |
show details | |

|
#49
E 64th St
Tulsa, OK 74136
|
1,352 sq. feet
|
1 baths - beds |
show details | |

|
Check over 1 million property listings on Foreclosure.com!
|
browse all offers | |||


- 212,11751.3%White alone
- 75,06218.2%Hispanic
- 59,78914.5%Black alone
- 35,5628.6%Two or more races
- 15,0893.7%American Indian alone
- 13,0103.1%Asian alone
- 1,5260.4%Other race alone
- 9870.2%Native Hawaiian and Other
Pacific Islander alone
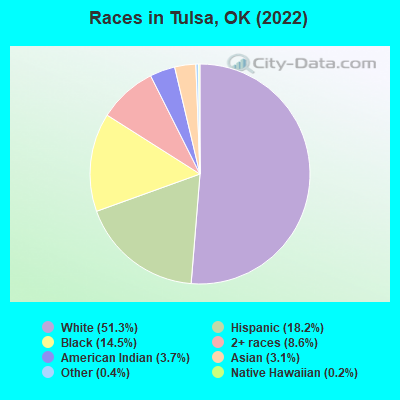
Races in Tulsa detailed stats: ancestries, foreign born residents, place of birth
According to our research of Oklahoma and other state lists, there were 460 registered sex offenders living in Tulsa, Oklahoma as of April 27, 2024.
The ratio of all residents to sex offenders in Tulsa is 877 to 1.
The ratio of registered sex offenders to all residents in this city is lower than the state average.
The City-Data.com crime index weighs serious crimes and violent crimes more heavily. Higher means more crime, U.S. average is 246.1. It adjusts for the number of visitors and daily workers commuting into cities.
- means the value is bigger than the state average.- means the value is much bigger than the state average.
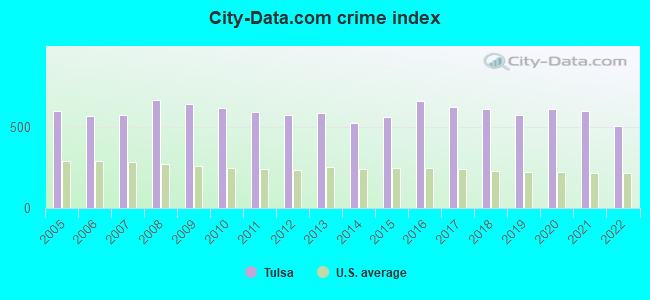
Crime rate in Tulsa detailed stats: murders, rapes, robberies, assaults, burglaries, thefts, arson
Full-time law enforcement employees in 2021, including police officers: 1,008 (801 officers - 685 male; 116 female).
| Officers per 1,000 residents here: | 1.98 |
| Oklahoma average: | 2.27 |
 Recent articles from our blog. Our writers, many of them Ph.D. graduates or candidates, create easy-to-read articles on a wide variety of topics.

 | Tulsa Oklahoma Entertainment Calendar (452 replies) |
| Considering Move to Tulsa area or NWA - Pro's & Con's of Tulsa? (16 replies) |
| How churchy/southern is Tulsa? (53 replies) |
| Tell me something good about Tulsa (7 replies) |
| US 412 from Tulsa to NM (3 replies) |
| Various Tulsa Area Photos (337 replies) |
Latest news from Tulsa, OK collected exclusively by city-data.com from local newspapers, TV, and radio stations
Ancestries: American (9.2%), English (6.7%), German (5.4%), Irish (4.6%), European (2.8%), Scottish (1.1%).
Current Local Time: CST time zone
Incorporated on 01/18/1898
Elevation: 740 feet
Land area: 182.6 square miles.
Population density: 2,255 people per square mile (low).
45,778 residents are foreign born (6.9% Latin America, 2.6% Asia).
| This city: | 11.0% |
| Oklahoma: | 6.1% |
Median real estate property taxes paid for housing units with mortgages in 2022: $2,174 (1.0%)
Median real estate property taxes paid for housing units with no mortgage in 2022: $1,541 (0.9%)
Nearest city with pop. 1,000,000+: Dallas, TX  (235.5 miles , pop. 1,188,580).
Nearest cities:
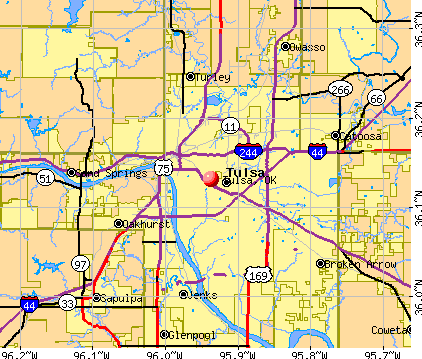
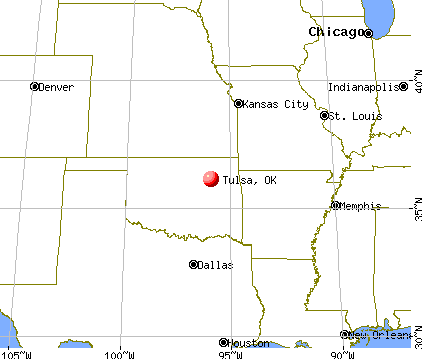
), ), ), )Latitude: 36.13 N, Longitude: 95.94 W
Daytime population change due to commuting: +84,609 (+20.5%)
Workers who live and work in this city: 156,596 (79.5%)
Area code: 918
Property values in Tulsa, OK
Detailed articles:
Tulsa tourist attractions:
- Ambassador Hotel - Tulsa OK - Ambassador Hotel Best
- Crown Plaza Hotel - Tulsa OK - Crown Plaza Hotel luxury accommodations
- Discoveryland - Tulsa OK - Discoveryland western musical theater
- Doubletree Hotel Tulsa Downtown - Tulsa OK - Doubletree Hotel travel
- Doubletree Hotel Tulsa Warren Place - Tulsa OK Doubletree Hotel Warren Place
- Renaissance Tulsa Hotel and Convention Center - Tulsa OK Renaissance Hotel
- Tulsa International Airport - Tulsa, OK - Public airport
- Tulsa Zoo and Living Museum - Tulsa, Oklahoma - city zoo with 1,500 animals on 78 Acres
- Tulsa Marriott Southern Hills - Tulsa OK - Marriott Hotel
Tulsa, Oklahoma accommodation & food services, waste management - Economy and Business Data
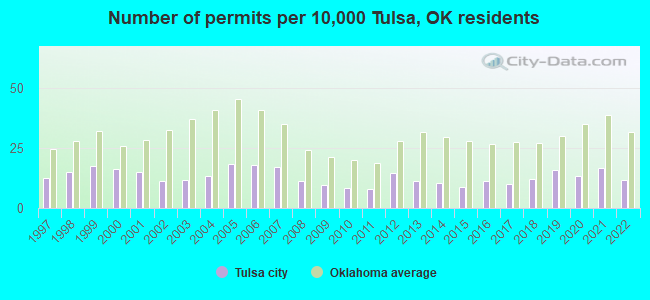
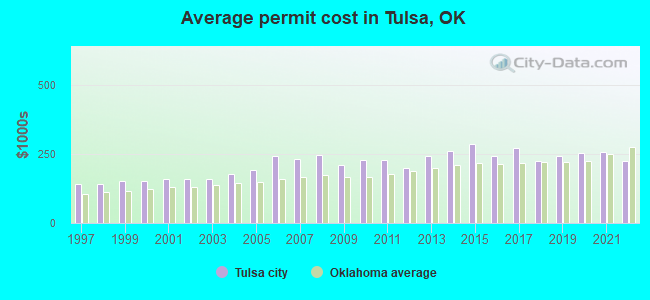
Single-family new house construction building permits:
- 2022: 452 buildings, average cost: $222,900
- 2021: 652 buildings, average cost: $254,500
- 2020: 521 buildings, average cost: $251,000
- 2019: 629 buildings, average cost: $241,500
- 2018: 471 buildings, average cost: $223,400
- 2017: 389 buildings, average cost: $271,200
- 2016: 436 buildings, average cost: $241,200
- 2015: 344 buildings, average cost: $284,300
- 2014: 402 buildings, average cost: $261,200
- 2013: 436 buildings, average cost: $241,300
- 2012: 577 buildings, average cost: $198,400
- 2011: 319 buildings, average cost: $227,000
- 2010: 335 buildings, average cost: $227,600
- 2009: 372 buildings, average cost: $209,100
- 2008: 436 buildings, average cost: $245,300
- 2007: 667 buildings, average cost: $230,600
- 2006: 699 buildings, average cost: $241,600
- 2005: 717 buildings, average cost: $191,600
- 2004: 519 buildings, average cost: $176,700
- 2003: 461 buildings, average cost: $157,700
- 2002: 444 buildings, average cost: $158,500
- 2001: 590 buildings, average cost: $157,900
- 2000: 632 buildings, average cost: $152,300
- 1999: 685 buildings, average cost: $149,500
- 1998: 594 buildings, average cost: $140,300
- 1997: 488 buildings, average cost: $141,000
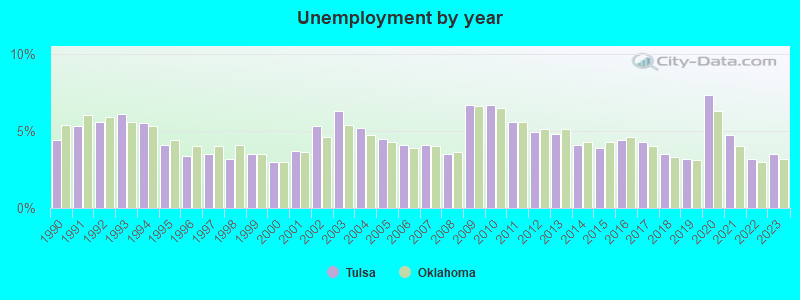
| Here: | 3.5% |
| Oklahoma: | 3.2% |
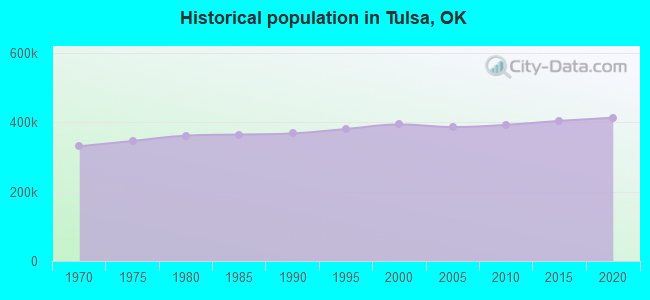
Population change in the 1990s: +24,729 (+6.7%).
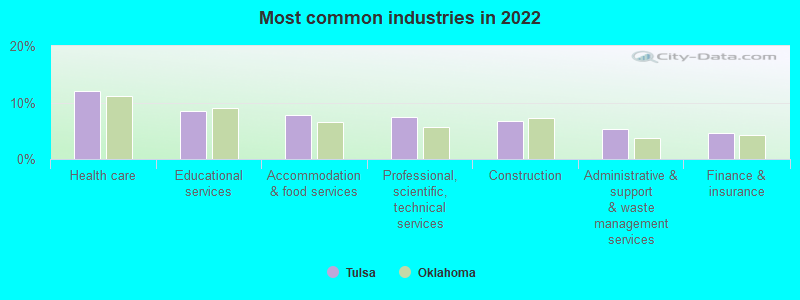
- Health care (12.0%)
- Educational services (8.5%)
- Accommodation & food services (7.8%)
- Professional, scientific, technical services (7.4%)
- Construction (6.6%)
- Administrative & support & waste management services (5.2%)
- Finance & insurance (4.5%)
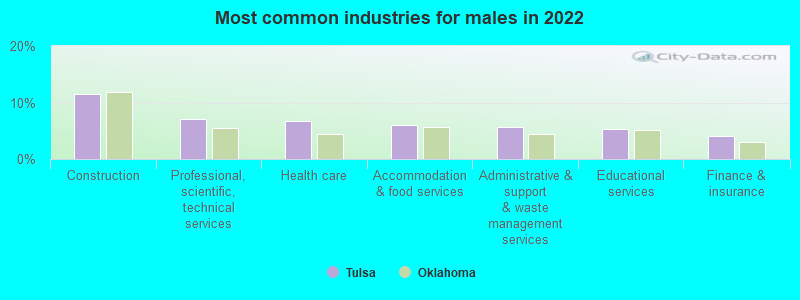
- Construction (11.6%)
- Professional, scientific, technical services (7.2%)
- Health care (6.7%)
- Accommodation & food services (6.1%)
- Administrative & support & waste management services (5.7%)
- Educational services (5.3%)
- Finance & insurance (4.2%)
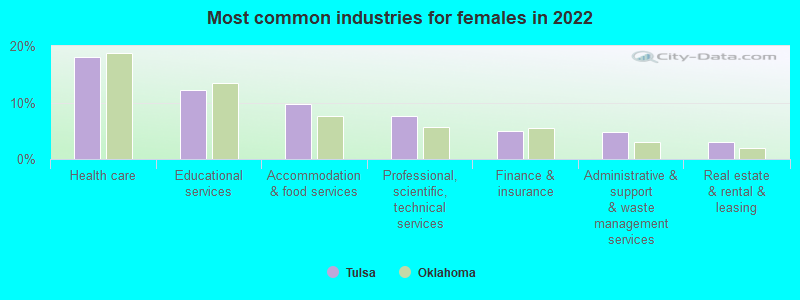
- Health care (18.0%)
- Educational services (12.2%)
- Accommodation & food services (9.8%)
- Professional, scientific, technical services (7.6%)
- Finance & insurance (4.9%)
- Administrative & support & waste management services (4.7%)
- Real estate & rental & leasing (3.1%)
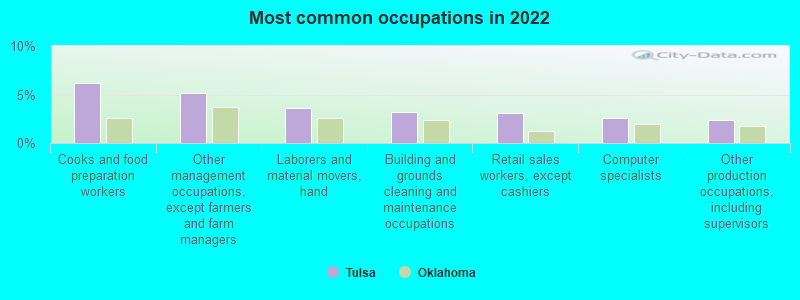
- Cooks and food preparation workers (6.2%)
- Other management occupations, except farmers and farm managers (5.1%)
- Laborers and material movers, hand (3.6%)
- Building and grounds cleaning and maintenance occupations (3.2%)
- Retail sales workers, except cashiers (3.0%)
- Computer specialists (2.6%)
- Other production occupations, including supervisors (2.4%)
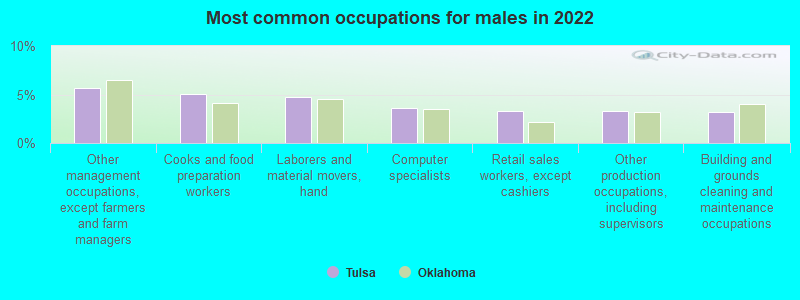
- Other management occupations, except farmers and farm managers (5.7%)
- Cooks and food preparation workers (5.0%)
- Laborers and material movers, hand (4.8%)
- Computer specialists (3.7%)
- Retail sales workers, except cashiers (3.3%)
- Other production occupations, including supervisors (3.3%)
- Building and grounds cleaning and maintenance occupations (3.2%)
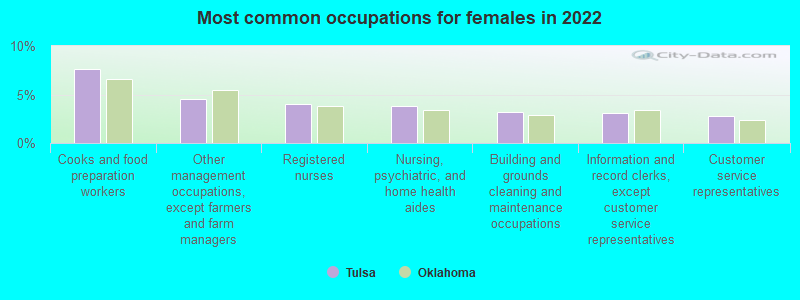
- Cooks and food preparation workers (7.6%)
- Other management occupations, except farmers and farm managers (4.5%)
- Registered nurses (4.0%)
- Nursing, psychiatric, and home health aides (3.8%)
- Building and grounds cleaning and maintenance occupations (3.2%)
- Information and record clerks, except customer service representatives (3.1%)
- Customer service representatives (2.7%)
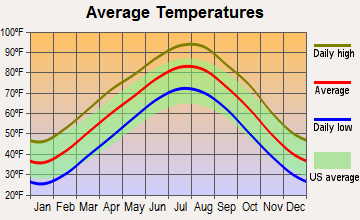
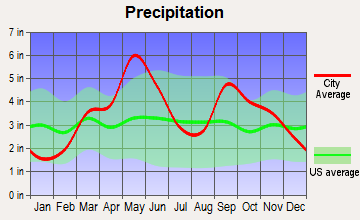
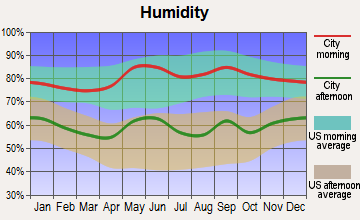
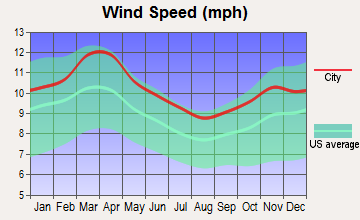
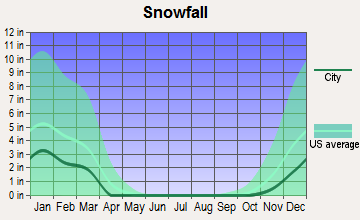
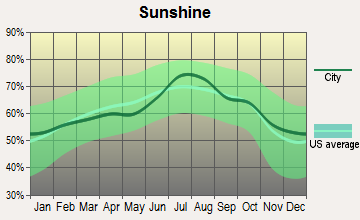
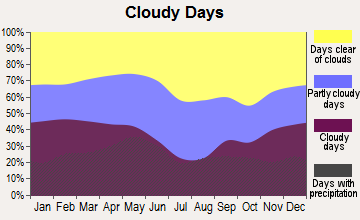
Average climate in Tulsa, Oklahoma
Based on data reported by over 4,000 weather stations
|
|

(lower is better)
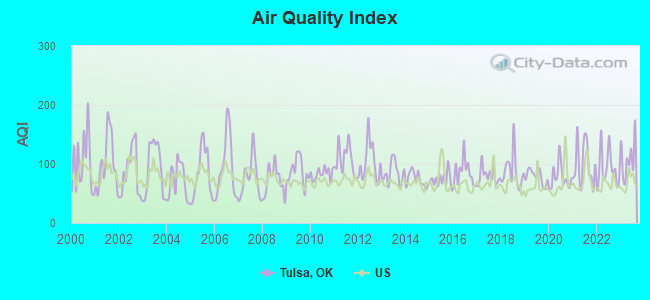
Air Quality Index (AQI) level in 2023 was 110. This is significantly worse than average.
| City: | 110 |
| U.S.: | 73 |
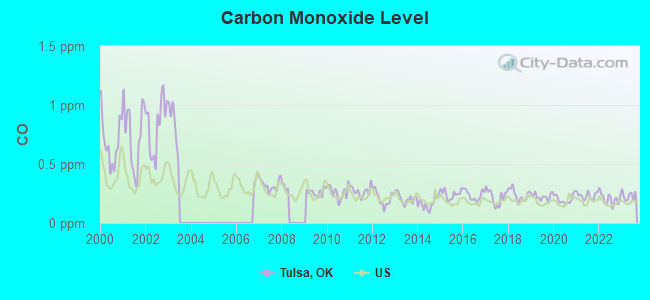
Carbon Monoxide (CO) [ppm] level in 2023 was 0.231. This is about average. Closest monitor was 2.5 miles away from the city center.
| City: | 0.231 |
| U.S.: | 0.251 |
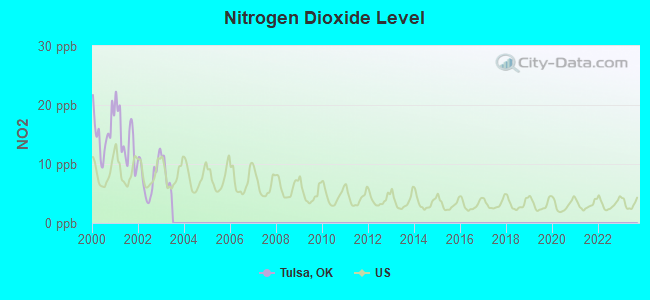
Nitrogen Dioxide (NO2) [ppb] level in 2002 was 7.79. This is significantly worse than average. Closest monitor was 0.8 miles away from the city center.
| City: | 7.79 |
| U.S.: | 5.11 |
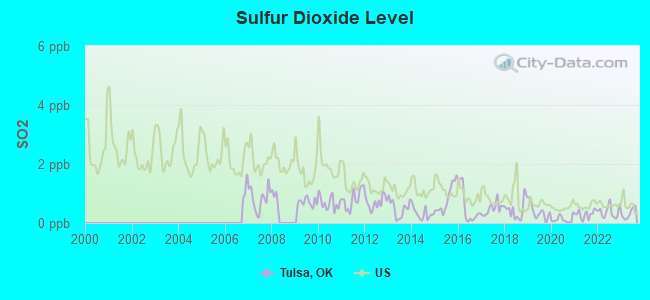
Sulfur Dioxide (SO2) [ppb] level in 2023 was 0.320. This is significantly better than average. Closest monitor was 0.8 miles away from the city center.
| City: | 0.320 |
| U.S.: | 1.515 |
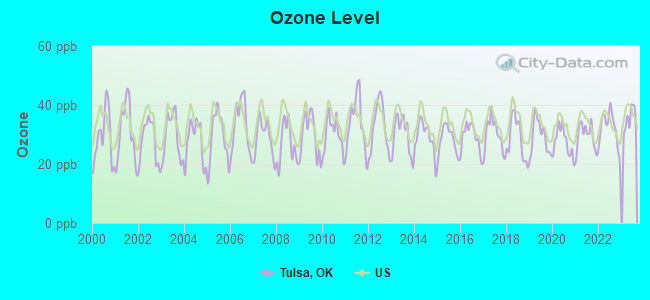
Ozone [ppb] level in 2023 was 35.5. This is about average. Closest monitor was 1.0 miles away from the city center.
| City: | 35.5 |
| U.S.: | 33.3 |
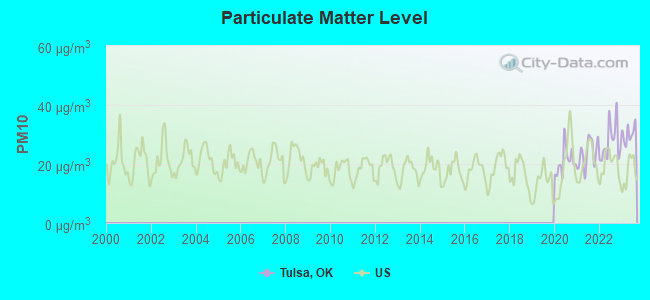
Particulate Matter (PM10) [µg/m3] level in 2023 was 30.2. This is significantly worse than average. Closest monitor was 0.9 miles away from the city center.
| City: | 30.2 |
| U.S.: | 19.2 |
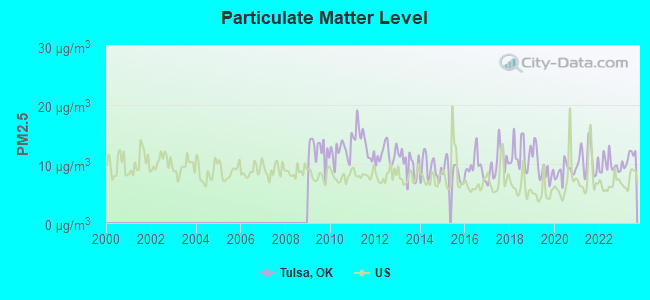
Particulate Matter (PM2.5) [µg/m3] level in 2023 was 11.0. This is worse than average. Closest monitor was 0.9 miles away from the city center.
| City: | 11.0 |
| U.S.: | 8.1 |
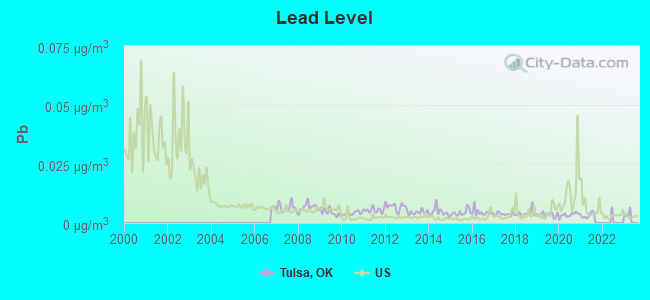
Lead (Pb) [µg/m3] level in 2021 was 0.00329. This is significantly better than average. Closest monitor was 0.8 miles away from the city center.
| City: | 0.00329 |
| U.S.: | 0.00931 |
Tornado activity:
Tulsa-area historical tornado activity is near Oklahoma state average. It is 178% greater than the overall U.S. average.
On 5/5/1960, a category F5 (max. wind speeds 261-318 mph) tornado 9.3 miles away from the Tulsa city center killed 5 people and injured 81 people and caused between $500,000 and $5,000,000 in damages.
On 4/24/1993, a category F4 (max. wind speeds 207-260 mph) tornado 6.1 miles away from the city center killed 7 people and injured 100 people and caused between $5,000,000 and $50,000,000 in damages.
Earthquake activity:
Tulsa-area historical earthquake activity is significantly above Oklahoma state average. It is 802% greater than the overall U.S. average.On 9/3/2016 at 12:02:44, a magnitude 5.8 (5.8 MW, Depth: 3.5 mi, Class: Moderate, Intensity: VI - VII) earthquake occurred 58.9 miles away from Tulsa center
On 11/6/2011 at 03:53:10, a magnitude 5.7 (5.7 MW, Depth: 3.2 mi) earthquake occurred 62.2 miles away from the city center
On 11/7/2016 at 01:44:24, a magnitude 5.0 (5.0 MW, Depth: 2.8 mi) earthquake occurred 49.4 miles away from the city center
On 11/5/2011 at 07:12:45, a magnitude 4.8 (4.8 MW, Depth: 1.9 mi, Class: Light, Intensity: IV - V) earthquake occurred 61.4 miles away from Tulsa center
On 11/8/2011 at 02:46:57, a magnitude 4.8 (4.8 MW, Depth: 3.1 mi) earthquake occurred 63.2 miles away from the city center
On 2/13/2016 at 17:07:06, a magnitude 5.1 (5.1 MW, Depth: 5.2 mi) earthquake occurred 156.5 miles away from Tulsa center
Magnitude types: moment magnitude (MW)
Natural disasters:
The number of natural disasters in Tulsa County (34) is a lot greater than the US average (15).Major Disasters (Presidential) Declared: 22
Emergencies Declared: 7
Causes of natural disasters: Storms: 15, Floods: 14, Winter Storms: 9, Tornadoes: 8, Fires: 5, Heavy Rains: 2, Winds: 2, Hurricane: 1, Ice Storm: 1, Snow: 1, Snowstorm: 1, Other: 1 (Note: some incidents may be assigned to more than one category).
Main business address for: GEODYNE INSTITUTIONAL PENSION ENERGY INC LTD PARTNERSHIP P-7 (CRUDE PETROLEUM & NATURAL GAS), WILLIAMS COMPANIES INC (NATURAL GAS TRANSMISSION), GEODYNE INSTITUTIONAL PENSION ENERGY INCOME LTD PART P-6 (CRUDE PETROLEUM & NATURAL GAS), MAGELLAN MIDSTREAM PARTNERS LP (PIPE LINES (NO NATURAL GAS)), GEODYNE INSTITUTIONAL PENSION ENERGY INC LTD PARTNERSHIP P-8 (CRUDE PETROLEUM & NATURAL GAS), AAON INC (AIR COND & WARM AIR HEATING EQUIP & COMM & INDL REFRIG EQUIP), GEODYNE ENERGY INCOME LTD PARTNERSHIP II A (CRUDE PETROLEUM & NATURAL GAS), UNIT CORP (CRUDE PETROLEUM & NATURAL GAS) and 19 other public companies.
Hospitals in Tulsa:
- ALLCARE HOSPICE, INC (4500 SOUTH GARNETT, SUITE 1000)
- BROOKHAVEN HOSPITAL, INC (201 SOUTH GARNETT ROAD)
- CROSSROADS HOSPICE OF OKLAHOMA, L L C (9916-A EAST 43RD STREET)
- GATESWAY RESIDENTIAL ALTERNATIVES, INC #2 (7208 S ERIE STREET)
- HILLCREST MEDICAL CENTER (Proprietary, provides emergency services, 1120 SOUTH UTICA AVENUE)
- LAUREATE PSYCHIATRIC CLINIC AND HOSPITAL (provides emergency services, "6655 SOUTH YALE AVE, BOX 470207")
- OSTEOPATHIC SURGICENTER (744 W 7TH ST)
- SAINT FRANCIS HOSPITAL SOUTH (Proprietary, 10501 EAST 91ST STREET SOUTH)
- SOJOURN CARE TULSA (9910 E 42ND STREET SOUTH, SUITE 101)
- ST JOHN MEDICAL CENTER, INC (Voluntary non-profit - Church, 1923 SOUTH UTICA AVENUE)
Airports and heliports located in Tulsa:
- Richard Lloyd Jones Jr Airport (RVS) (Runways: 3, Commercial Ops: 36, Air Taxi Ops: 2,998, Itinerant Ops: 69,523, Local Ops: 115,222, Military Ops: 245)
- Tulsa International Airport (TUL) (Runways: 3, Commercial Ops: 27,772, Air Taxi Ops: 23,767, Itinerant Ops: 23,721, Local Ops: 2,913, Military Ops: 16,817)
- Harvey Young Airport (1H6) (Runways: 2, Itinerant Ops: 500, Local Ops: 1,000)
- Heliports: 10
Biggest Colleges/Universities in Tulsa:
- Tulsa Community College (Full-time enrollment: 12,480; Location: 6111 E Skelly Dr; Public; Website: www.tulsacc.edu)
- University of Tulsa (Full-time enrollment: 3,702; Location: 800 South Tucker Drive; Private, not-for-profit; Website: www.utulsa.edu; Offers Doctor's degree)
- Oral Roberts University (Full-time enrollment: 3,216; Location: 7777 S Lewis Ave.; Private, not-for-profit; Website: oru.edu; Offers Doctor's degree)
- Spartan College of Aeronautics and Technology (Full-time enrollment: 1,208; Location: 8820 E Pine St; Private, for-profit; Website: www.spartan.edu)
- Tulsa Welding School-Tulsa (Full-time enrollment: 1,019; Location: 2545 E. 11th Street; Private, for-profit; Website: www.weldingschool.com)
- Tulsa Technology Center-Lemley Campus (Full-time enrollment: 969; Location: 3420 S Memorial Drive; Public; Website: www.tulsatech.edu)
- Community Care College (Full-time enrollment: 754; Location: 4242 South Sheridan; Private, for-profit; Website: www.communitycarecollege.edu)
- Platt College-Tulsa (Full-time enrollment: 727; Location: 3801 S Sheridan; Private, for-profit; Website: www.plattcolleges.edu)
- Brown Mackie College-Tulsa (Full-time enrollment: 575; Location: 4608 S Garnett Rd Ste 110; Private, for-profit; Website: www.brownmackie.edu)
- ITT Technical Institute-Tulsa (Full-time enrollment: 536; Location: 4500 S. 129th East Avenue, Suite 152; Private, for-profit; Website: www.itt-tech.edu)
- Tulsa Technology Center-Riverside Campus (Full-time enrollment: 439; Location: 801 East 91st; Public; Website: www.tulsatech.edu)
- University of Phoenix-Tulsa Campus (Full-time enrollment: 396; Location: 14002 East 21st St.; Private, for-profit; Website: www.phoenix.edu; Offers Master's degree)
- Tulsa Technology Center-Peoria Campus (Full-time enrollment: 365; Location: 3850 N Peoria; Public; Website: www.tulsatech.edu)
- Clary Sage College (Full-time enrollment: 350; Location: 3131 South Sheridan; Private, for-profit; Website: www.clarysagecollege.com)
- Vatterott College-Tulsa (Full-time enrollment: 267; Location: 4343 S. 118th E. Ave, Suite A; Private, for-profit; Website: www.vatterott.edu)
- Career Point College (Full-time enrollment: 226; Location: 3138 S Garnett; Private, for-profit; Website: www.careerpointtulsa.com)
- National American University-Tulsa (Full-time enrollment: 199; Location: 8040 South Sheridan Road; Private, for-profit; Website: www.national.edu/locations/oklahoma/tulsa)
- Oklahoma Technical College (Full-time enrollment: 194; Location: 4444 South Sheridan; Private, for-profit; Website: www.oklahomatechnicalcollege.com/)
- Broken Arrow Beauty College-Tulsa (Full-time enrollment: 122; Location: 11122 E 71st St; Private, for-profit; Website: www.babeautycollege.com)
- Virginia College-Tulsa (Full-time enrollment: 86; Location: 5124 South Peoria Avenue; Private, for-profit; Website: www.vc.edu/college/tulsa-oklahoma-colleges.cfm)
Other colleges/universities with over 2000 students near Tulsa:
- Rogers State University (about 22 miles; Claremore, OK; Full-time enrollment: 3,482)
- Oklahoma State University Institute of Technology (about 35 miles; Okmulgee, OK; FT enrollment: 3,243)
- Northeastern State University (about 57 miles; Tahlequah, OK; FT enrollment: 6,895)
- Oklahoma State University-Main Campus (about 64 miles; Stillwater, OK; FT enrollment: 21,700)
- Langston University (about 76 miles; Langston, OK; FT enrollment: 2,075)
- John Brown University (about 78 miles; Siloam Springs, AR; FT enrollment: 2,097)
- Northeastern Oklahoma A&M College (about 79 miles; Miami, OK; FT enrollment: 2,075)
Biggest public high schools in Tulsa:
- UNION HS (Students: 2,043, Location: 6636 SOUTH MINGO ROAD, Grades: 10-12)
- EAST CENTRAL HS (Students: 1,304, Location: 12150 EAST 11TH STREET, Grades: 9-12)
- THOMAS EDISON PREPARATORY HS (Students: 1,284, Location: 2906 EAST 41ST STREET, Grades: 9-12)
- BOOKER T. WASHINGTON HS (Students: 1,263, Location: 1514 EAST ZION STREET, Grades: 9-12)
- WILL ROGERS COLLEGE HS (Students: 1,084, Location: 3909 EAST FIFTH PLACE, Grades: 9-12)
- NATHAN HALE HS (Students: 813, Location: 6960 EAST 21ST STREET, Grades: 9-12)
- CENTRAL HS (Students: 701, Location: 3101 WEST EDISON STREET, Grades: 9-12)
- MCLAIN HS FOR SCIENCE AND TECH (Students: 596, Location: 4929 NORTH PEORIA AVENUE, Grades: 9-12)
- DANIEL WEBSTER HS (Students: 517, Location: 1919 WEST 40TH STREET, Grades: 9-12)
- DOVE SCIENCE ACADEMY (TULSA) (Students: 397, Location: 280 SOUTH MEMORIAL DRIVE, Grades: 6-12, Charter school)
Biggest private high schools in Tulsa:
- VICTORY CHRISTIAN SCHOOL (Students: 1,069, Location: 7700 S LEWIS AVE, Grades: PK-12)
- METRO CHRISTIAN ACADEMY (Students: 1,004, Location: 6363 S TRENTON AVE, Grades: KG-12)
- HOLLAND HALL (Students: 954, Location: 5666 E 81ST ST, Grades: PK-12)
- LINCOLN CHRISTIAN SCHOOL (Students: 849, Location: 1003 N 129TH EAST AVE, Grades: PK-12)
- BISHOP KELLEY HIGH SCHOOL (Students: 819, Location: 3905 S HUDSON AVE, Grades: 9-12)
- CASCIA HALL PREPARATORY SCHOOL (Students: 568, Location: 2520 S YORKTOWN AVE, Grades: 6-12)
- RIVERFIELD COUNTRY DAY SCHOOL (Students: 551, Location: 2433 W 61ST ST, Grades: PK-12)
- REGENT PREPARATORY SCHOOL-OK (Students: 410, Location: 8621 S MEMORIAL DR, Grades: PK-12)
- MINGO VALLEY CHRISTIAN SCHOOL (Students: 296, Location: 8720 E 61ST ST, Grades: PK-12)
- WRIGHT CHRISTIAN ACADEMY (Students: 214, Location: 11391 E ADMIRAL PL, Grades: KG-12)
Biggest public elementary/middle schools in Tulsa:
- UNION 6TH-7TH GRADE CTR (Students: 2,131, Location: 10100 EAST 61ST STREET, Grades: 6-7)
- MEMORIAL JHS (Students: 1,328, Location: 7502 EAST 57TH STREET, Grades: 7-8)
- EISENHOWER INTERNATIONAL ES (Students: 1,244, Location: 3111 EAST 56 STREET, Grades: PK-5)
- EDISON PREPARATORY MS (Students: 949, Location: 2906 EAST 41ST STREET, Grades: 6-8)
- KENDALL-WHITTIER ES (Students: 925, Location: 2601 EAST 5TH PLACE, Grades: PK-6)
- DISNEY ES (Students: 822, Location: 11702 EAST 25TH STREET, Grades: KG-6)
- CLARK ES (Students: 776, Location: 3656 S 103RD EAST AVENUE, Grades: PK-5)
- COOPER ES (Students: 702, Location: 1808 SOUTH 123RD EAST AVENUE, Grades: PK-6)
- CARVER MS (Students: 664, Location: 624 EAST OKLAHOMA PLACE, Grades: 6-8)
- BERRYHILL ES SOUTH (Students: 639, Location: 3128 SOUTH 63RD WEST AVENUE, Grades: PK-6)
Biggest private elementary/middle schools in Tulsa:
- MONTE CASSINO SCHOOL (Students: 882, Location: 2206 S LEWIS AVE, Grades: PK-8)
- MARQUETTE CATHOLIC SCHOOL (Students: 506, Location: 1519 S QUINCY AVE, Grades: PK-8)
- ST PIUS X SCHOOL (Students: 372, Location: 1717 S 75TH EAST AVE, Grades: PK-8)
- SCHOOL OF ST MARY (Students: 335, Location: 1365 E 49TH PL, Grades: PK-8)
- MISS HELEN'S PRIVATE SCHOOL (Students: 255, Location: 4849 S MINGO RD, Grades: PK-5)
- UNIVERSITY SCHOOL (Students: 216, Location: 326 S COLLEGE, Grades: PK-8)
- STS PETER & PAUL CATHOLIC SCHOOL (Students: 214, Location: 1428 N 67TH EAST AVE, Grades: PK-8)
- HOLY FAMILY CATHEDRAL SCHOOL (Students: 141, Location: 820 S BOULDER AVE, Grades: PK-8)
- SOUTHPARK CHRISTIAN SCHOOL (Students: 113, Location: 10811 E 41ST ST, Grades: PK-8)
- ST CATHERINE SCHOOL (Students: 110, Location: 2515 W 46TH ST, Grades: PK-8)
User-submitted facts and corrections:
- You should add the Spartan School of Aeronautics to your list of Tulsa colleges and universities.
- Eastwood Baptist School Systems no longer exists. The school closed due to funding issues.
- Tulsa Newspaper: Greater Tulsa Reporter Newspapers, Oklahoma's Largest Monthly News Group include: Union Boundary, Jenks Gazette, Tulsa Free Press, Broken Arrow Express, Bixby Breeze, and Owasso Rambler
- Martha O'Driscoll, actress, born 3/4/22 in Tulsa. Martha was in over in over 40 movies including starring as Daisy Mae in Lil Abner.
- another very large University in downtown TULSA is: OSU - TULSA 700 North Greenwood Avenue Tulsa, OK 74106
Points of interest:
Notable locations in Tulsa: Osage School (A), Admiral Drive-In (B), Tulsa State Fairground (C), Sequoyah Yacht Club (D), Southern Hills Country Club (E), Tulsa Country Club (F), Woodland Country Club (G), Albertsons Office Depot (H), Briarglen Square (I), Brook Plaza (J), Centre 71 (K), Centre 71 Annex (L), The Consortium (M), Country Club Plaza (N), Eastern Village (O), Eastland Plaza (P), Festival Square (Q), Garnett Plaza (R), Gilcrease Hills (S), Greenway Village (T). Display/hide their locations on the map
Shopping Centers: Square 1 Shopping Center (1), Abdo Shopping Center (2), Admiral Place Shopping Center (3), Airway Shopping Center (4), Alameda Shopping Center (5), Allstate Shopping Center (6), Bellaire Village Shopping Center (7), Bownan Acres Shopping Center (8), Briar Village Shopping Center (9). Display/hide their locations on the map
Main business address in Tulsa include: GEODYNE INSTITUTIONAL PENSION ENERGY INC LTD PARTNERSHIP P-7 (A), WILLIAMS COMPANIES INC (B), GEODYNE INSTITUTIONAL PENSION ENERGY INCOME LTD PART P-6 (C), MAGELLAN MIDSTREAM PARTNERS LP (D), GEODYNE INSTITUTIONAL PENSION ENERGY INC LTD PARTNERSHIP P-8 (E), GEODYNE ENERGY INCOME LTD PARTNERSHIP II A (F), UNIT CORP (G). Display/hide their locations on the map
Churches in Tulsa include: Fellowship Lutheran Church (A), Fellowship Congregational Church (B), Fellowship Church-God Pentecostal (C), Fellowship Bible Church-Tulsa (D), Family Worship Center (E), Family of Faith Metropolitan Church (F), Family Life Ministries Church (G), Family History Center (H), Faith United Methodist Church (I). Display/hide their locations on the map
Cemeteries: Haikey Cemetery (1), Booker T Washington Cemetery (2), Rosencutter Cemetery (3), Perryman Cemetery (4), Harlow Cemetery (5), Grayson Cemetery (6), Community Cemetery (7). Display/hide their locations on the map
Lakes and reservoirs: Recreation Lake (A), Swan Lake (B), Oknoname 143018 Reservoir (C), Vettie Cooley Lake (D), Cooley Lake (E), Lake Yahola (F), Oknoname 143007 Reservoir (G), Theisen Lake (H). Display/hide their locations on the map
Creeks: Harlow Creek (A), Coal Creek (B), Cherry Creek (C), Crow Creek (D), Mooser Creek (E), Mill Creek (F), Fred Creek (G), Flat Rock Creek (H), Dirty Butter Creek (I). Display/hide their locations on the map
Parks in Tulsa include: Grotto Park (1), Woodward Park (2), Clinton Park (3), Zeigler Park (4), Boulder Park (5), Bowman Park (6), Braden Park (7), Skelly Park (8), Florence Park (9). Display/hide their locations on the map
Tourist attractions: International Linen Registry Foundation (Museums; Tulsa Promenade Shop) (1), Gilcrease Museum Shop (1400 North Gilcrease Museum Road) (2), Oklahoma Jazz Hall of Fame (Museums; 322 North Greenwood Avenue) (3), LA Villa Restaurant at Philbrook (Museums; 2727 South Rockford Road) (4), Geoscience Center (Museums; 8801 South Yale Avenue) (5), Greenwood Cultural Center (Museums; 322 North Greenwood Avenue) (6), Philbrook Museum of Art (Cultural Attractions- Events- & Facilities; 2727 South Rockford Road) (7), Tulsa Air and Space Museum (Cultural Attractions- Events- & Facilities; 7130 East Apache Street) (8), Education Today & Tomorrow (Cultural Attractions- Events- & Facilities; 9649 South Sandusky Avenue) (9). Display/hide their approximate locations on the map
Hotels: Concierge Services of Tulsa (12221 East Admiral Place) (1), Best Western Trade Winds East (3337 East Skelly Drive) (2), Days Inn South (8888 South Lewis Avenue) (3), Saratoga Motor Hotel (10117 East 11th Street) (4), Super 8 Suites (3211 South 79th East Avenue) (5), Comfort Suites (8338 E 61st St) (6), Tulsa Travelodge South (4717 S Yale Ave) (7), Microtel Inn & Suites (16518 East Admiral Place) (8), Crystal Motel (5510 West Skelly Drive) (9). Display/hide their approximate locations on the map
Courts: Federal Bureau Of Investigation (8023 East 63rd Suite 400) (1), Oklahoma State - Court Of Civil Appeals Div 2 & 4- Court Of Civil Appeals Dive 2 (440 South Houston Avenue Suite 401) (2), United States Government - Court Clerk- Voice Case Information System (224 South Boulder Avenue) (3), Tulsa County - Court Clerk- Small Claims (500 South Denver Avenue) (4), United States Government - Bankruptcy Court- Bankruptcy Office Of U S Trus (224 South Boulder Avenue Suite 225) (5), Coweta City - Court Clerk- Domestic (500 South Denver Avenue) (6), Tulsa County - Juvenile Bureau Of The District Court Administrativ- Tulsa County Juvenile Ce (315 South Gilcrease Museum Road) (7), Tulsa County - Court Clerk- Civil Division (500 South Denver Avenue) (8), Gilbert Thomas H DDS (7116 South Mingo Road Suite 112) (9). Display/hide their approximate locations on the map
Birthplace of: St. Vincent (musician) - Musician, Ryan Tedder - Singer-songwriter and record producer, Richard Roberts (evangelist) - Television evangelist, R. James Woolsey, Jr. - Directors of CIA, Cornel West - (fl. late 20th century), scholar & activist, Bill Goldberg - Professional wrestler, Bill Hader - Comedian, John Sullivan (Oklahoma) - Politician, Martin Gardner - (born 1914), writer on mathematics and games, Garth Brooks - (born 1962), country musician.
Drinking water stations with addresses in Tulsa and their reported violations in the past:
CARRIAGE VILLAGE (Address: 715 N. 96th East Pl. , Population served: 500, Purch surface water):Past monitoring violations:
- 4 routine major monitoring violations
| This city: | 2.3 people |
| Oklahoma: | 2.5 people |
| This city: | 58.1% |
| Whole state: | 66.8% |
| This city: | 6.8% |
| Whole state: | 5.9% |
Likely homosexual households (counted as self-reported same-sex unmarried-partner households)
- Lesbian couples: 0.5% of all households
- Gay men: 0.4% of all households
People in group quarters in Tulsa in 2010:
- 2,721 people in college/university student housing
- 2,033 people in nursing facilities/skilled-nursing facilities
- 1,595 people in local jails and other municipal confinement facilities
- 623 people in other noninstitutional facilities
- 366 people in correctional residential facilities
- 263 people in emergency and transitional shelters (with sleeping facilities) for people experiencing homelessness
- 219 people in workers' group living quarters and job corps centers
- 159 people in residential treatment centers for adults
- 117 people in group homes intended for adults
- 105 people in mental (psychiatric) hospitals and psychiatric units in other hospitals
- 88 people in state prisons
- 37 people in correctional facilities intended for juveniles
- 34 people in group homes for juveniles (non-correctional)
- 14 people in in-patient hospice facilities
- 12 people in residential treatment centers for juveniles (non-correctional)
People in group quarters in Tulsa in 2000:
- 3,663 people in college dormitories (includes college quarters off campus)
- 2,476 people in nursing homes
- 1,219 people in other noninstitutional group quarters
- 1,008 people in local jails and other confinement facilities (including police lockups)
- 496 people in hospitals or wards for drug/alcohol abuse
- 248 people in job corps and vocational training facilities
- 232 people in other nonhousehold living situations
- 207 people in halfway houses
- 172 people in wards in general hospitals for patients who have no usual home elsewhere
- 150 people in mental (psychiatric) hospitals or wards
- 131 people in homes or halfway houses for drug/alcohol abuse
- 84 people in homes for the mentally retarded
- 83 people in homes for the mentally ill
- 76 people in schools, hospitals, or wards for the intellectually disabled
- 51 people in short-term care, detention or diagnostic centers for delinquent children
- 45 people in hospitals/wards and hospices for chronically ill
- 34 people in religious group quarters
- 29 people in hospices or homes for chronically ill
- 21 people in residential treatment centers for emotionally disturbed children
- 20 people in unknown juvenile institutions
- 17 people in other group homes
- 16 people in other hospitals or wards for chronically ill
Banks with most branches in Tulsa (2011 data):
- BOKF, National Association: 31 branches. Info updated 2012/02/28: Bank assets: $25,360.0 mil, Deposits: $19,171.3 mil, local headquarters, positive income, Commercial Lending Specialization, 189 total offices, Holding Company: Bok Financial Corporation
- Arvest Bank: 18 branches. Info updated 2010/11/29: Bank assets: $12,520.8 mil, Deposits: $10,446.2 mil, headquarters in Fayetteville, AR, positive income, Commercial Lending Specialization, 241 total offices, Holding Company: Arvest Bank Group, Inc.
- Bank of America, National Association: 13 branches. Info updated 2009/11/18: Bank assets: $1,451,969.3 mil, Deposits: $1,077,176.8 mil, headquarters in Charlotte, NC, positive income, 5782 total offices, Holding Company: Bank Of America Corporation
- The F&M Bank & Trust Company: 8 branches. Info updated 2006/11/03: Bank assets: $2,013.0 mil, Deposits: $1,805.5 mil, local headquarters, negative income in the last year, Commercial Lending Specialization, 11 total offices, Holding Company: One Rich Hill Land Ltd. Partnership
- JPMorgan Chase Bank, National Association: 8 branches. Info updated 2011/11/10: Bank assets: $1,811,678.0 mil, Deposits: $1,190,738.0 mil, headquarters in Columbus, OH, positive income, International Specialization, 5577 total offices, Holding Company: Jpmorgan Chase & Co.
- International Bank of Commerce: 8 branches. Info updated 2007/03/28: Bank assets: $9,621.9 mil, Deposits: $6,548.8 mil, headquarters in Laredo, TX, positive income, Commercial Lending Specialization, 197 total offices, Holding Company: International Bancshares Corporation
- MidFirst Bank: 8 branches. Info updated 2011/07/21: Bank assets: $9,790.2 mil, Deposits: $6,308.2 mil, headquarters in Oklahoma City, OK, positive income, Commercial Lending Specialization, 77 total offices
- BancFirst: 7 branches. Info updated 2012/02/24: Bank assets: $5,407.8 mil, Deposits: $4,893.4 mil, headquarters in Oklahoma City, OK, positive income, Commercial Lending Specialization, 101 total offices, Holding Company: Bancfirst Corporation
- The City National Bank and Trust Company of Lawton, Oklahoma: 7 branches. Info updated 2006/11/03: Bank assets: $287.7 mil, Deposits: $245.8 mil, headquarters in Lawton, OK, positive income, Commercial Lending Specialization, 36 total offices, Holding Company: Jrmb Ii, Inc
- 31 other banks with 52 local branches
For population 15 years and over in Tulsa:
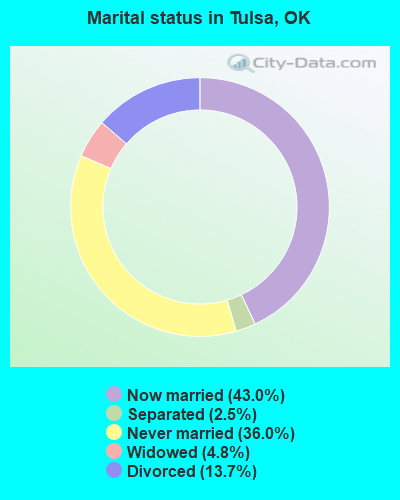
- Never married: 36.0%
- Now married: 43.0%
- Separated: 2.5%
- Widowed: 4.8%
- Divorced: 13.7%
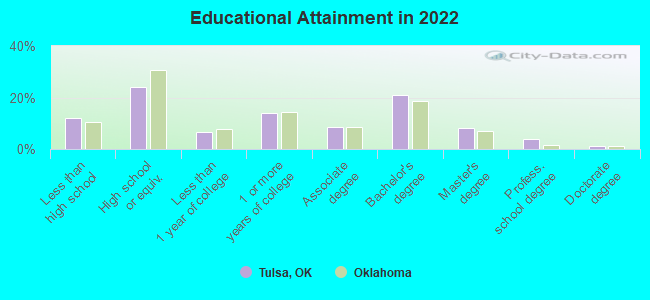
For population 25 years and over in Tulsa:
- High school or higher: 87.8%
- Bachelor's degree or higher: 34.3%
- Graduate or professional degree: 13.1%
- Unemployed: 4.1%
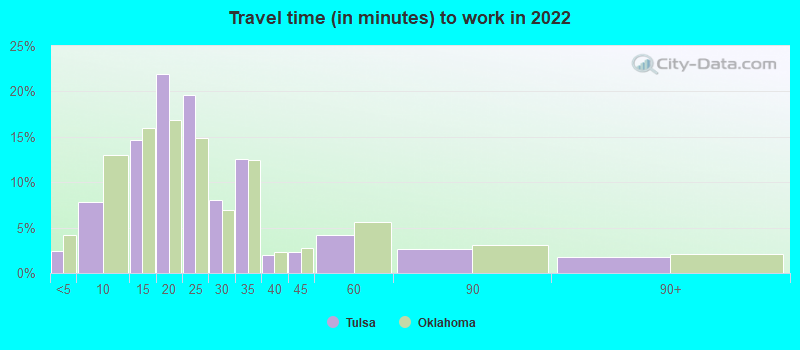
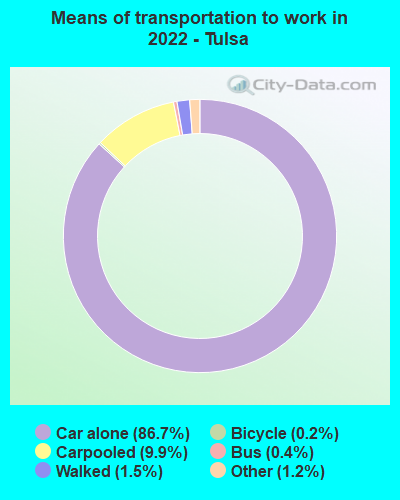
- Mean travel time to work (commute): 16.5 minutes
| Here: | 13.2 |
| Oklahoma average: | 11.3 |
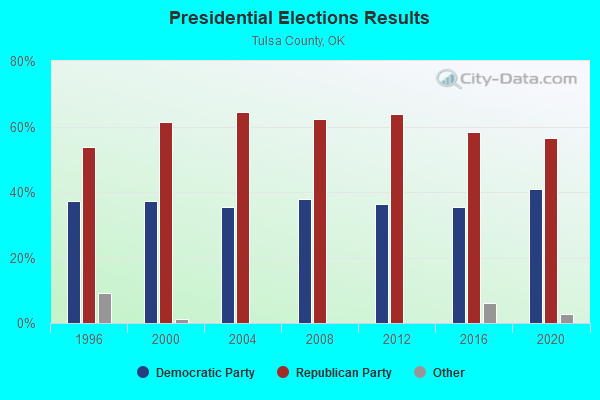
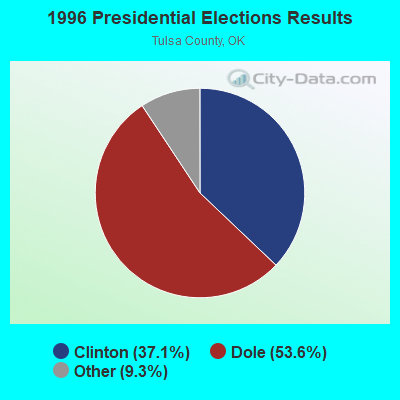
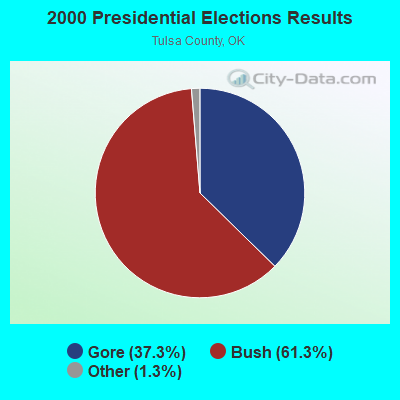

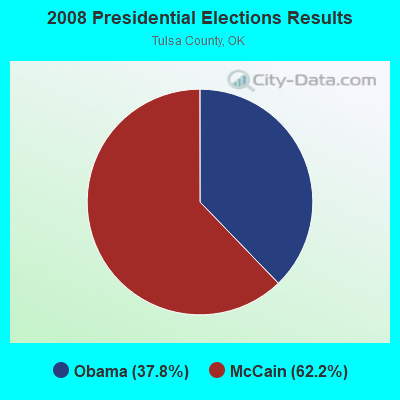
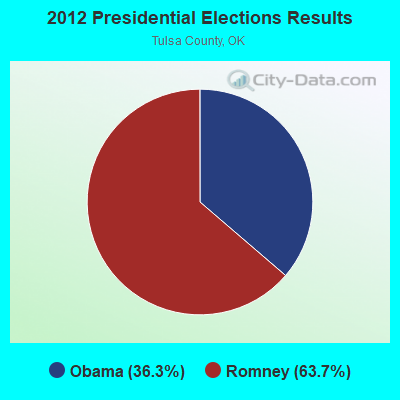
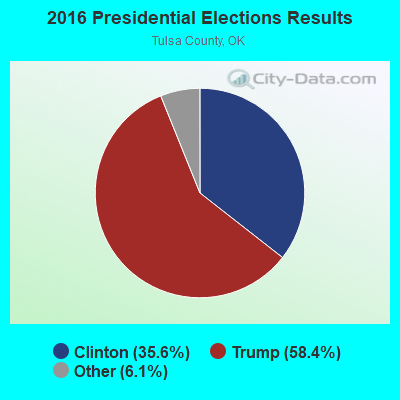
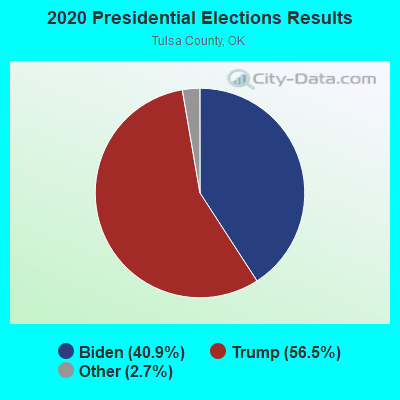
Graphs represent county-level data. Detailed 2008 Election Results
Neighborhoods in Tulsa:
(Tulsa, Oklahoma Neighborhood Map)- 71 Street Corridor (Woodland Hill) neighborhood
- Blue Dome District neighborhood
- Brady Arts District neighborhood
- Brookside neighborhood
- Burning Tree Housing Addition neighborhood
- Cherry Street neighborhood
- Downtown neighborhood
- East Tulsa neighborhood
- East Village District neighborhood
- Expo Square neighborhood
- Greenwood Historical District neighborhood
Religion statistics for Tulsa, OK (based on Tulsa County data)
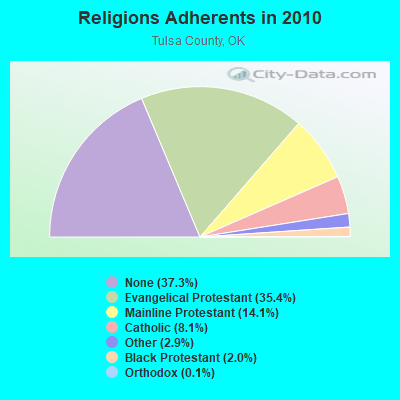
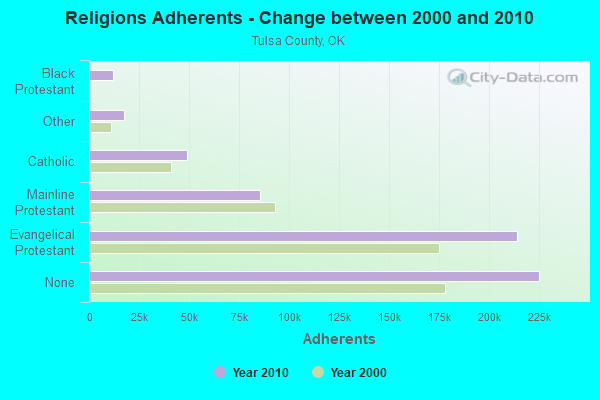
| Religion | Adherents | Congregations |
|---|---|---|
| Evangelical Protestant | 213,615 | 545 |
| Mainline Protestant | 85,250 | 103 |
| Catholic | 49,144 | 23 |
| Other | 17,310 | 49 |
| Black Protestant | 12,226 | 29 |
| Orthodox | 778 | 5 |
| None | 225,080 | - |
Food Environment Statistics:
| Tulsa County: | 1.51 / 10,000 pop. |
| State: | 1.97 / 10,000 pop. |
| Here: | 0.15 / 10,000 pop. |
| Oklahoma: | 0.20 / 10,000 pop. |
| This county: | 0.51 / 10,000 pop. |
| Oklahoma: | 0.76 / 10,000 pop. |
| This county: | 2.84 / 10,000 pop. |
| Oklahoma: | 4.35 / 10,000 pop. |
| Here: | 8.37 / 10,000 pop. |
| Oklahoma: | 6.89 / 10,000 pop. |
| This county: | 9.4% |
| Oklahoma: | 10.3% |
| Tulsa County: | 27.3% |
| Oklahoma: | 29.2% |
Health and Nutrition:
| Here: | 48.3% |
| Oklahoma: | 48.6% |
| Tulsa: | 45.2% |
| Oklahoma: | 45.2% |
| This city: | 28.8 |
| Oklahoma: | 28.7 |
| This city: | 21.1% |
| Oklahoma: | 21.4% |
| Here: | 11.4% |
| Oklahoma: | 10.8% |
| Tulsa: | 6.8 |
| Oklahoma: | 6.8 |
| Tulsa: | 33.3% |
| Oklahoma: | 33.9% |
| Tulsa: | 55.1% |
| Oklahoma: | 55.2% |
| Tulsa: | 79.1% |
| Oklahoma: | 78.4% |
More about Health and Nutrition of Tulsa, OK Residents
| Local government employment and payroll (March 2022) | |||||
| Function | Full-time employees | Monthly full-time payroll | Average yearly full-time wage | Part-time employees | Monthly part-time payroll |
|---|---|---|---|---|---|
| Police Protection - Officers | 827 | $5,869,601 | $85,170 | 0 | $0 |
| Firefighters | 713 | $5,117,936 | $86,136 | 0 | $0 |
| Other and Unallocable | 332 | $1,501,773 | $54,281 | 0 | $0 |
| Streets and Highways | 282 | $1,386,059 | $58,981 | 0 | $0 |
| Water Supply | 271 | $1,260,356 | $55,809 | 0 | $0 |
| Financial Administration | 259 | $1,490,023 | $69,036 | 0 | $0 |
| Sewerage | 228 | $1,178,469 | $62,025 | 0 | $0 |
| Other Government Administration | 210 | $1,120,996 | $64,057 | 6 | $11,666 |
| Transit | 190 | $804,096 | $50,785 | 0 | $0 |
| Police - Other | 171 | $879,097 | $61,691 | 36 | $22,465 |
| Airports | 135 | $717,306 | $63,761 | 0 | $0 |
| Parks and Recreation | 73 | $365,490 | $60,081 | 2 | $3,430 |
| Judicial and Legal | 58 | $423,443 | $87,609 | 1 | $5,310 |
| Solid Waste Management | 38 | $154,289 | $48,723 | 0 | $0 |
| Health | 27 | $96,090 | $42,707 | 1 | $798 |
| Housing and Community Development (Local) | 21 | $114,200 | $65,257 | 0 | $0 |
| Fire - Other | 13 | $62,445 | $57,642 | 0 | $0 |
| Totals for Government | 3,848 | $22,541,670 | $70,296 | 46 | $43,668 |
Tulsa government finances - Expenditure in 2021 (per resident):
- Construction - Regular Highways: $157,966,000 ($383.54)
Sewerage: $57,442,000 ($139.47)
Water Utilities: $44,628,000 ($108.36)
Air Transportation: $8,801,000 ($21.37)
Parks and Recreation: $5,777,000 ($14.03)
General - Other: $3,180,000 ($7.72)
Transit Utilities: $1,872,000 ($4.55)
Health - Other: $598,000 ($1.45)
Parking Facilities: $149,000 ($0.36)
- Current Operations - Police Protection: $115,510,000 ($280.45)
Local Fire Protection: $82,036,000 ($199.18)
Sewerage: $79,139,000 ($192.15)
Health - Other: $74,965,000 ($182.01)
Water Utilities: $63,488,000 ($154.15)
Parks and Recreation: $34,715,000 ($84.29)
Transit Utilities: $34,071,000 ($82.72)
Central Staff Services: $30,415,000 ($73.85)
Public Welfare - Other: $25,931,000 ($62.96)
Solid Waste Management: $23,711,000 ($57.57)
Air Transportation: $19,304,000 ($46.87)
Regular Highways: $17,416,000 ($42.29)
Financial Administration: $17,171,000 ($41.69)
Housing and Community Development: $9,643,000 ($23.41)
Judicial and Legal Services: $7,147,000 ($17.35)
Miscellaneous Commercial Activities - Other: $4,981,000 ($12.09)
Parking Facilities: $4,452,000 ($10.81)
- General - Interest on Debt: $33,763,000 ($81.98)
- Other Capital Outlay - Sewerage: $15,817,000 ($38.40)
Local Fire Protection: $9,518,000 ($23.11)
Water Utilities: $9,203,000 ($22.34)
Police Protection: $7,209,000 ($17.50)
General - Other: $4,525,000 ($10.99)
Parks and Recreation: $2,965,000 ($7.20)
Central Staff Services: $2,876,000 ($6.98)
Solid Waste Management: $1,608,000 ($3.90)
Miscellaneous Commercial Activities - Other: $1,335,000 ($3.24)
Transit Utilities: $1,272,000 ($3.09)
Air Transportation: $929,000 ($2.26)
Health - Other: $685,000 ($1.66)
Public Welfare - Other: $237,000 ($0.58)
Parking Facilities: $77,000 ($0.19)
- Total Salaries and Wages: $30,209,000 ($73.35)
- Water Utilities - Interest on Debt: $2,744,000 ($6.66)
Tulsa government finances - Revenue in 2021 (per resident):
- Charges - Sewerage: $127,145,000 ($308.70)
Other: $70,979,000 ($172.33)
Air Transportation: $30,259,000 ($73.47)
Solid Waste Management: $27,339,000 ($66.38)
Parks and Recreation: $7,557,000 ($18.35)
Parking Facilities: $5,435,000 ($13.20)
Miscellaneous Commercial Activities: $609,000 ($1.48)
- Federal Intergovernmental - Health and Hospitals: $33,248,000 ($80.73)
Air Transportation: $25,118,000 ($60.99)
Transit Utilities: $19,414,000 ($47.14)
Housing and Community Development: $13,027,000 ($31.63)
Other: $5,862,000 ($14.23)
Water Utilities: $1,241,000 ($3.01)
- Local Intergovernmental - Health and Hospitals: $10,335,000 ($25.09)
Transit Utilities: $8,519,000 ($20.68)
Other: $857,000 ($2.08)
- Miscellaneous - General Revenue - Other: $76,323,000 ($185.31)
Special Assessments: $20,881,000 ($50.70)
Interest Earnings: $9,054,000 ($21.98)
Rents: $8,198,000 ($19.90)
Fines and Forfeits: $5,928,000 ($14.39)
Sale of Property: $2,590,000 ($6.29)
- Revenue - Water Utilities: $124,308,000 ($301.82)
Transit Utilities: $4,757,000 ($11.55)
- State Intergovernmental - General Local Government Support: $3,935,000 ($9.55)
Highways: $3,630,000 ($8.81)
Transit Utilities: $2,411,000 ($5.85)
Other: $1,173,000 ($2.85)
Health and Hospitals: $783,000 ($1.90)
- Tax - General Sales and Gross Receipts: $346,845,000 ($842.13)
Property: $72,602,000 ($176.28)
Public Utilities Sales: $21,629,000 ($52.51)
Occupation and Business License - Other: $8,754,000 ($21.25)
Other Selective Sales: $5,653,000 ($13.73)
Tulsa government finances - Debt in 2021 (per resident):
- Long Term Debt - Beginning Outstanding - Unspecified Public Purpose: $1,360,248,000 ($3302.64)
Outstanding Unspecified Public Purpose: $1,267,194,000 ($3076.71)
Retired Unspecified Public Purpose: $182,584,000 ($443.31)
Beginning Outstanding - Public Debt for Private Purpose: $153,760,000 ($373.32)
Outstanding Nonguaranteed - Industrial Revenue: $153,760,000 ($373.32)
Issue, Unspecified Public Purpose: $89,531,000 ($217.38)
Tulsa government finances - Cash and Securities in 2021 (per resident):
- Bond Funds - Cash and Securities: $140,782,000 ($341.81)
- Other Funds - Cash and Securities: $1,313,778,000 ($3189.81)
- Sinking Funds - Cash and Securities: $223,366,000 ($542.33)
6.72% of this county's 2021 resident taxpayers lived in other counties in 2020 ($57,121 average adjusted gross income)
| Here: | 6.72% |
| Oklahoma average: | 8.28% |
0.01% of residents moved from foreign countries ($143 average AGI)
Tulsa County: 0.01% Oklahoma average: 0.04%
Top counties from which taxpayers relocated into this county between 2020 and 2021:
| from Wagoner County, OK | |
| from Rogers County, OK | |
| from Creek County, OK |
6.70% of this county's 2020 resident taxpayers moved to other counties in 2021 ($60,995 average adjusted gross income)
| Here: | 6.70% |
| Oklahoma average: | 7.66% |
0.01% of residents moved to foreign countries ($93 average AGI)
Tulsa County: 0.01% Oklahoma average: 0.03%
Top counties to which taxpayers relocated from this county between 2020 and 2021:
| to Wagoner County, OK | |
| to Rogers County, OK | |
| to Creek County, OK |
| Businesses in Tulsa, OK | ||||
| Name | Count | Name | Count | |
|---|---|---|---|---|
| ALDO | 1 | Kmart | 2 | |
| AMF Bowling | 1 | Kohl's | 2 | |
| AT&T | 13 | La Quinta | 4 | |
| Abercrombie & Fitch | 1 | La-Z-Boy | 2 | |
| Abercrombie Kids | 1 | Lane Bryant | 2 | |
| Academy Sports + Outdoors | 2 | Lane Furniture | 6 | |
| Ace Hardware | 3 | LensCrafters | 2 | |
| Advance Auto Parts | 5 | Little Caesars Pizza | 6 | |
| Aeropostale | 2 | Long John Silver's | 5 | |
| American Eagle Outfitters | 4 | Lowe's | 3 | |
| Ann Taylor | 3 | Macy's | 2 | |
| Apple Store | 1 | Marriott | 9 | |
| Applebee's | 3 | Marshalls | 1 | |
| Arby's | 19 | MasterBrand Cabinets | 24 | |
| Audi | 1 | Maurices | 1 | |
| AutoZone | 8 | Mazda | 1 | |
| Avenue | 1 | McDonald's | 22 | |
| BMW | 1 | Men's Wearhouse | 1 | |
| Banana Republic | 2 | Microtel | 1 | |
| Barnes & Noble | 2 | Motel 6 | 2 | |
| Baskin-Robbins | 3 | Motherhood Maternity | 7 | |
| Bath & Body Works | 4 | New Balance | 10 | |
| Baymont Inn | 1 | New York & Co | 1 | |
| Bed Bath & Beyond | 3 | Nike | 11 | |
| Best Western | 3 | Nissan | 2 | |
| Blockbuster | 10 | Office Depot | 5 | |
| Brookstone | 1 | Old Navy | 2 | |
| Budget Car Rental | 3 | Olive Garden | 2 | |
| Burger King | 9 | On The Border | 2 | |
| Burlington Coat Factory | 1 | Outback | 3 | |
| CVS | 4 | Outback Steakhouse | 3 | |
| Cache | 1 | Pac Sun | 2 | |
| CarMax | 1 | Panda Express | 2 | |
| Carl\s Jr. | 3 | Panera Bread | 5 | |
| Casual Male XL | 1 | Papa John's Pizza | 5 | |
| Catherines | 2 | Payless | 7 | |
| Charlotte Russe | 2 | Penske | 4 | |
| Chevrolet | 4 | PetSmart | 3 | |
| Chick-Fil-A | 7 | Pier 1 Imports | 2 | |
| Chico's | 2 | Pizza Hut | 7 | |
| Chipotle | 2 | Popeyes | 3 | |
| Chuck E. Cheese's | 1 | Pottery Barn | 1 | |
| Church's Chicken | 4 | Pottery Barn Kids | 1 | |
| Cinnabon | 1 | Qdoba Mexican Grill | 4 | |
| Coldwater Creek | 1 | Quality | 1 | |
| Comfort Inn | 1 | Quiznos | 8 | |
| Comfort Suites | 2 | RadioShack | 8 | |
| Cracker Barrel | 1 | Red Lobster | 2 | |
| Cricket Wireless | 18 | Red Robin | 1 | |
| Curves | 3 | Red Roof Inn | 1 | |
| DHL | 4 | Ruby Tuesday | 1 | |
| Dairy Queen | 1 | Rue21 | 1 | |
| Days Inn | 4 | Ryan's Grill | 1 | |
| Deb | 2 | Ryder Rental & Truck Leasing | 1 | |
| Decora Cabinetry | 3 | SAS Shoes | 1 | |
| Dennys | 2 | SONIC Drive-In | 23 | |
| Domino's Pizza | 7 | Saks Fifth Avenue | 1 | |
| DressBarn | 2 | Sam's Club | 2 | |
| Dressbarn | 2 | Sears | 6 | |
| Econo Lodge | 2 | Sephora | 1 | |
| Eddie Bauer | 1 | Shoe Carnival | 2 | |
| Express | 2 | Sleep Inn | 2 | |
| Extended Stay America | 1 | Soma Intimates | 1 | |
| Famous Footwear | 4 | Spencer Gifts | 1 | |
| Fashion Bug | 1 | Sprint Nextel | 5 | |
| FedEx | 110 | Staples | 2 | |
| Finish Line | 2 | Starbucks | 22 | |
| Firestone Complete Auto Care | 5 | Steak 'n Shake | 1 | |
| Ford | 3 | Studio 6 | 1 | |
| Forever 21 | 1 | Studio Plus Deluxe Studios | 1 | |
| Fredericks Of Hollywood | 1 | Subway | 50 | |
| GNC | 4 | Super 8 | 5 | |
| GameStop | 6 | T-Mobile | 20 | |
| Gap | 3 | T.G.I. Driday's | 3 | |
| Goodwill | 1 | T.J.Maxx | 1 | |
| Gymboree | 1 | Taco Bell | 7 | |
| H&R Block | 14 | Talbots | 2 | |
| Haworth | 1 | Target | 4 | |
| Hilton | 11 | The Cheesecake Factory | 1 | |
| Hobby Lobby | 2 | The Limited | 1 | |
| Holiday Inn | 9 | Toyota | 2 | |
| Hollister Co. | 1 | Toys"R"Us | 4 | |
| Home Depot | 4 | True Value | 1 | |
| Honda | 2 | U-Haul | 12 | |
| Hot Topic | 2 | U.S. Cellular | 13 | |
| IHOP | 3 | UPS | 129 | |
| J. Jill | 1 | Vans | 9 | |
| J.Crew | 1 | Verizon Wireless | 3 | |
| JCPenney | 3 | Victoria's Secret | 2 | |
| Jack In The Box | 1 | Village Inn | 5 | |
| Jamba Juice | 2 | Volkswagen | 1 | |
| Jimmy John's | 1 | Waffle House | 3 | |
| JoS. A. Bank | 1 | Walgreens | 15 | |
| Jones New York | 7 | Walmart | 9 | |
| Journeys | 2 | Wendy's | 9 | |
| Justice | 3 | Wet Seal | 1 | |
| KFC | 6 | Whole Foods Market | 1 | |
| Kincaid | 2 | YMCA | 6 | |
Strongest AM radio stations in Tulsa:
- KFAQ (1170 AM; 50 kW; TULSA, OK; Owner: JOURNAL BROADCAST CORPORATION)
- KTBZ (1430 AM; 25 kW; TULSA, OK; Owner: CLEAR CHANNEL BROADCASTING LICENSES, INC.)
- KRMG (740 AM; 50 kW; TULSA, OK; Owner: CXR HOLDINGS, INC.)
- KMUS (1380 AM; 20 kW; MUSKOGEE, OK; Owner: ABC, INC.)
- KCFO (970 AM; 2 kW; TULSA, OK; Owner: FRIENDSHIP BROADCASTING, L. P.)
- KAKC (1300 AM; 5 kW; TULSA, OK; Owner: CLEAR CHANNEL BROADCASTING LICENSES, INC.)
- KGTO (1050 AM; 1 kW; TULSA, OK; Owner: KJMM, INC.)
- KYAL (1550 AM; 2 kW; SAPULPA, OK; Owner: KXOJ, INC.)
- KTFX (1340 AM; 1 kW; SAND SPRINGS, OK; Owner: K95.5, INC.)
- KXTD (1530 AM; daytime; 5 kW; WAGONER, OK; Owner: GAYTAN-GALVAN LIMITED LIABILITY COMP)
- KOMA (1520 AM; 50 kW; OKLAHOMA CITY, OK; Owner: RENDA BROADCASTING CORP. OF NEVADA)
- KGGF (690 AM; 10 kW; COFFEYVILLE, KS; Owner: KGGF-KUSN, INC.)
- KRVT (1270 AM; 1 kW; CLAREMORE, OK; Owner: REUNION BROADCASTING, L.L.C.)
Strongest FM radio stations in Tulsa:
- KIZS (92.1 FM; BROKEN ARROW, OK; Owner: CLEAR CHANNEL BROADCASTING LICENSES, INC.)
- KBEZ (92.9 FM; TULSA, OK; Owner: RENDA BROADCASTING CORP. OF NEVADA)
- KMOD-FM (97.5 FM; TULSA, OK; Owner: CLEAR CHANNEL BROADCASTING LICENSES, INC.)
- KRAV-FM (96.5 FM; TULSA, OK; Owner: CXR HOLDINGS, INC.)
- KWEN (95.5 FM; TULSA, OK; Owner: CXR HOLDINGS, INC.)
- KVOO-FM (98.5 FM; TULSA, OK; Owner: JOURNAL BROADCAST CORPORATION)
- KJMM (105.3 FM; BIXBY, OK; Owner: KJMM, INC.)
- KNYD (90.5 FM; BROKEN ARROW, OK; Owner: CREATIVE EDUCATIONAL MEDIA CORP. INC)
- KJSR (103.3 FM; TULSA, OK; Owner: CXR HOLDINGS, INC.)
- KWGS (89.5 FM; TULSA, OK; Owner: THE UNIVERSITY OF TULSA)
- KMYZ-FM (104.5 FM; PRYOR, OK; Owner: SHAMROCK COMMUNICATIONS, INC.)
- KRTQ (102.3 FM; SAND SPRINGS, OK; Owner: CXR HOLDINGS, INC.)
- KHTT (106.9 FM; MUSKOGEE, OK; Owner: RENDA BROADCASTING CORP. OF NEVADA)
- KXOJ-FM (100.9 FM; SAPULPA, OK; Owner: KXOJ, INC.)
- KTBT (101.5 FM; COLLINSVILLE, OK; Owner: CLEAR CHANNEL BROADCASTING LICENSES, INC.)
- KXBL (99.5 FM; HENRYETTA, OK; Owner: JOURNAL BROADCAST CORPORATION)
- KQLL-FM (106.1 FM; OWASSO, OK; Owner: CLEAR CHANNEL BROADCASTING LICENSES, INC.)
- KTSO (94.1 FM; OKMULGEE, OK; Owner: SHAMROCK COMMUNICATIONS, INC)
- K228BR (93.5 FM; TULSA, OK; Owner: CLEAR CHANNEL BROADCASTING LICENSES, INC.)
- KRSC-FM (91.3 FM; CLAREMORE, OK; Owner: BOARD OF REGENTS OF OKLAHOMA COLLEGES)
TV broadcast stations around Tulsa:
- K39CW (Channel 39; TULSA, OK; Owner: VENTANA TELEVISION, INC.)
- KTZT-LP (Channel 29; TULSA, OK; Owner: ARACELIS ORTIZ, EXECUTRIX OF THE ESTATE OF CARLOS ORTIZ)
- KOPE-LP (Channel 51; TULSA, OK; Owner: COPELAND BROADCASTING CORPORATION)
- K69GO (Channel 69; TULSA, OK; Owner: THREE ANGELS BROADCASTING NETWORK)
- K04NZ (Channel 4; TULSA, OK; Owner: GERALD BROTHERS)
- KGEB (Channel 53; TULSA, OK; Owner: UNIVERSITY BROADCASTING, INC.)
- KJRH (Channel 2; TULSA, OK; Owner: SCRIPPS HOWARD BROADCASTING COMPANY)
- KOED-TV (Channel 11; TULSA, OK; Owner: OKLAHOMA EDUCATIONAL TELEVISION AUTHORITY)
- KOTV (Channel 6; TULSA, OK; Owner: GRIFFIN LICENSING, L.L.C.)
- KWHB (Channel 47; TULSA, OK; Owner: LESEA BROADCASTING CORPORATION)
- KLOT-LP (Channel 25; TULSA, OK; Owner: EQUITY BROADCASTING CORPORATION)
- KTUL (Channel 8; TULSA, OK; Owner: KTUL, LLC)
- KOKI-TV (Channel 23; TULSA, OK; Owner: CLEAR CHANNEL BROADCASTING LICENSES, INC.)
- KTFO (Channel 41; TULSA, OK; Owner: CLEAR CHANNEL BROADCASTING LICENSES, INC.)
- KTPX (Channel 44; OKMULGEE, OK; Owner: PAXSON TULSA LICENSE, INC.)
- KDOR (Channel 17; BARTLESVILLE, OK; Owner: TRINITY BROADCASTING NETWORK)
- K33EK (Channel 33; TULSA, OK; Owner: LOCKE SUPPLY CO.)
- KRSC-TV (Channel 35; CLAREMORE, OK; Owner: BOARD OF REGENTS OF OKLAHOMA COLLEGES)
- KWBT (Channel 19; MUSKOGEE, OK; Owner: TULSA COMMUNICATIONS, L.L.C.)
- K15DA (Channel 15; TULSA, OK; Owner: LOCKE SUPPLY CO.)
- National Bridge Inventory (NBI) Statistics
- 1,018Number of bridges
- 12,605ft / 3,842mTotal length
- $1,477,519,000Total costs
- 19,139,960Total average daily traffic
- 1,822,874Total average daily truck traffic
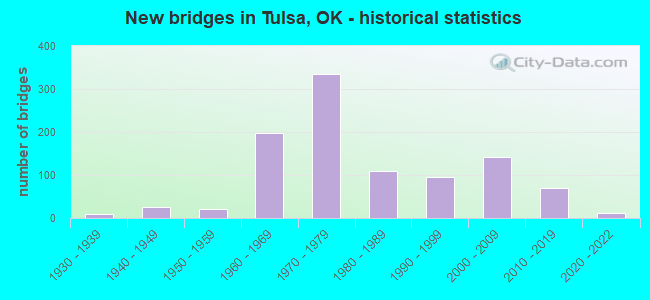
- New bridges - historical statistics
- 11910-1919
- 11920-1929
- 91930-1939
- 261940-1949
- 221950-1959
- 1971960-1969
- 3341970-1979
- 1101980-1989
- 961990-1999
- 1422000-2009
- 692010-2019
- 112020-2022
FCC Registered Antenna Towers: 2,526 (See the full list of FCC Registered Antenna Towers)
FCC Registered Commercial Land Mobile Towers: 26 (See the full list of FCC Registered Commercial Land Mobile Towers in Tulsa, OK)
FCC Registered Private Land Mobile Towers: 41 (See the full list of FCC Registered Private Land Mobile Towers)
FCC Registered Broadcast Land Mobile Towers: 323 (See the full list of FCC Registered Broadcast Land Mobile Towers)
FCC Registered Microwave Towers: 303 (See the full list of FCC Registered Microwave Towers in this town)
FCC Registered Paging Towers: 35 (See the full list of FCC Registered Paging Towers)
FCC Registered Maritime Coast & Aviation Ground Towers: 51 (See the full list of FCC Registered Maritime Coast & Aviation Ground Towers)
FCC Registered Amateur Radio Licenses: 2,160 (See the full list of FCC Registered Amateur Radio Licenses in Tulsa)
FAA Registered Aircraft Manufacturers and Dealers: 35 (See the full list of FAA Registered Manufacturers and Dealers in Tulsa)
FAA Registered Aircraft: 808 (See the full list of FAA Registered Aircraft)
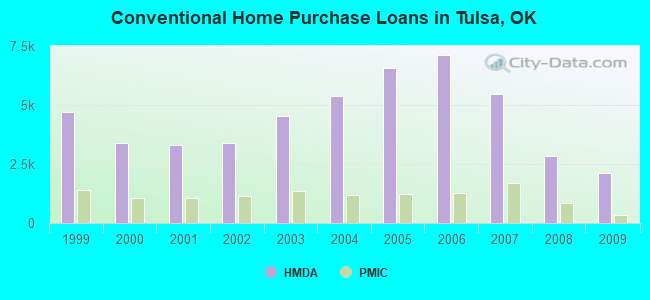
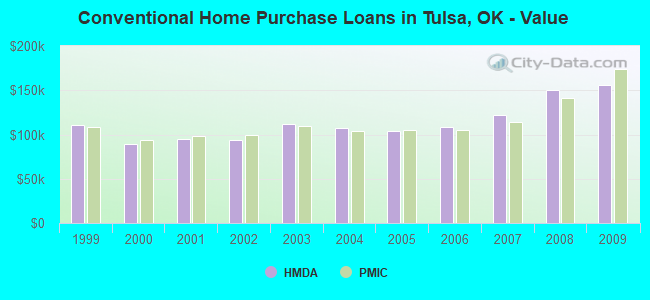
| Home Mortgage Disclosure Act Aggregated Statistics For Year 2009 (Based on 113 full and 17 partial tracts) | ||||||||||||||
| A) FHA, FSA/RHS & VA Home Purchase Loans | B) Conventional Home Purchase Loans | C) Refinancings | D) Home Improvement Loans | E) Loans on Dwellings For 5+ Families | F) Non-occupant Loans on < 5 Family Dwellings (A B C & D) | G) Loans On Manufactured Home Dwelling (A B C & D) | ||||||||
|---|---|---|---|---|---|---|---|---|---|---|---|---|---|---|
| Number | Average Value | Number | Average Value | Number | Average Value | Number | Average Value | Number | Average Value | Number | Average Value | Number | Average Value | |
| LOANS ORIGINATED | 2,445 | $118,589 | 2,111 | $156,361 | 5,868 | $162,593 | 865 | $51,001 | 36 | $1,896,167 | 800 | $104,187 | 131 | $9,367 |
| APPLICATIONS APPROVED, NOT ACCEPTED | 105 | $119,303 | 123 | $144,267 | 537 | $134,578 | 59 | $47,504 | 0 | $0 | 47 | $79,937 | 24 | $54,711 |
| APPLICATIONS DENIED | 255 | $106,538 | 327 | $139,283 | 2,081 | $134,690 | 513 | $31,011 | 3 | $584,333 | 238 | $74,317 | 33 | $42,973 |
| APPLICATIONS WITHDRAWN | 278 | $116,322 | 243 | $156,203 | 1,568 | $143,648 | 110 | $73,663 | 2 | $7,612,500 | 117 | $103,293 | 3 | $60,383 |
| FILES CLOSED FOR INCOMPLETENESS | 47 | $119,474 | 54 | $186,387 | 449 | $149,329 | 21 | $142,512 | 0 | $0 | 18 | $110,010 | 1 | $128,210 |
Detailed mortgage data for all 129 tracts in Tulsa, OK
| Private Mortgage Insurance Companies Aggregated Statistics For Year 2009 (Based on 94 full and 13 partial tracts) | ||||||
| A) Conventional Home Purchase Loans | B) Refinancings | C) Non-occupant Loans on < 5 Family Dwellings (A & B) | ||||
|---|---|---|---|---|---|---|
| Number | Average Value | Number | Average Value | Number | Average Value | |
| LOANS ORIGINATED | 325 | $173,926 | 245 | $175,795 | 6 | $155,500 |
| APPLICATIONS APPROVED, NOT ACCEPTED | 74 | $160,987 | 75 | $188,301 | 5 | $92,552 |
| APPLICATIONS DENIED | 30 | $143,815 | 43 | $144,082 | 0 | $0 |
| APPLICATIONS WITHDRAWN | 17 | $193,608 | 18 | $167,709 | 2 | $99,000 |
| FILES CLOSED FOR INCOMPLETENESS | 8 | $109,471 | 7 | $134,297 | 2 | $79,980 |
2002 - 2018 National Fire Incident Reporting System (NFIRS) incidents
- Fire incident types reported to NFIRS in Tulsa, OK
- 16,29244.3%Outside Fires
- 11,67931.7%Structure Fires
- 7,06319.2%Mobile Property/Vehicle Fires
- 1,7544.8%Other
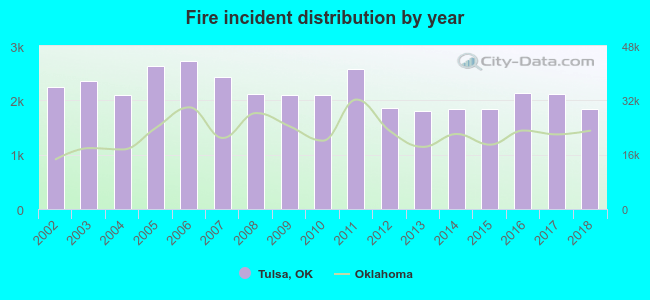 According to the data from the years 2002 - 2018 the average number of fire incidents per year is 2164. The highest number of reported fire incidents - 2,726 took place in 2006, and the least - 1,795 in 2013. The data has a declining trend.
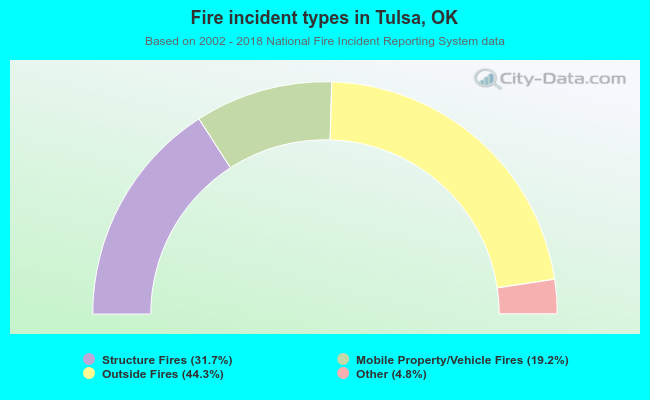 When looking into fire subcategories, the most reports belonged to: Outside Fires (44.3%), and Structure Fires (31.7%).
Fire-safe hotels and motels in Tulsa, Oklahoma:
- Americas Best Value Inn & Suites, 3509 S 79th East Ave, Tulsa, Oklahoma 74145 , Phone: (918) 663-3900, Fax: (918) 664-0548
- La Quinta Inn #4697, 10829 E 41ST St, Tulsa, Oklahoma 74146 , Phone: (918) 665-0220, Fax: (918) 664-4810
- Howard Johnson Inn, 8525 E 41st St, Tulsa, Oklahoma 74145 , Phone: (918) 627-0030, Fax: (918) 627-0587
- Econo Lodge Airport, 11620 E Skelly Dr, Tulsa, Oklahoma 74128 , Phone: (918) 437-9200, Fax: (918) 437-2935
- Country Inn & Suites-Tulsa Central, 3209 S 79TH E Ave, Tulsa, Oklahoma 74145 , Phone: (918) 663-1000, Fax: (918) 663-0587
- Wyndham Tulsa, 10918 E 41ST St, Tulsa, Oklahoma 74146 , Phone: (918) 627-5000, Fax: (918) 627-9562
- Doubletree Hotel Tulsa Downtown, 616 W 7th St, Tulsa, Oklahoma 74127 , Phone: (918) 587-8000, Fax: (918) 587-3001
- Hyatt Regency, 100 E 2ND St, Tulsa, Oklahoma 74103 , Phone: (918) 582-9000, Fax: (918) 560-2232
- 76 other hotels and motels
| Most common first names in Tulsa, OK among deceased individuals | ||
| Name | Count | Lived (average) |
|---|---|---|
| Mary | 2,588 | 79.3 years |
| William | 2,326 | 74.8 years |
| John | 2,305 | 74.1 years |
| James | 2,290 | 72.1 years |
| Robert | 1,819 | 71.2 years |
| Charles | 1,587 | 73.2 years |
| George | 1,185 | 75.3 years |
| Helen | 986 | 79.9 years |
| Ruth | 975 | 80.4 years |
| Dorothy | 952 | 76.8 years |
| Most common last names in Tulsa, OK among deceased individuals | ||
| Last name | Count | Lived (average) |
|---|---|---|
| Smith | 1,433 | 74.8 years |
| Johnson | 1,004 | 75.3 years |
| Jones | 869 | 73.1 years |
| Brown | 832 | 75.2 years |
| Williams | 824 | 74.2 years |
| Davis | 674 | 74.7 years |
| Miller | 597 | 76.1 years |
| Wilson | 573 | 74.7 years |
| Moore | 494 | 74.9 years |
| Taylor | 470 | 75.0 years |
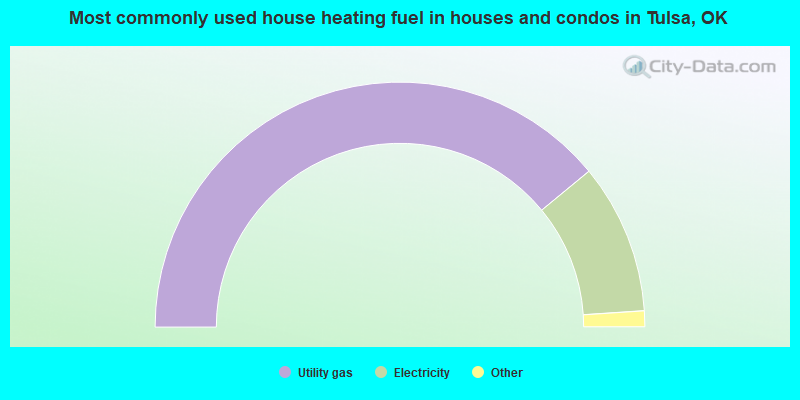
- 78.0%Utility gas
- 19.8%Electricity
- 1.3%Bottled, tank, or LP gas
- 0.6%No fuel used
- 0.2%Other fuel
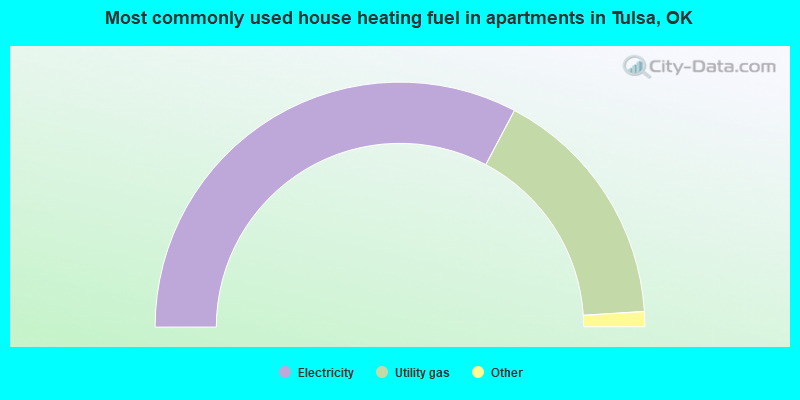
- 65.5%Electricity
- 32.5%Utility gas
- 0.9%Bottled, tank, or LP gas
- 0.8%No fuel used
- 0.2%Other fuel
Tulsa compared to Oklahoma state average:
- Unemployed percentage significantly below state average.
- Black race population percentage above state average.
- Foreign-born population percentage above state average.
- Percentage of population with a bachelor's degree or higher above state average.
Tulsa, OK compared to other similar cities:
Tulsa on our top lists:
- #26 on the list of "Top 101 cities with largest percentage of females in industries: mining, quarrying, and oil and gas extraction (population 50,000+)"
- #27 on the list of "Top 101 cities with the highest number of rapes per 100,000 residents, excludes tourist destinations and others with a lot of outsiders visiting based on city industries data (population 50,000+)"
- #36 on the list of "Top 101 cities with the largest house values disparities (population 50,000+)"
- #37 on the list of "Top 101 cities with the highest number of arson incidents per 100,000 residents, excludes tourist destinations and others with a lot of outsiders visiting based on city industries data (population 50,000+)"
- #37 on the list of "Top 101 cities with the highest average snowfall in a year (population 50,000+)"
- #46 on the list of "Top 100 least-safe cities (highest city-data.com crime index) (pop. 50,000+)"
- #54 on the list of "Top 101 cities with the highest number of burglaries per 100,000 residents, excludes tourist destinations and others with a lot of outsiders visiting based on city industries data (population 50,000+)"
- #56 on the list of "Top 101 cities with the highest number of assaults per 100,000 residents, excludes tourist destinations and others with a lot of outsiders visiting based on city industries data (population 50,000+)"
- #58 on the list of "Top 101 biggest cities in 2013"
- #58 on the list of "Top 100 biggest cities"
- #59 on the list of "Top 101 cities with largest percentage of females in occupations: construction and extraction occupations (population 50,000+)"
- #59 on the list of "Top 101 cities with the highest city-data.com crime index, excludes tourist destinations and others with a lot of outsiders visiting based on city industries data (population 50,000+)"
- #61 on the list of "Top 100 cities with largest land areas (pop. 50,000+)"
- #71 on the list of "Top 101 cities with largest percentage of males in industries: mining, quarrying, and oil and gas extraction (population 50,000+)"
- #81 on the list of "Top 100 most racially diverse cities (pop. 50,000+)"
- #84 on the list of "Top 101 cities with the highest number of auto thefts per 100,000 residents, excludes tourist destinations and others with a lot of outsiders visiting based on city industries data (population 50,000+)"
- #88 on the list of "Top 101 cities with the largest city-data.com crime index per police officer (population 50,000+)"
- #91 on the list of "Top 100 cities with shortest commuting times (pop. 50,000+)"
- #95 on the list of "Top 101 cities with the largest percentage of people in job corps and vocational training facilities (population 1,000+)"
- #96 on the list of "Top 101 cities with the highest number of murders per 100,000 residents, excludes tourist destinations and others with a lot of outsiders visiting based on city industries data (population 50,000+)"
- #4 (74103) on the list of "Top 101 zip codes with the highest 2012 average net capital gain/loss (pop 1,000+)"
- #8 (74103) on the list of "Top 101 zip codes with the highest 2012 average taxable interest for individuals (pop 1,000+)"
- #10 (74119) on the list of "Top 101 zip codes with the largest charity contributions deductions as a percentage of AGI in 2012 (pop 1,000+)"
- #27 (74103) on the list of "Top 101 zip codes with the highest 2012 average Adjusted Gross Income (AGI) for individuals (pop 1,000+)"
- #44 (74115) on the list of "Top 101 zip codes with the lowest 2012 average net capital gain/loss (pop 5,000+)"
- #86 (74110) on the list of "Top 101 zip codes with the smallest percentage of taxpayers using charity contributions deductions in 2012 (pop 5,000+)"
- #96 (74104) on the list of "Top 101 zip codes with the most offices of physicians in 2005"
- #6 on the list of "Top 101 counties with the highest lead air pollution readings in 2012 (µg/m3)"
- #13 on the list of "Top 101 counties with the lowest percentage of residents relocating from foreign countries between 2010 and 2011 (pop. 50,000+)"
- #20 on the list of "Top 101 counties with the most Evangelical Protestant adherents"
- #22 on the list of "Top 101 counties with the most Evangelical Protestant congregations"
- #24 on the list of "Top 101 counties with the lowest lead air pollution readings in 2012 (µg/m3)"
State forum archive:

|
|
Total of 1471 patent applications in 2008-2024.