Estimated zip code population in 2022: 21,897 Zip code population in 2010: 20,684 Zip code population in 2000: 21,222
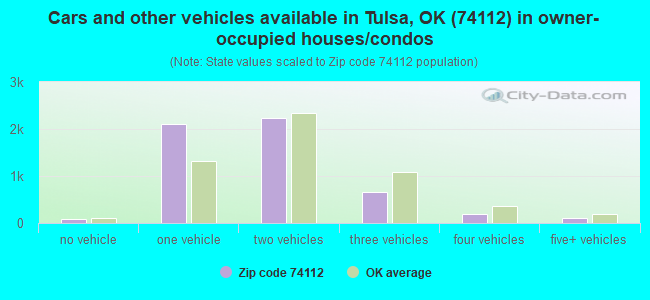
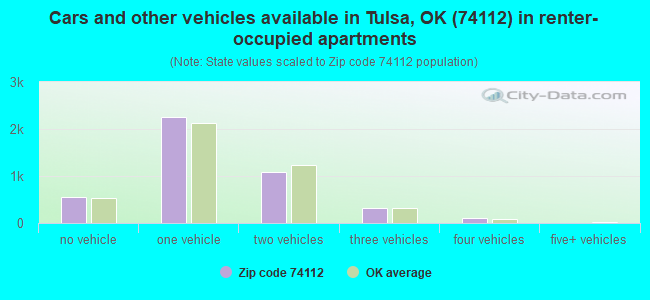
Houses and condos: 10,725 Renter-occupied apartments: 4,325
% of renters here:
45%
State:
35%
March 2022 cost of living index in zip code 74112: 86.4 (less than average, U.S. average is 100)
Land area: 6.8 sq. mi. Water area: 0.0 sq. mi.
Population density: 3,230 people per square mile
(average).
OSM Map
General Map
Google Map
MSN Map
OSM Map
General Map
Google Map
MSN Map
OSM Map
General Map
Google Map
MSN Map
OSM Map
General Map
Google Map
MSN Map
Please wait while loading the map...
Real estate property taxes paid for housing units in 2022:
This zip code:
1.0% ($1,548)
Oklahoma:
0.8% ($1,501)
Median real estate property taxes paid for housing units with mortgages in 2022: $1,623 (1.0%) Median real estate property taxes paid for housing units with no mortgage in 2022: $1,422 (1.0%)
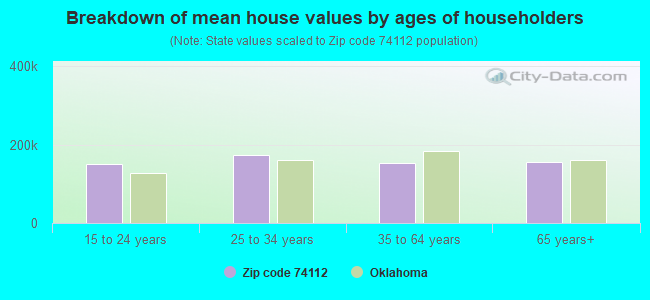
Estimated median house/condo value in 2022: $153,810
74112:
$153,810
Oklahoma:
$191,700
According to our research of Oklahoma and other state lists, there were 43 registered sex offenders living in 74112 zip code as of April 26, 2024. The ratio of all residents to sex offenders in zip code 74112 is 485 to 1. The ratio of registered sex offenders to all residents in this zip code is near the state average.
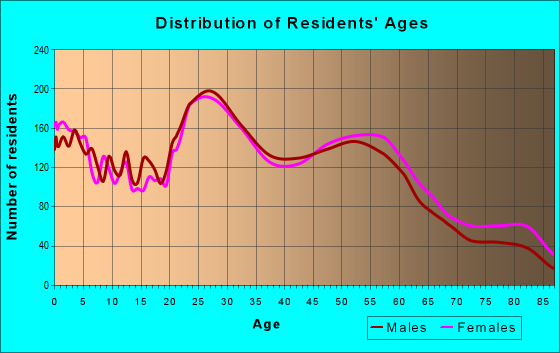
Median resident age:
This zip code:
37.7 years
Oklahoma median age:
37.1 years
Average household size:
This zip code:
2.3 people
Oklahoma:
2.5 people
Averages for the 2020 tax year for zip code 74112, filed in 2021:
Average Adjusted Gross Income (AGI) in 2020: $42,637 (Individual Income Tax Returns)
Here:
$42,637
State:
$63,060
Salary/wage: $38,890 (reported on 85.2% of returns)
Here:
$38,890
State:
$52,427
(% of AGI for various income ranges: 1122.0% for AGIs below $25k, 3673.3% for AGIs $25k-50k, 6875.1% for AGIs $50k-75k, 10118.9% for AGIs $75k-100k, 18501.2% for AGIs $100k-200k, 34503.3% for AGIs over 200k)
Taxable interest for individuals: $819 (reported on 20.1% of returns)
This zip code:
$819
Oklahoma:
$1,603
(% of AGI for various income ranges: 10.2% for AGIs below $25k, 13.4% for AGIs $25k-50k, 26.9% for AGIs $50k-75k, 49.6% for AGIs $75k-100k, 85.0% for AGIs $100k-200k, 500.0% for AGIs over 200k)
Ordinary dividends: $2,792 (reported on 10.3% of returns)
Here:
$2,792
State:
$7,001
(% of AGI for various income ranges: 13.8% for AGIs below $25k, 17.7% for AGIs $25k-50k, 54.2% for AGIs $50k-75k, 67.3% for AGIs $75k-100k, 235.9% for AGIs $100k-200k, 780.0% for AGIs over 200k)
Net capital gain/loss in AGI: +$6,369 (reported on 9.0% of returns)
Here:
+$6,369
State:
+$19,855
(% of AGI for various income ranges: 6.5% for AGIs below $25k, 10.8% for AGIs $25k-50k, 51.8% for AGIs $50k-75k, 107.1% for AGIs $75k-100k, 448.4% for AGIs $100k-200k, 8273.3% for AGIs over 200k)
Profit/loss from business: +$8,551 (reported on 16.1% of returns)
Here:
+$8,551
State:
+$9,904
(% of AGI for various income ranges: 160.2% for AGIs below $25k, 133.5% for AGIs $25k-50k, 196.8% for AGIs $50k-75k, 212.9% for AGIs $75k-100k, 655.0% for AGIs $100k-200k)
Taxable individual retirement arrangement distribution: $14,611 (reported on 5.7% of returns)
74112:
$14,611
Oklahoma:
$20,476
(% of AGI for various income ranges: 37.8% for AGIs below $25k, 44.1% for AGIs $25k-50k, 152.0% for AGIs $50k-75k, 226.2% for AGIs $75k-100k, 957.5% for AGIs $100k-200k)
Total itemized deductions: $29,852 (reported on 2.7% of returns)
Here:
$29,852
State:
$39,736
(% of AGI for various income ranges: 14.2% for AGIs below $25k, 46.0% for AGIs $25k-50k, 126.3% for AGIs $50k-75k, 279.6% for AGIs $75k-100k, 752.5% for AGIs $100k-200k, 2950.0% for AGIs over 200k)
Charity contributions: $7,405 (reported on 2.0% of returns)
Here:
$7,405
State:
$17,288
(% of AGI for various income ranges: 12.9% for AGIs $25k-50k, 24.1% for AGIs $50k-75k, 53.1% for AGIs $75k-100k, 100.0% for AGIs $100k-200k, 886.7% for AGIs over 200k)
Taxes paid: $5,179 (reported on 2.5% of returns)
74112:
$5,179
State:
$7,046
(% of AGI for various income ranges: 1.2% for AGIs below $25k, 4.6% for AGIs $25k-50k, 21.2% for AGIs $50k-75k, 57.1% for AGIs $75k-100k, 125.6% for AGIs $100k-200k, 683.3% for AGIs over 200k)
Earned income credit: $2,265 (reported on 21.4% of returns)
Here:
$2,265
State:
$2,435
(% of AGI for various income ranges: 103.8% for AGIs below $25k, 66.7% for AGIs $25k-50k, 0.9% for AGIs $50k-75k)
Percentage of individuals using paid preparers for their 2020 taxes: 93.3%
Here:
93%
State:
94%
(% for various income ranges: 92.5% for AGIs below $25k, 94.1% for AGIs $25k-50k, 94.0% for AGIs $50k-75k, 92.4% for AGIs $75k-100k, 93.3% for AGIs $100k-200k, 100.0% for AGIs over 200k)
Averages for the 2012 tax year for zip code 74112, filed in 2013:
Average Adjusted Gross Income (AGI) in 2012: $37,759 (Individual Income Tax Returns)
Here:
$37,759
State:
$58,581
Salary/wage: $34,812 (reported on 86.2% of returns)
Here:
$34,812
State:
$45,973
(% of AGI for various income ranges: 78.4% for AGIs below $25k, 86.3% for AGIs $25k-50k, 83.8% for AGIs $50k-75k, 81.4% for AGIs $75k-100k, 74.1% for AGIs $100k-200k, 31.8% for AGIs over 200k)
Taxable interest for individuals: $1,033 (reported on 24.9% of returns)
This zip code:
$1,033
Oklahoma:
$1,625
(% of AGI for various income ranges: 0.9% for AGIs below $25k, 0.6% for AGIs $25k-50k, 0.5% for AGIs $50k-75k, 0.4% for AGIs $75k-100k, 0.6% for AGIs $100k-200k, 2.1% for AGIs over 200k)
Ordinary dividends: $2,609 (reported on 10.9% of returns)
Here:
$2,609
State:
$6,374
(% of AGI for various income ranges: 0.8% for AGIs below $25k, 0.5% for AGIs $25k-50k, 0.7% for AGIs $50k-75k, 0.7% for AGIs $75k-100k, 1.0% for AGIs $100k-200k, 2.1% for AGIs over 200k)
Net capital gain/loss in AGI: +$3,325 (reported on 7.4% of returns)
Here:
+$3,325
State:
+$24,023
(% of AGI for various income ranges: 0.2% for AGIs $25k-50k, 0.4% for AGIs $50k-75k, 0.8% for AGIs $75k-100k, 1.7% for AGIs $100k-200k, 3.2% for AGIs over 200k)
Profit/loss from business: +$9,195 (reported on 13.5% of returns)
Here:
+$9,195
State:
+$11,913
(% of AGI for various income ranges: 7.8% for AGIs below $25k, 2.6% for AGIs $25k-50k, 2.0% for AGIs $50k-75k, 2.4% for AGIs $75k-100k, 4.1% for AGIs $100k-200k)
Taxable individual retirement arrangement distribution: $9,749 (reported on 8.1% of returns)
74112:
$9,749
Oklahoma:
$15,242
(% of AGI for various income ranges: 2.6% for AGIs below $25k, 1.6% for AGIs $25k-50k, 1.9% for AGIs $50k-75k, 2.3% for AGIs $75k-100k, 3.6% for AGIs $100k-200k)
Total itemized deductions: $16,664 (24% of AGI, reported on 19.3% of returns)
Here:
$16,664
State:
$24,882
Here:
24.3% of AGI
State:
18.8% of AGI
(% of AGI for various income ranges: 5.1% for AGIs below $25k, 6.3% for AGIs $25k-50k, 8.1% for AGIs $50k-75k, 9.8% for AGIs $75k-100k, 12.2% for AGIs $100k-200k, 20.9% for AGIs over 200k)
Charity contributions: $3,339 (reported on 14.9% of returns)
Here:
$3,339
State:
$6,591
(% of AGI for various income ranges: 0.5% for AGIs below $25k, 0.9% for AGIs $25k-50k, 1.3% for AGIs $50k-75k, 1.9% for AGIs $75k-100k, 2.4% for AGIs $100k-200k, 1.9% for AGIs over 200k)
Taxes paid: $4,172 (reported on 19.3% of returns)
74112:
$4,172
State:
$7,196
(% of AGI for various income ranges: 0.8% for AGIs below $25k, 1.4% for AGIs $25k-50k, 2.3% for AGIs $50k-75k, 2.6% for AGIs $75k-100k, 3.7% for AGIs $100k-200k, 4.2% for AGIs over 200k)
Earned income credit: $2,213 (reported on 23.4% of returns)
Here:
$2,213
State:
$2,354
(% of AGI for various income ranges: 7.0% for AGIs below $25k, 1.0% for AGIs $25k-50k)
Percentage of individuals using paid preparers for their 2012 taxes: 46.2%
Here:
46%
State:
56%
(% for various income ranges: 44.7% for AGIs below $25k, 44.4% for AGIs $25k-50k, 49.3% for AGIs $50k-75k, 50.0% for AGIs $75k-100k, 56.8% for AGIs $100k-200k, 80.0% for AGIs over 200k)
Averages for the 2004 tax year for zip code 74112, filed in 2005:
Average Adjusted Gross Income (AGI) in 2004: $31,380 (Individual Income Tax Returns)
Here:
$31,380
State:
$41,245
Salary/wage: $30,130 (reported on 83.6% of returns)
Here:
$30,130
State:
$35,318
(% of AGI for various income ranges: 97.3% for AGIs below $10k, 77.1% for AGIs $10k-25k, 84.4% for AGIs $25k-50k, 82.3% for AGIs $50k-75k, 80.2% for AGIs $75k-100k, 63.8% for AGIs over 100k)
Taxable interest for individuals: $1,476 (reported on 37.8% of returns)
This zip code:
$1,476
Oklahoma:
$1,745
(% of AGI for various income ranges: 4.3% for AGIs below $10k, 3.0% for AGIs $10k-25k, 1.5% for AGIs $25k-50k, 1.2% for AGIs $50k-75k, 1.4% for AGIs $75k-100k, 1.6% for AGIs over 100k)
Taxable dividends: $1,823 (reported on 15.7% of returns)
Here:
$1,823
State:
$2,920
(% of AGI for various income ranges: 2.7% for AGIs below $10k, 0.9% for AGIs $10k-25k, 0.7% for AGIs $25k-50k, 0.6% for AGIs $50k-75k, 0.9% for AGIs $75k-100k, 1.9% for AGIs over 100k)
Net capital gain/loss: +$2,323 (reported on 12.4% of returns)
Here:
+$2,323
State:
+$10,653
(% of AGI for various income ranges: -1.4% for AGIs below $10k, 0.0% for AGIs $10k-25k, 0.2% for AGIs $25k-50k, 0.5% for AGIs $50k-75k, 1.4% for AGIs $75k-100k, 5.4% for AGIs over 100k)
Profit/loss from business: +$7,076 (reported on 13.7% of returns)
Here:
+$7,076
State:
+$8,532
(% of AGI for various income ranges: 4.5% for AGIs below $10k, 5.5% for AGIs $10k-25k, 1.8% for AGIs $25k-50k, 2.5% for AGIs $50k-75k, 2.5% for AGIs $75k-100k, 4.8% for AGIs over 100k)
IRA payment deduction: $2,551 (reported on 2.0% of returns)
74112:
$2,551
Oklahoma:
$3,127
(% of AGI for various income ranges: 0.2% for AGIs $10k-25k, 0.2% for AGIs $25k-50k, 0.1% for AGIs $50k-75k, 0.2% for AGIs $75k-100k)
Self-employed pension: $5,650 (reported on 0.2% of returns)
Here:
$5,650
Oklahoma:
$14,276
Total itemized deductions: $12,518 (24% of AGI, reported on 29.4% of returns)
Here:
$12,518
State:
$17,093
Here:
23.8% of AGI
State:
20.5% of AGI
(% of AGI for various income ranges: 10.1% for AGIs below $10k, 7.5% for AGIs $10k-25k, 11.4% for AGIs $25k-50k, 12.6% for AGIs $50k-75k, 13.0% for AGIs $75k-100k, 16.9% for AGIs over 100k)
Charity contributions deductions: $2,614 (5% of AGI, reported on 24.8% of returns)
Here:
$2,614
State:
$4,240
Here:
4.8% of AGI
State:
4.8% of AGI
(% of AGI for various income ranges: 0.9% for AGIs below $10k, 1.2% for AGIs $10k-25k, 1.8% for AGIs $25k-50k, 2.4% for AGIs $50k-75k, 2.9% for AGIs $75k-100k, 2.9% for AGIs over 100k)
Total tax: $3,705 (reported on 72.3% of returns)
74112:
$3,705
State:
$6,542
(% of AGI for various income ranges: 2.6% for AGIs below $10k, 4.1% for AGIs $10k-25k, 7.0% for AGIs $25k-50k, 9.8% for AGIs $50k-75k, 11.4% for AGIs $75k-100k, 16.2% for AGIs over 100k)
Earned income credit: $1,667 (reported on 19.9% of returns)
Here:
$1,667
State:
$1,830
Percentage of individuals using paid preparers for their 2004 taxes: 57.1%
Here:
57%
State:
63%
(% for various income ranges: 54.6% for AGIs below $10k, 60.8% for AGIs $10k-25k, 55.3% for AGIs $25k-50k, 53.3% for AGIs $50k-75k, 62.1% for AGIs $75k-100k, 64.9% for AGIs over 100k)
Likely homosexual households (counted as self-reported same-sex unmarried-partner households)
Lesbian couples: 0.2% of all households
Gay men: 0.5% of all households
Household received Food Stamps/SNAP in the past 12 months: 1,771 Household did not receive Food Stamps/SNAP in the past 12 months: 7,943
Women who had a birth in the past 12 months: 314 (163 now married, 147 unmarried) Women who did not have a birth in the past 12 months: 4,984 (1,897 now married, 3,087 unmarried)
Housing units in zip code 74112 with a mortgage: 3,257 (192 second mortgage, 16 home equity loan, 130 both second mortgage and home equity loan) Houses without a mortgage: 80
Median monthly owner costs for units with a mortgage: $1,166 Median monthly owner costs for units without a mortgage: $464
Residents with income below the poverty level in 2022:
This zip code:
17.9%
Whole state:
15.7%
Residents with income below 50% of the poverty level in 2022:
This zip code:
8.1%
Whole state:
8.3%
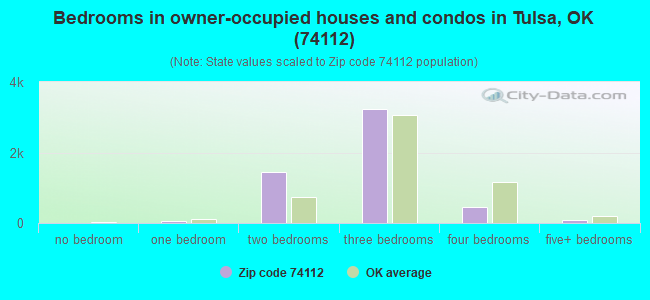
Median number of rooms in houses and condos:
Here:
5.9
State:
6.1
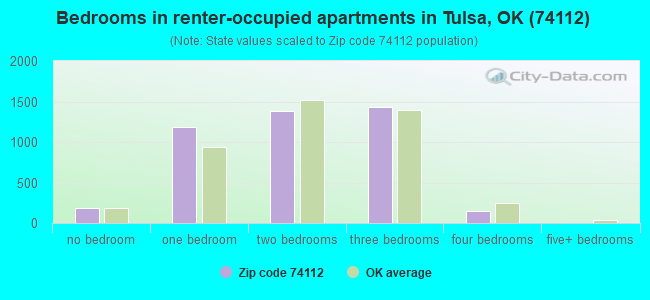
Median number of rooms in apartments:
Here:
4.7
State:
4.5
Notable locations in this zip code not listed on our city pages
Churches in zip code 74112 include: Yale Avenue Presbyterian Church (A), Will Rogers United Methodist Church (B), Saint Lukes Episcopal Church (C), Maranatha Assembly of God Church (D), Memorial Drive Methodist Church (E), New Life Tabernacle Church (F), Reorganized Church of Jesus (G), Rogers Heights Christian Church (H), Sandusky Avenue Christian Church (I). Display/hide their locations on the map
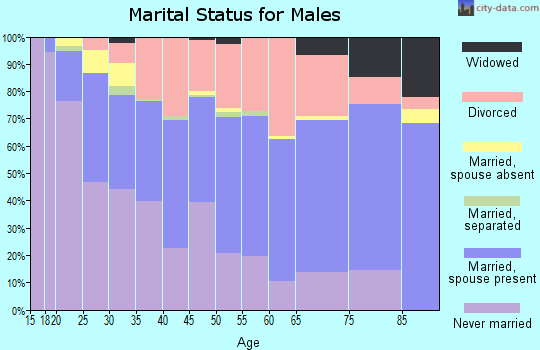
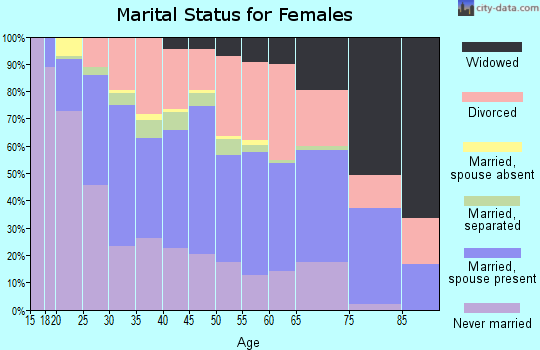
2,171 married couples with children.
1,787 single-parent households (378 men, 1,409 women).
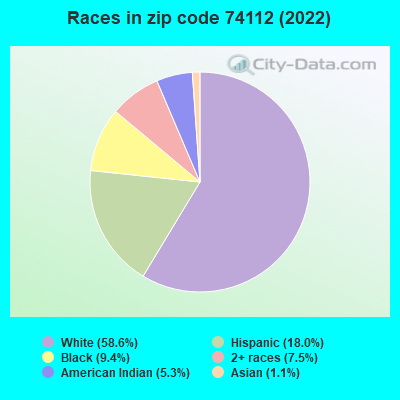
84.1% of residents of 74112 zip code speak English at home.
14.2% of residents speak Spanish at home (66% very well, 14% well, 10% not well, 9% not at all).
0.7% of residents speak other Indo-European language at home (79% very well, 7% well, 14% not at all).
0.9% of residents speak Asian or Pacific Island language at home (63% very well, 10% well, 11% not well, 15% not at all).
0.5% of residents speak other language at home (100% very well).
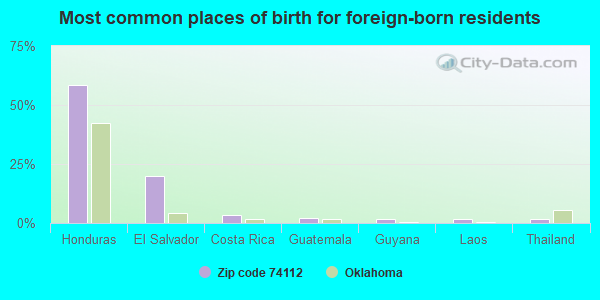
Foreign born population: 1,681 (7.7%) (35.6% of them are naturalized citizens)
Major facilities with environmental interests located in this zip code:
GREATER TULSA ACADEMY (7301 E 15TH ST in TULSA, OK)
(Integrated Compliance Information System) - ICIS-06-2001-0200, FORMAL ENFORCEMENT ACTION COMPLIANCE ACTIVITY (Tracking inspections of insecticide, fungicide, and rodenticide, and toxic substances) Business SIC classification: ELEMENTARY AND SECONDARY SCHOOLS
FARM & RANCH SUPPLY COMPANY (7890 E 11TH STREET in TULSA, OK)
(Integrated Compliance Information System) - ICIS-06-1988-0431, FORMAL ENFORCEMENT ACTION COMPLIANCE ACTIVITY (Tracking inspections of insecticide, fungicide, and rodenticide, and toxic substances) Business SIC classification: FARM SUPPLIES; HARDWARE STORES; RETAIL NURSERIES, LAWN AND GARDEN SUPPLY STORES
GRAPHIC ELECTRONICS INCORPORATED (1143 S. 71ST E. AVE. in TULSA, OK)
CRITERIA AND HAZARDOUS AIR POLLUTANT INVENTORY (Inventory of air pollution sources) STATE MASTER (Oklahoma environmental compliance activities data) HAZARDOUS WASTE BIENNIAL REPORTER (Resource Conservation and Recovery Act (tracking hazardous waste)) Large Quantity Generators, more that 1000 kg of hazardous waste/month (Resource Conservation and Recovery Act (tracking hazardous waste)) - notification TRI REPORTER (Tracking of toxic chemicals releasing facilities) Business SIC classification: PRINTED CIRCUIT BOARDS Business NAICS classification: TEXTILE MACHINERY MANUFACTURING.; BARE PRINTED CIRCUIT BOARD MANUFACTURING. Organizations: ARTHUR KNOCHE (CONTACT/OWNER)
DOVE SCIENCE ACADEMY (TULSA) (280 SOUTH MEMORIAL DRIVE in TULSA, OK)
(National Center for Education Statistics) - STATE ID-72-I001-971
ANCHOR PAINT MANUFACTURING COMPANY INCORPORATED (6707 E. 14TH ST. in TULSA, OK)
AIR SYNTHETIC MINOR (AIRS/AFS) CRITERIA AND HAZARDOUS AIR POLLUTANT INVENTORY (Inventory of air pollution sources) (Resource Conservation and Recovery Act (tracking hazardous waste)) TRI REPORTER (Tracking of toxic chemicals releasing facilities) Business SIC classification: PAINTS, VARNISHES, LACQUERS, ENAMELS, AND ALLIED PRODUCTS Business NAICS classification: PAINT AND COATING MANUFACTURING. Organizations: WANDA FOWLER (CONTACT/OWNER)
Alternative names: ANCHOR PAINT /6707 E 14TH ST PAINT
FARRIS EXPRESS FUELS, INC. #111 (5425 E 11TH ST in TULSA, OK)
(Integrated Compliance Information System) - ICIS-06-2001-0063, FORMAL ENFORCEMENT ACTION Business SIC classification: GASOLINE SERVICE STATIONS
CHEM-TRONICS INC (1550 N 105TH E AVE in TULSA, OK)
(Resource Conservation and Recovery Act (tracking hazardous waste)) Organizations: PUBLIC CORPORATION (CONTACT/OPERATOR)
, AUTOMATION TEQUNIQUES (CONTACT/OWNER)
Alternative names: AUTOMATION TECHNIQUES INC
FERGUSON GMC INC (4425 E 11ST in TULSA, OK)
(Resource Conservation and Recovery Act (tracking hazardous waste)) Organizations: FERGUSON JERRY (CONTACT/OPERATOR)
AUTO COLLISION CENTER INC (7711 E 11TH ST in TULSA, OK)
Conditionally Exempt Small Quantity Generators, less than 100 kg/month of hazardous waste (Resource Conservation and Recovery Act (tracking hazardous waste)) - notification Organizations: BILLY J DAULTON (CONTACT/OPERATOR)
, DAVID DOWELL (CONTACT/OPERATOR)
, GARY BILBY & BILLY J DAULTON (CONTACT/OWNER)
, GARY BILBY & JERRY HELM (CONTACT/OWNER)
Alternative names: ARROW FRAME & BODY SHOP
ACTION PLATING COMPANY (6947 E 13TH STREET in TULSA, OK)
(Resource Conservation and Recovery Act (tracking hazardous waste)) Organizations: DIVISION OF OIL ORIGINALS INC (CONTACT/OWNER)
AMERICAN TECHNICAL INSTITUTE (6707 E 12TH in TULSA, OK)
(Resource Conservation and Recovery Act (tracking hazardous waste)) Organizations: LEWIS C. LONG JR. (CONTACT/OWNER)
BRAKE REBUILDERS INC/FRICTION PRODUCTS (7605 E 11TH ST in TULSA, OK)
Small Quantity Generators, between 100 kg and 1000 kg of hazardous waste/month (Resource Conservation and Recovery Act (tracking hazardous waste)) Organizations: WILLIAM T ARRON (CONTACT/OPERATOR)
, AARON WILLIAM (CONTACT/OWNER)
, SHARRON L ARRON (CONTACT/OWNER)
Alternative names: BRAKE REBUILDER INC
C & A TRUCKING CO INC (1135 S FULTON in TULSA, OK)
(Resource Conservation and Recovery Act (tracking hazardous waste)) Organizations: SHAW D C (CONTACT/OWNER)
Housing units lacking complete plumbing facilities: 1.1% Housing units lacking complete kitchen facilities: 2.7%
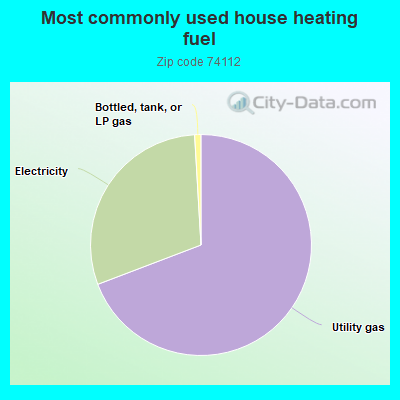
68.8%Utility gas
29.7%Electricity
0.9%Bottled, tank, or LP gas
Population in 1990: 21,754.
Place of birth for U.S.-born residents:
This state: 13,146
Northeast: 417
Midwest: 2,519
South: 2,229
West: 1,636
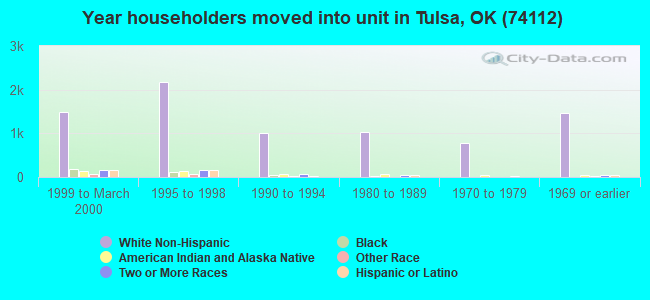
50% of the 74112 zip code residents lived in the same house 5 years ago. Out of people who lived in different houses, 70% lived in this county. Out of people who lived in different counties, 50% lived in Oklahoma.
83% of the 74112 zip code residents lived in the same house 1 year ago. Out of people who lived in different houses, 64% moved from this county. Out of people who lived in different houses, 11% moved from different county within same state. Out of people who lived in different houses, 17% moved from different state. Out of people who lived in different houses, 2% moved from abroad.
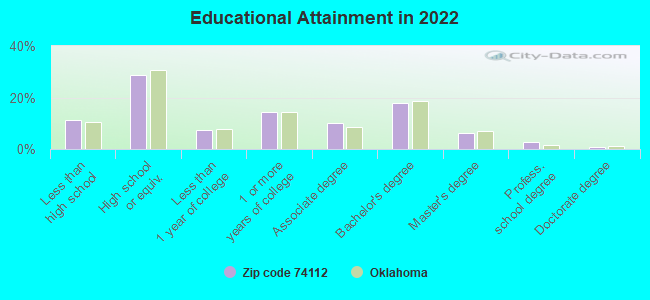
Private vs. public school enrollment:
Students in private schools in grades 1 to 8 (elementary and middle school): 346
Here:
17.0%
Oklahoma:
11.7%
Students in private schools in grades 9 to 12 (high school): 135
Here:
15.4%
Oklahoma:
11.7%
Students in private undergraduate colleges: 213
Here:
27.9%
Oklahoma:
19.3%
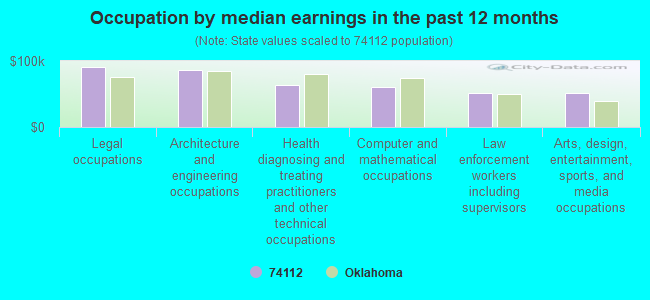
Occupation by median earnings in the past 12 months ($)
91,261Legal occupations
86,498Architecture and engineering occupations
63,200Health diagnosing and treating practitioners and other technical occupations
59,897Computer and mathematical occupations
52,056Law enforcement workers including supervisors
51,859Arts, design, entertainment, sports, and media occupations
Companies with biggest federal contracts located in this zip code (TULSA, OK):
OAI ELECTRONICS INC (6960 E 12TH ST; small business) : $4,090,423 in 98 contractsfrom 1999 to 2006
Contracts for Radio and Television Communication Equipment, Except Airborne, Miscellaneous Communication Equipment, Electrical and Electronic assemblies, Boards, Cards, and Associated Hardware, Antennas, Waveguides, and Related Equipment, and moreby Air Force, Defense Logistics Agency, Army Signed by year:2000: $925,874; 2001: $871,672; 2002: $265,065; 2003: $99,124; 2004: $506,074; 2005: $563,005; 2006: $788,808.
Biggest contracts:
$324,258 with Air Force for Radio and Television Communication Equipment, Except Airborne. Signed on 2000-04-10. Completion date: 2000-10-31.
$212,033 with Defense Logistics Agency for Miscellaneous Communication Equipment. Signed on 2006-05-05. Completion date: 2007-09-27.
$136,170, same as above.Signed on 2000-05-12. Completion date: 2000-09-09.
$113,816, same as above.Signed on 2006-05-15. Completion date: 2006-06-29.
SPI SECURITY INC (6902 E 14TH PL; small business) : $2,006,185 in 4 contractsfrom 2000 to 2002
$1,693,590 with Army for Guard Services. Signed on 2001-01-31. Completion date: 2004-01-31.
$1,693,590, same as above.Signed on 2000-02-03. Completion date: 2004-01-31.
$103,764, same as above.Signed on 2001-02-28. Completion date: 2004-01-31.
-$1,484,759, same as above.Signed on 2002-06-03. Completion date: 2004-01-31.
GRAYBAR ELECTRIC COMPANY, INC (6917 E 12TH ST) : $789,001 in 28 contractsfrom 2003 to 2006
Contracts for Miscellaneous Communication Equipment, Connectors, Electrical, ADP Components, Electrical and Electronic Properties Measuring and Testing Instruments, and moreby Army, Defense Logistics Agency, Navy Signed by year:2000: $0; 2001: $0; 2002: $0; 2003: $303,520; 2004: $271,530; 2005: $169,433; 2006: $44,518.
Biggest contracts:
$166,468 with Army for Miscellaneous Communication Equipment. Signed on 2003-04-09. Completion date: 2003-05-05.
$99,966 with Defense Logistics Agency for Connectors, Electrical. Signed on 2004-08-31. Completion date: 2005-02-08.
$89,452 with Navy for ADP Components. Signed on 2003-03-21. Completion date: 2003-03-21.
$78,570 with Defense Logistics Agency for Electrical and Electronic Properties Measuring and Testing Instruments. Signed on 2004-06-26. Completion date: 2004-07-16.
INTERSTATE BRANDS CORPORATION (1111 S SHERIDAN) : $585,987 in 7 contractsfrom 2004 to 2005
Contracts for Food Items For Resale, by Defense Commissary Agency, Bureau of Prisoners/Federal Prison System Signed by year:2000: $0; 2001: $0; 2002: $0; 2003: $0; 2004: $183,583; 2005: $402,404; 2006: $0.
Biggest contracts:
$180,712 with Defense Commissary Agency for Food Items For Resale. Signed on 2005-04-01. Completion date: 2005-08-31.
$142,645, same as above.Signed on 2004-10-01. Completion date: 2005-02-28.
$102,500, same as above.Signed on 2005-10-01. Completion date: 2005-12-31.
$67,956, same as above.Signed on 2005-01-01. Completion date: 2005-03-31.
PENNWELL CORPORATION (1421 S SHERIDAN RD) : $445,975 in 3 contractsfrom 2001 to 2005
$408,240 with Department of Defense for Maps, Atlases, Charts, and Globes. Signed on 2005-09-01. Completion date: 2005-09-30.
$34,000 with Department of Defense for ADP Central Processing Unit (CPU, Computer), Analog. Taking place in RI. Signed on 2001-07-26. Completion date: 2001-09-30.
$3,735 with EPA for Newspapers and Periodicals. Signed on 2004-12-02. Completion date: 2004-12-02.
GAFFEY, INC (6943 E 12TH ST; small business) : $374,064 in 14 contractsfrom 2000 to 2006
Contracts for Maintenance, Repair and Rebuilding of Equipment -- Materials Handling Equipment, Installation of Equipment -- Furniture, Winches, Hoists, Cranes, and Derricks, Blocks, Tackle, Rigging, and Slings, and moreby Air Force, Army Signed by year:2000: $62,118; 2001: $63,672; 2002: $123,080; 2003: $0; 2004: $73,296; 2005: $1,218; 2006: $50,680.
Biggest contracts:
$67,626 with Air Force for Maintenance, Repair and Rebuilding of Equipment -- Materials Handling Equipment. Signed on 2004-03-23. Completion date: 2005-04-30.
$64,650, same as above.Signed on 2002-03-13. Completion date: 2003-04-30.
$63,672, same as above.Signed on 2001-02-23. Completion date: 2002-04-30.
$62,118, same as above.Signed on 2000-04-19. Completion date: 2000-04-19.
AD ASSOCIATES, INC (1523-A S HARVARD; small business) : $191,648 in 10 contractsfrom 2001 to 2005
Contracts for Miscellaneous Items, Signs, Advertising Displays, and Identification Plates, Athletic and Sporting Equipment, Games, Toys and Wheeled Goods, and moreby U.S. Army Corps of Engineers - civil program financing only, Army Signed by year:2000: $0; 2001: $75,149; 2002: $61,781; 2003: $7,192; 2004: $5,306; 2005: $42,220; 2006: $0.
Biggest contracts:
$44,292 with U.S. Army Corps of Engineers - civil program financing only for Miscellaneous Items. Taking place in TX. Signed on 2001-05-23. Completion date: 2001-06-22.
$36,000 with U.S. Army Corps of Engineers - civil program financing only for Signs, Advertising Displays, and Identification Plates. Taking place in TX. Signed on 2002-05-01. Completion date: 2002-06-03.
$30,857 with U.S. Army Corps of Engineers - civil program financing only for Athletic and Sporting Equipment. Signed on 2001-07-12. Completion date: 2001-07-19.
$25,781, same as above.Signed on 2002-05-01. Completion date: 2002-06-28.
PENDERGRAPH, INC (6916 E 12TH ST; small business) : $182,177 in 3 contractsfrom 2003 to 2004
$136,427 with U.S. Army Corps of Engineers - civil program financing only for Fire Fighting Equipment. Signed on 2003-09-23. Completion date: 2003-10-23.
$42,211 with National Oceanic and Atmospheric Administration/Under Secretary for Oceans and Atmosphere for Miscellaneous Alarm, Signal and Security Detection Systems. Signed on 2003-11-19. Completion date: 2003-12-30.
$3,539 with Army for Facilities Operations Support Services. Taking place in AR. Signed on 2004-06-24. Completion date: 2004-05-25.
SUPERIOR LINEN SERVICE INC (6959 E 12TH ST; small business) : $157,252 in 86 contractsfrom 2000 to 2005
Contracts for Laundry and DryCleaning Services, Guard Services by Air Force, Army Signed by year:2000: $64,999; 2001: $70,319; 2002: $6,377; 2003: $5,071; 2004: $6,376; 2005: $4,110; 2006: $0.
Biggest contracts:
$65,000 with Air Force for Laundry and DryCleaning Services. Signed on 2001-11-08. Completion date: 2002-09-30.
$64,999, same as above.Signed on 2000-11-03. Completion date: 2001-09-30.
$4,110 with Army for Laundry and DryCleaning Services. Signed on 2005-09-30. Completion date: 2005-10-14.
$999, same as above.Signed on 2003-03-18. Completion date: 2003-09-30.
DELL-STAR TECHNOLOGIES, INC (6334 E 13TH ST; small business) : $132,056 in 7 contractsfrom 2000 to 2005
Contracts for Video Recording and Reproducing Equipment, Miscellaneous Communication Equipment, Radio and Television Communication Equipment, Except Airborne, Antennas, Waveguides, and Related Equipment by Air Force, Army, Navy, Minerals Management Service, and others Signed by year:2000: $32,135; 2001: $26,150; 2002: $6,500; 2003: $8,563; 2004: $0; 2005: $58,708; 2006: $0.
Biggest contracts:
$50,085 with Air Force for Video Recording and Reproducing Equipment. Signed on 2005-09-19. Completion date: 2005-10-31.
$32,135 with Army for Miscellaneous Communication Equipment. Taking place in MD. Signed on 2000-09-29. Completion date: 2000-10-02.
$26,150 with Navy for Miscellaneous Communication Equipment. Signed on 2001-07-09. Completion date: 2001-08-09.
$8,623 with Minerals Management Service for Radio and Television Communication Equipment, Except Airborne. Taking place in AL. Signed on 2005-05-23. Completion date: 2005-06-30.
Top industries in this zip code by the number of employees in 2005:
Information: Cable and Other Program Distribution (over 1000 employees: 1 establishment)
2002 - 2018 National Fire Incident Reporting System (NFIRS) incidents
According to the data from the years 2002 - 2018 the average number of fire incidents per year is 103. The highest number of fires - 140 took place in 2005, and the least - 77 in 2012. The data has a declining trend.
When looking into fire subcategories, the most reports belonged to: Outside Fires (39.4%), and Structure Fires (33.2%).
Fire incident types reported to NFIRS in Zip Code 74112


 Nearest zip codes: 74129, 74115, 74114, 74128, 74145, 74104.
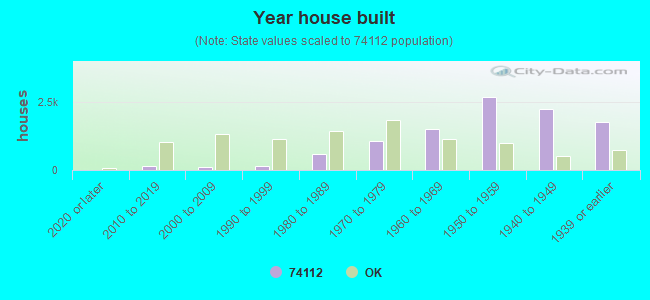


 According to the data from the years 2002 - 2018 the average number of fire incidents per year is 103. The highest number of fires - 140 took place in 2005, and the least - 77 in 2012. The data has a declining trend.
 When looking into fire subcategories, the most reports belonged to: Outside Fires (39.4%), and Structure Fires (33.2%).