Estimated zip code population in 2022: 12,672 Zip code population in 2010: 12,724 Zip code population in 2000: 14,050
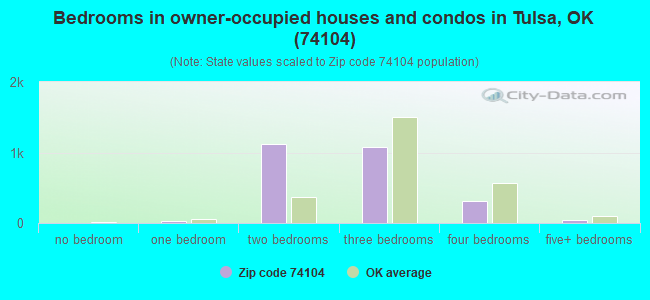
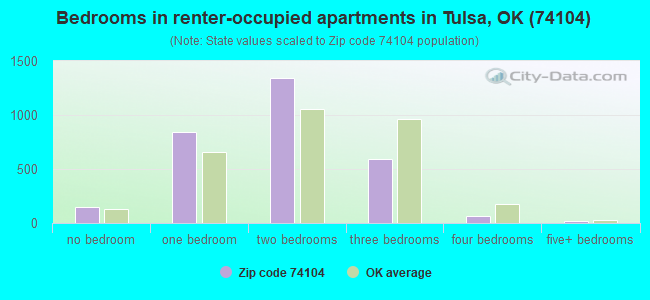
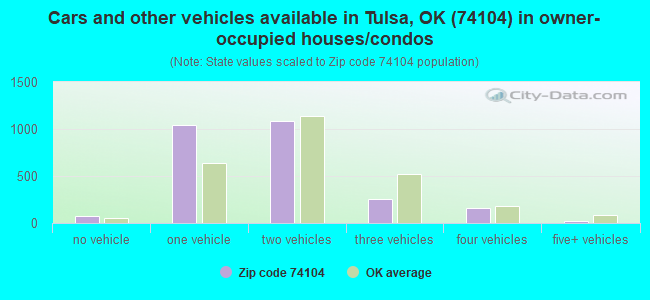
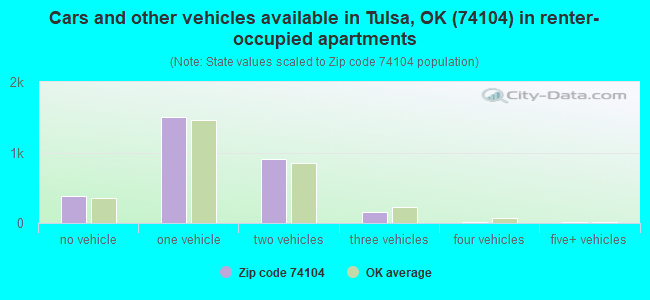
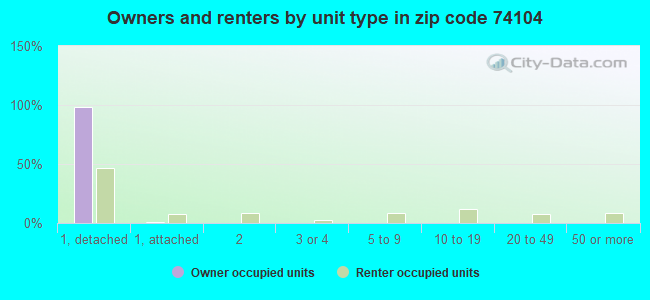
Houses and condos: 6,462 Renter-occupied apartments: 2,989
% of renters here:
53%
State:
35%
March 2022 cost of living index in zip code 74104: 88.7 (less than average, U.S. average is 100)
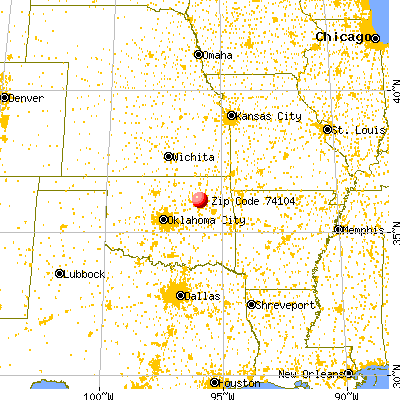
Land area: 2.7 sq. mi. Water area: 0.0 sq. mi.
Population density: 4,654 people per square mile
(average).
OSM Map
General Map
Google Map
MSN Map
OSM Map
General Map
Google Map
MSN Map
OSM Map
General Map
Google Map
MSN Map
OSM Map
General Map
Google Map
MSN Map
Please wait while loading the map...
Real estate property taxes paid for housing units in 2022:
This zip code:
0.9% ($2,155)
Oklahoma:
0.8% ($1,501)
Median real estate property taxes paid for housing units with mortgages in 2022: $2,501 (0.9%) Median real estate property taxes paid for housing units with no mortgage in 2022: $1,593 (0.8%)
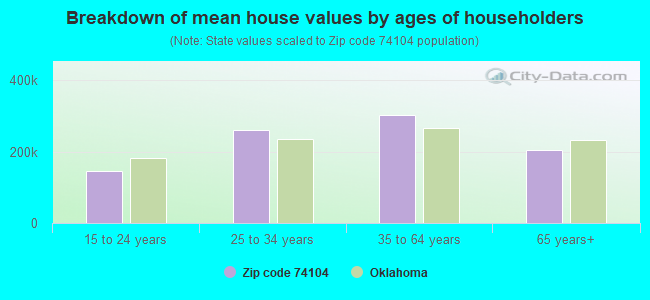
Estimated median house/condo value in 2022: $236,224
74104:
$236,224
Oklahoma:
$191,700
According to our research of Oklahoma and other state lists, there were 6 registered sex offenders living in 74104 zip code as of April 27, 2024. The ratio of all residents to sex offenders in zip code 74104 is 2,024 to 1. The ratio of registered sex offenders to all residents in this zip code is much lower than the state average.
Median resident age:
This zip code:
31.7 years
Oklahoma median age:
37.1 years
Average household size:
This zip code:
2.0 people
Oklahoma:
2.5 people
Averages for the 2020 tax year for zip code 74104, filed in 2021:
Average Adjusted Gross Income (AGI) in 2020: $70,925 (Individual Income Tax Returns)
Here:
$70,925
State:
$63,060
Salary/wage: $56,019 (reported on 84.5% of returns)
Here:
$56,019
State:
$52,427
(% of AGI for various income ranges: 1238.5% for AGIs below $25k, 3774.7% for AGIs $25k-50k, 7042.5% for AGIs $50k-75k, 11400.0% for AGIs $75k-100k, 18668.8% for AGIs $100k-200k, 69731.4% for AGIs over 200k)
Taxable interest for individuals: $1,501 (reported on 29.7% of returns)
This zip code:
$1,501
Oklahoma:
$1,603
(% of AGI for various income ranges: 12.0% for AGIs below $25k, 13.4% for AGIs $25k-50k, 31.6% for AGIs $50k-75k, 51.2% for AGIs $75k-100k, 131.5% for AGIs $100k-200k, 1634.3% for AGIs over 200k)
Ordinary dividends: $11,376 (reported on 19.4% of returns)
Here:
$11,376
State:
$7,001
(% of AGI for various income ranges: 27.2% for AGIs below $25k, 39.3% for AGIs $25k-50k, 64.7% for AGIs $50k-75k, 139.2% for AGIs $75k-100k, 490.0% for AGIs $100k-200k, 10890.0% for AGIs over 200k)
Net capital gain/loss in AGI: +$40,904 (reported on 18.6% of returns)
Here:
+$40,904
State:
+$19,855
(% of AGI for various income ranges: 14.1% for AGIs below $25k, 30.3% for AGIs $25k-50k, 81.6% for AGIs $50k-75k, 305.8% for AGIs $75k-100k, 718.5% for AGIs $100k-200k, 46764.3% for AGIs over 200k)
Profit/loss from business: +$12,398 (reported on 19.6% of returns)
Here:
+$12,398
State:
+$9,904
(% of AGI for various income ranges: 139.4% for AGIs below $25k, 206.7% for AGIs $25k-50k, 227.6% for AGIs $50k-75k, 625.8% for AGIs $75k-100k, 476.2% for AGIs $100k-200k, 5217.1% for AGIs over 200k)
Taxable individual retirement arrangement distribution: $19,259 (reported on 7.0% of returns)
74104:
$19,259
Oklahoma:
$20,476
(% of AGI for various income ranges: 58.5% for AGIs below $25k, 77.1% for AGIs $25k-50k, 188.4% for AGIs $50k-75k, 380.0% for AGIs $75k-100k, 600.3% for AGIs $100k-200k, 1601.4% for AGIs over 200k)
Total itemized deductions: $40,400 (reported on 7.6% of returns)
Here:
$40,400
State:
$39,736
(% of AGI for various income ranges: 106.8% for AGIs $25k-50k, 192.9% for AGIs $50k-75k, 530.4% for AGIs $75k-100k, 1005.6% for AGIs $100k-200k, 11674.3% for AGIs over 200k)
Charity contributions: $22,520 (reported on 6.2% of returns)
Here:
$22,520
State:
$17,288
(% of AGI for various income ranges: 12.2% for AGIs below $25k, 27.5% for AGIs $50k-75k, 123.3% for AGIs $75k-100k, 303.5% for AGIs $100k-200k, 7340.0% for AGIs over 200k)
Taxes paid: $7,319 (reported on 7.6% of returns)
74104:
$7,319
State:
$7,046
(% of AGI for various income ranges: 13.5% for AGIs $25k-50k, 45.7% for AGIs $50k-75k, 147.1% for AGIs $75k-100k, 303.2% for AGIs $100k-200k, 1360.0% for AGIs over 200k)
Earned income credit: $1,970 (reported on 15.3% of returns)
Here:
$1,970
State:
$2,435
(% of AGI for various income ranges: 81.9% for AGIs below $25k, 43.8% for AGIs $25k-50k)
Percentage of individuals using paid preparers for their 2020 taxes: 93.2%
Here:
93%
State:
94%
(% for various income ranges: 92.0% for AGIs below $25k, 93.8% for AGIs $25k-50k, 93.1% for AGIs $50k-75k, 95.0% for AGIs $75k-100k, 93.3% for AGIs $100k-200k, 95.2% for AGIs over 200k)
Averages for the 2012 tax year for zip code 74104, filed in 2013:
Average Adjusted Gross Income (AGI) in 2012: $59,159 (Individual Income Tax Returns)
Here:
$59,159
State:
$58,581
Salary/wage: $45,020 (reported on 87.6% of returns)
Here:
$45,020
State:
$45,973
(% of AGI for various income ranges: 79.1% for AGIs below $25k, 86.2% for AGIs $25k-50k, 84.9% for AGIs $50k-75k, 84.6% for AGIs $75k-100k, 80.3% for AGIs $100k-200k, 30.8% for AGIs over 200k)
Taxable interest for individuals: $3,872 (reported on 30.9% of returns)
This zip code:
$3,872
Oklahoma:
$1,625
(% of AGI for various income ranges: 0.8% for AGIs below $25k, 0.5% for AGIs $25k-50k, 0.5% for AGIs $50k-75k, 0.4% for AGIs $75k-100k, 0.4% for AGIs $100k-200k, 5.3% for AGIs over 200k)
Ordinary dividends: $13,357 (reported on 17.2% of returns)
Here:
$13,357
State:
$6,374
(% of AGI for various income ranges: 1.3% for AGIs below $25k, 0.9% for AGIs $25k-50k, 1.0% for AGIs $50k-75k, 1.2% for AGIs $75k-100k, 1.7% for AGIs $100k-200k, 9.6% for AGIs over 200k)
Net capital gain/loss in AGI: +$51,164 (reported on 13.3% of returns)
Here:
+$51,164
State:
+$24,023
(% of AGI for various income ranges: 0.8% for AGIs $25k-50k, 0.7% for AGIs $50k-75k, 1.1% for AGIs $75k-100k, 1.4% for AGIs $100k-200k, 34.3% for AGIs over 200k)
Profit/loss from business: +$12,565 (reported on 18.3% of returns)
Here:
+$12,565
State:
+$11,913
(% of AGI for various income ranges: 9.8% for AGIs below $25k, 3.0% for AGIs $25k-50k, 3.9% for AGIs $50k-75k, 2.6% for AGIs $75k-100k, 3.1% for AGIs $100k-200k, 3.6% for AGIs over 200k)
Taxable individual retirement arrangement distribution: $13,226 (reported on 6.4% of returns)
74104:
$13,226
Oklahoma:
$15,242
(% of AGI for various income ranges: 2.3% for AGIs below $25k, 1.3% for AGIs $25k-50k, 1.5% for AGIs $50k-75k, 1.6% for AGIs $75k-100k, 3.5% for AGIs $100k-200k)
Self-employment retirement plans: $19,000 (reported on 0.4% of returns)
74104:
$19,000
Oklahoma:
$20,266
Total itemized deductions: $26,031 (19% of AGI, reported on 26.3% of returns)
Here:
$26,031
State:
$24,882
Here:
18.9% of AGI
State:
18.8% of AGI
(% of AGI for various income ranges: 5.8% for AGIs below $25k, 7.1% for AGIs $25k-50k, 10.7% for AGIs $50k-75k, 11.2% for AGIs $75k-100k, 12.5% for AGIs $100k-200k, 15.6% for AGIs over 200k)
Charity contributions: $8,423 (reported on 21.6% of returns)
Here:
$8,423
State:
$6,591
(% of AGI for various income ranges: 0.4% for AGIs below $25k, 1.0% for AGIs $25k-50k, 1.5% for AGIs $50k-75k, 1.5% for AGIs $75k-100k, 2.3% for AGIs $100k-200k, 6.6% for AGIs over 200k)
Taxes paid: $7,615 (reported on 26.3% of returns)
74104:
$7,615
State:
$7,196
(% of AGI for various income ranges: 0.9% for AGIs below $25k, 1.6% for AGIs $25k-50k, 3.1% for AGIs $50k-75k, 3.7% for AGIs $75k-100k, 5.0% for AGIs $100k-200k, 4.1% for AGIs over 200k)
Earned income credit: $2,003 (reported on 18.0% of returns)
Here:
$2,003
State:
$2,354
(% of AGI for various income ranges: 5.6% for AGIs below $25k, 0.7% for AGIs $25k-50k)
Percentage of individuals using paid preparers for their 2012 taxes: 46.3%
Here:
46%
State:
56%
(% for various income ranges: 44.7% for AGIs below $25k, 43.5% for AGIs $25k-50k, 46.9% for AGIs $50k-75k, 48.6% for AGIs $75k-100k, 51.3% for AGIs $100k-200k, 75.0% for AGIs over 200k)
Averages for the 2004 tax year for zip code 74104, filed in 2005:
Average Adjusted Gross Income (AGI) in 2004: $43,156 (Individual Income Tax Returns)
Here:
$43,156
State:
$41,245
Salary/wage: $35,289 (reported on 86.9% of returns)
Here:
$35,289
State:
$35,318
(% of AGI for various income ranges: 105.4% for AGIs below $10k, 83.3% for AGIs $10k-25k, 86.6% for AGIs $25k-50k, 84.9% for AGIs $50k-75k, 82.1% for AGIs $75k-100k, 45.6% for AGIs over 100k)
Taxable interest for individuals: $2,324 (reported on 38.9% of returns)
This zip code:
$2,324
Oklahoma:
$1,745
(% of AGI for various income ranges: 4.4% for AGIs below $10k, 1.6% for AGIs $10k-25k, 1.1% for AGIs $25k-50k, 1.5% for AGIs $50k-75k, 1.3% for AGIs $75k-100k, 3.3% for AGIs over 100k)
Taxable dividends: $4,085 (reported on 19.0% of returns)
Here:
$4,085
State:
$2,920
(% of AGI for various income ranges: 3.2% for AGIs below $10k, 1.1% for AGIs $10k-25k, 1.0% for AGIs $25k-50k, 0.9% for AGIs $50k-75k, 1.4% for AGIs $75k-100k, 3.0% for AGIs over 100k)
Net capital gain/loss: +$21,510 (reported on 15.5% of returns)
Here:
+$21,510
State:
+$10,653
(% of AGI for various income ranges: -2.1% for AGIs below $10k, -0.2% for AGIs $10k-25k, 0.4% for AGIs $25k-50k, 0.8% for AGIs $50k-75k, 1.7% for AGIs $75k-100k, 20.5% for AGIs over 100k)
Profit/loss from business: +$11,874 (reported on 16.8% of returns)
Here:
+$11,874
State:
+$8,532
(% of AGI for various income ranges: 11.2% for AGIs below $10k, 6.5% for AGIs $10k-25k, 2.2% for AGIs $25k-50k, 3.4% for AGIs $50k-75k, 2.4% for AGIs $75k-100k, 6.6% for AGIs over 100k)
IRA payment deduction: $2,922 (reported on 1.9% of returns)
74104:
$2,922
Oklahoma:
$3,127
(% of AGI for various income ranges: 0.1% for AGIs $10k-25k, 0.2% for AGIs $25k-50k, 0.2% for AGIs $50k-75k, 0.2% for AGIs $75k-100k)
Self-employed pension: $15,700 (reported on 0.6% of returns)
Here:
$15,700
Oklahoma:
$14,276
Total itemized deductions: $16,321 (20% of AGI, reported on 35.4% of returns)
Here:
$16,321
State:
$17,093
Here:
19.9% of AGI
State:
20.5% of AGI
(% of AGI for various income ranges: 16.1% for AGIs below $10k, 8.4% for AGIs $10k-25k, 11.4% for AGIs $25k-50k, 15.6% for AGIs $50k-75k, 16.1% for AGIs $75k-100k, 14.3% for AGIs over 100k)
Charity contributions deductions: $3,755 (4% of AGI, reported on 28.5% of returns)
Here:
$3,755
State:
$4,240
Here:
4.1% of AGI
State:
4.8% of AGI
(% of AGI for various income ranges: 0.8% for AGIs below $10k, 0.9% for AGIs $10k-25k, 1.5% for AGIs $25k-50k, 2.5% for AGIs $50k-75k, 2.3% for AGIs $75k-100k, 3.7% for AGIs over 100k)
Total tax: $7,298 (reported on 73.4% of returns)
74104:
$7,298
State:
$6,542
(% of AGI for various income ranges: 2.5% for AGIs below $10k, 4.4% for AGIs $10k-25k, 7.8% for AGIs $25k-50k, 10.6% for AGIs $50k-75k, 11.9% for AGIs $75k-100k, 19.4% for AGIs over 100k)
Earned income credit: $1,554 (reported on 17.4% of returns)
Here:
$1,554
State:
$1,830
Percentage of individuals using paid preparers for their 2004 taxes: 53.6%
Here:
54%
State:
63%
(% for various income ranges: 47.0% for AGIs below $10k, 57.0% for AGIs $10k-25k, 53.4% for AGIs $25k-50k, 50.7% for AGIs $50k-75k, 55.8% for AGIs $75k-100k, 64.4% for AGIs over 100k)
Likely homosexual households (counted as self-reported same-sex unmarried-partner households)
Lesbian couples: 0.4% of all households
Gay men: 0.3% of all households
Household received Food Stamps/SNAP in the past 12 months: 683 Household did not receive Food Stamps/SNAP in the past 12 months: 4,884
Women who had a birth in the past 12 months: 134 (98 now married, 36 unmarried) Women who did not have a birth in the past 12 months: 3,913 (1,102 now married, 2,811 unmarried)
Housing units in zip code 74104 with a mortgage: 1,559 (66 second mortgage, 7 home equity loan, 33 both second mortgage and home equity loan) Houses without a mortgage: 49
Median monthly owner costs for units with a mortgage: $1,465 Median monthly owner costs for units without a mortgage: $543
Residents with income below the poverty level in 2022:
This zip code:
26.4%
Whole state:
15.7%
Residents with income below 50% of the poverty level in 2022:
This zip code:
12.7%
Whole state:
8.3%
Median number of rooms in houses and condos:
Here:
6.1
State:
6.1
Median number of rooms in apartments:
Here:
4.5
State:
4.5
Notable locations in this zip code not listed on our city pages
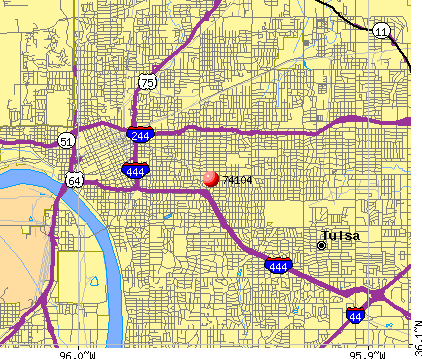
Notable locations in zip code 74104: Tulsa Fire Department Station 7 (A), Continuous Care Centers of Oklahoma in Tulsa (B). Display/hide their locations on the map
Churches in zip code 74104 include: Hispanic Christian Center (A), Holy Ghost Biblecostal Church (B), Wesley Foundation Tulsa University Student Center (C), University United Methodist Church (D), Tulsa Baptist Temple (E), Saint Francis-Guadalupe Church (F), Saint Anthonys Orthodox Christian Church (G), Immanuel Baptist Church (H), Iranian Christian-Central United States Church (I). Display/hide their locations on the map
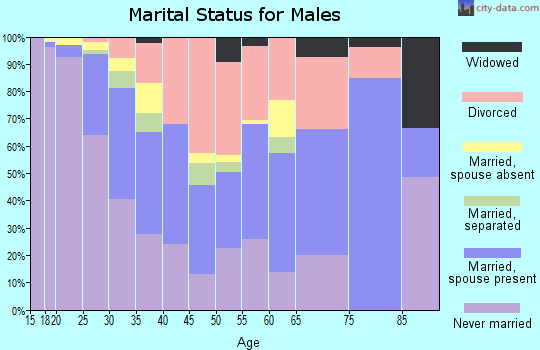
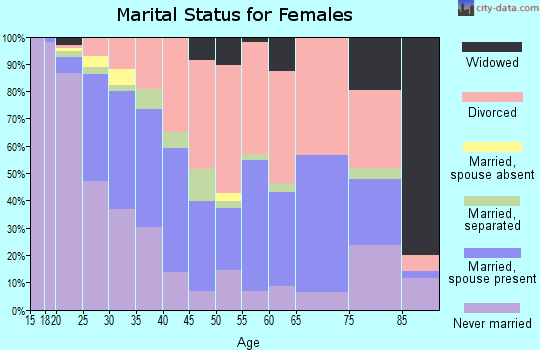
1,270 married couples with children.
466 single-parent households (127 men, 339 women).
83.8% of residents of 74104 zip code speak English at home.
10.4% of residents speak Spanish at home (62% very well, 10% well, 11% not well, 17% not at all).
1.8% of residents speak other Indo-European language at home (60% very well, 29% well, 4% not well, 7% not at all).
1.8% of residents speak Asian or Pacific Island language at home (66% very well, 17% well, 17% not well).
2.3% of residents speak other language at home (80% very well, 9% well, 11% not well).
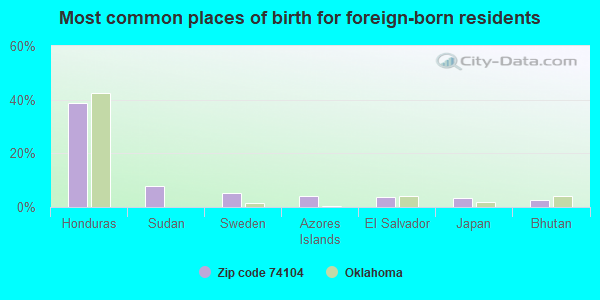
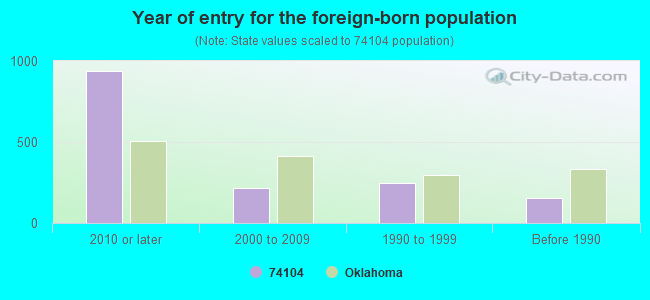
Foreign born population: 1,269 (10.0%) (12.4% of them are naturalized citizens)
Major facilities with environmental interests located in this zip code:
BAMA COMPANIES INCORPORATED (2727 E. 11TH STREET in TULSA, OK)
AIR MINOR (AIRS/AFS) (Integrated Compliance Information System) - ICIS-06-1995-0409, FORMAL ENFORCEMENT ACTION TRI REPORTER (Tracking of toxic chemicals releasing facilities) Business SIC classification: BREAD AND OTHER BAKERY PRODUCTS, EXCEPT COOKIES AND CRACKERS; FROZEN BAKERY PRODUCTS, EXCEPT BREAD Alternative names: BAMA COS. INC.
BARNARD ES (2324 EAST 17TH STREET in TULSA, OK)
(National Center for Education Statistics) - STATE ID-72-I001-115 Organizations: TULSA (SCHOOL DISTRICT)
FARRIS EXPRESS FUELS, INC. #115 (223 S UTICA in TULSA, OK)
(Integrated Compliance Information System) - ICIS-06-2001-0064, FORMAL ENFORCEMENT ACTION Business SIC classification: GASOLINE SERVICE STATIONS
CARTERS CLEANERS (2823 EAST 11TH STREET in TULSA, OK)
AIR MINOR (AIRS/AFS) Conditionally Exempt Small Quantity Generators, less than 100 kg/month of hazardous waste (Resource Conservation and Recovery Act (tracking hazardous waste)) - notification Business SIC classification: DRYCLEANING PLANTS, EXCEPT RUG CLEANING Organizations: THOMAS GARY JAMES (CONTACT/OWNER)
Alternative names: CARTERS DRIVE IN C 2823 E 11TH SAINT
AAMCO TRANSMISSIONS (1717 E 11TH in TULSA, OK)
(Resource Conservation and Recovery Act (tracking hazardous waste)) Organizations: ROGER STITCH (CONTACT/OWNER)
BOB HOWARDS DOWNTOWN DODGE (2111 E 11TH STREET in TULSA, OK)
Small Quantity Generators, between 100 kg and 1000 kg of hazardous waste/month (Resource Conservation and Recovery Act (tracking hazardous waste)) Organizations: MIKE QUINN DODGE INC (CONTACT/OWNER)
, BOB HOWARDS DODGE (CONTACT/OWNER)
Alternative names: MIKE QUINN DODGE
BRAD NOE BODY SHOP (2626 E 11TH ST in TULSA, OK)
(Resource Conservation and Recovery Act (tracking hazardous waste))
BUHL CLEANERS (2002 E 11TH ST in TULSA, OK)
(Resource Conservation and Recovery Act (tracking hazardous waste)) Organizations: PAUL BUHL (CONTACT/OWNER)
CHEROKEE PROCESS COLOR INC (1715 E 2ND ST in TULSA, OK)
(Resource Conservation and Recovery Act (tracking hazardous waste)) Business NAICS classification: MILITARY ARMORED VEHICLE, TANK, AND TANK COMPONENT MANUFACTURING. Organizations: UNKNOWN (CONTACT/OWNER)
COX MOTOR CO. (2233 E 11TH in TULSA, OK)
(Resource Conservation and Recovery Act (tracking hazardous waste)) Organizations: RAY COX (CONTACT/OWNER)
DANIELS BODY SHOP INC (1730 E 6TH in TULSA, OK)
(Resource Conservation and Recovery Act (tracking hazardous waste)) Organizations: DANIELS TOM (CONTACT/OWNER)
ESLICK & MILLSPAUGH GRAPHICS INC (1124 S LEWIS AVE in TULSA, OK)
(Resource Conservation and Recovery Act (tracking hazardous waste))
Housing units lacking complete plumbing facilities: 2.5% Housing units lacking complete kitchen facilities: 3.5%
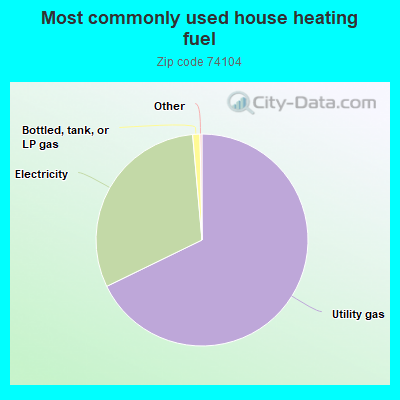
67.8%Utility gas
30.8%Electricity
1.1%Bottled, tank, or LP gas
Population in 1990: 13,247. Population change in the 1990s: +803 (+6.1%).
Place of birth for U.S.-born residents:
This state: 6,481
Northeast: 368
Midwest: 1,286
South: 1,846
West: 1,227
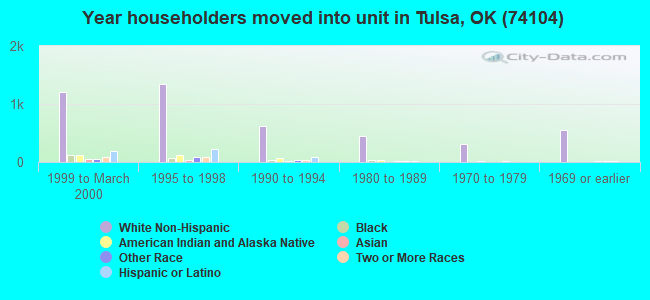
39% of the 74104 zip code residents lived in the same house 5 years ago. Out of people who lived in different houses, 54% lived in this county. Out of people who lived in different counties, 50% lived in Oklahoma.
85% of the 74104 zip code residents lived in the same house 1 year ago. Out of people who lived in different houses, 60% moved from this county. Out of people who lived in different houses, 10% moved from different county within same state. Out of people who lived in different houses, 18% moved from different state. Out of people who lived in different houses, 7% moved from abroad.
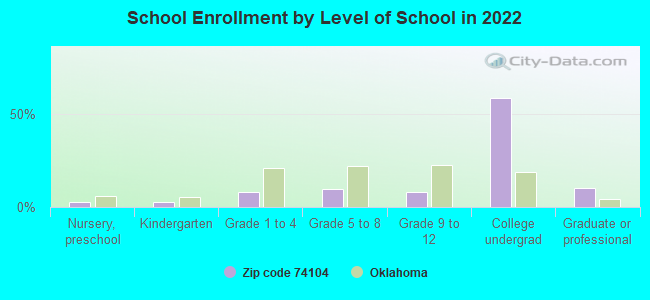
Private vs. public school enrollment:
Students in private schools in grades 1 to 8 (elementary and middle school): 160
Here:
21.4%
Oklahoma:
11.7%
Students in private schools in grades 9 to 12 (high school): 66
Here:
19.7%
Oklahoma:
11.7%
Students in private undergraduate colleges: 2,210
Here:
79.6%
Oklahoma:
19.3%
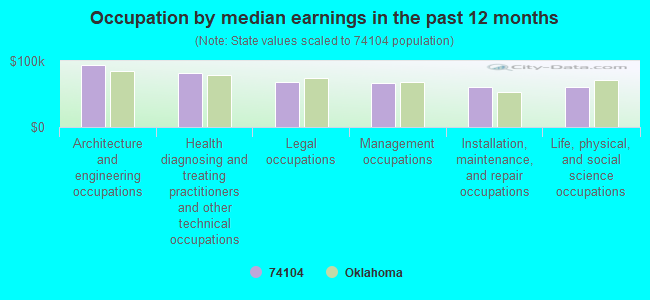
Occupation by median earnings in the past 12 months ($)
93,205Architecture and engineering occupations
81,627Health diagnosing and treating practitioners and other technical occupations
67,848Legal occupations
66,440Management occupations
59,899Installation, maintenance, and repair occupations
59,872Life, physical, and social science occupations
Companies with federal contracts located in this zip code (TULSA, OK):
ALLIED BEARINGS SUPPLY COMPANY (416 S UTICA AVE; small business)
$49,242 with U.S. Army Corps of Engineers - civil program financing only for Pipe, Tube and Rigid Tubing. Taking place in AR. Signed on 2003-09-22. Completion date: 2003-07-14.
TULSA GAMMA RAY INC (1127 S LEWIS AVE; small business)
$25,460 with Air Force for Maintenance, Repair or Alteration of Real Property -- Heating and Cooling Plants. Signed on 2002-05-10. Completion date: 2002-08-09.
FLEGLER INVESTMENT COMPANY (2021 S LEWIS STE 400; small business)
$4,794 with Army for Air Conditioning Equipment. Signed on 2004-08-31. Completion date: 2004-09-30.
EVERY LITTLE BIT INC (1408 S HARBOR AVE; small business)
$4,595 with Army for Medical and Surgical Instruments, Equipment, and Supplies. Signed on 2003-11-21. Completion date: 2003-11-25.
QUALITY MATERIAL HANDLING CO (1737 E 7TH ST; small business)
$4,590 with Army for Collective Modular Support System. Signed on 2002-02-05. Completion date: 2002-02-14.
Top industries in this zip code by the number of employees in 2005:
Health Care and Social Assistance: Offices of Physicians (except Mental Health Specialists) (250-499 employees: 1 establishment, 100-249 employees: 2 establishments, 50-99 employees: 6 establishments, 20-49 employees: 16 establishments, 10-19 employees: 15 establishments, 5-9 employees: 21 establishments, 1-4 employees: 64 establishments)
Health Care and Social Assistance: General Medical and Surgical Hospitals (over 1000: 1, 100-249: 1)
Educational Services: Colleges, Universities, and Professional Schools (over 1000: 1, 50-99: 1, 1-4: 1)
2002 - 2018 National Fire Incident Reporting System (NFIRS) incidents
Based on the data from the years 2002 - 2018 the average number of fire incidents per year is 64. The highest number of reported fire incidents - 96 took place in 2003, and the least - 41 in 2012. The data has a dropping trend.
When looking into fire subcategories, the most incidents belonged to: Outside Fires (37.8%), and Structure Fires (37.3%).
Fire incident types reported to NFIRS in Zip Code 74104


 Nearest zip codes: 74114, 74120, 74119, 74103, 74110, 74105.


 Based on the data from the years 2002 - 2018 the average number of fire incidents per year is 64. The highest number of reported fire incidents - 96 took place in 2003, and the least - 41 in 2012. The data has a dropping trend.
 When looking into fire subcategories, the most incidents belonged to: Outside Fires (37.8%), and Structure Fires (37.3%).