Estimated zip code population in 2022: 3,446 Zip code population in 2010: 3,561 Zip code population in 2000: 3,790
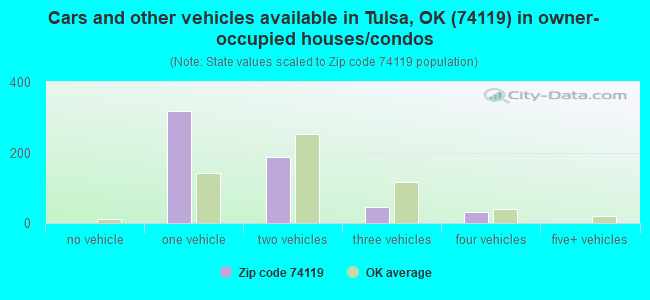
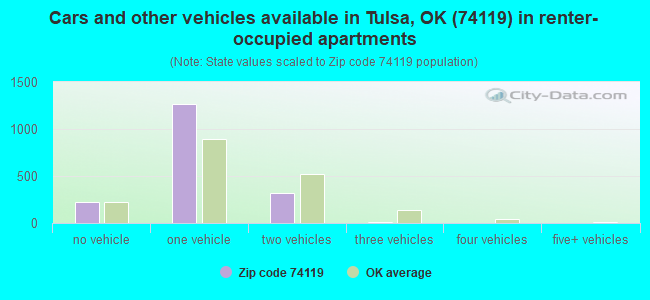
Houses and condos: 3,169 Renter-occupied apartments: 1,800
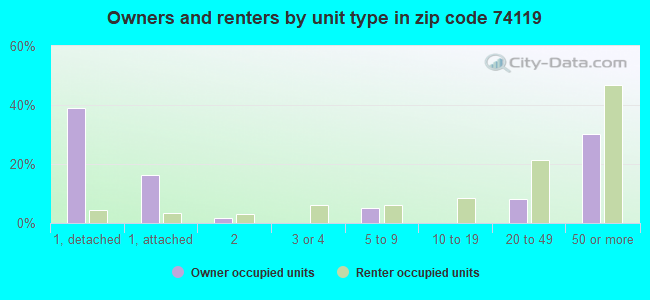
% of renters here:
76%
State:
35%
March 2022 cost of living index in zip code 74119: 88.4 (less than average, U.S. average is 100)
Land area: 0.8 sq. mi. Water area: 0.0 sq. mi.
Population density: 4,381 people per square mile
(average).
OSM Map
General Map
Google Map
MSN Map
OSM Map
General Map
Google Map
MSN Map
OSM Map
General Map
Google Map
MSN Map
OSM Map
General Map
Google Map
MSN Map
Please wait while loading the map...
Real estate property taxes paid for housing units in 2022:
This zip code:
0.9% ($2,220)
Oklahoma:
0.8% ($1,501)
Median real estate property taxes paid for housing units with mortgages in 2022: $2,337 (0.8%) Median real estate property taxes paid for housing units with no mortgage in 2022: $2,072 (1.0%)
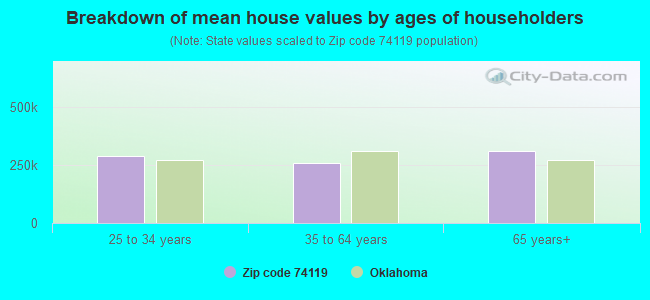
Estimated median house/condo value in 2022: $236,674
74119:
$236,674
Oklahoma:
$191,700
According to our research of Oklahoma and other state lists, there were 3 registered sex offenders living in 74119 zip code as of April 27, 2024. The ratio of all residents to sex offenders in zip code 74119 is 1,138 to 1. The ratio of registered sex offenders to all residents in this zip code is lower than the state average.
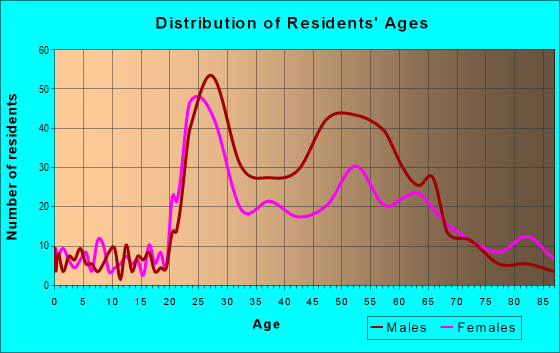
Median resident age:
This zip code:
40.6 years
Oklahoma median age:
37.1 years
Average household size:
This zip code:
1.4 people
Oklahoma:
2.5 people
Averages for the 2020 tax year for zip code 74119, filed in 2021:
Average Adjusted Gross Income (AGI) in 2020: $101,964 (Individual Income Tax Returns)
Here:
$101,964
State:
$63,060
Salary/wage: $63,073 (reported on 82.1% of returns)
Here:
$63,073
State:
$52,427
(% of AGI for various income ranges: 1100.5% for AGIs below $25k, 3895.8% for AGIs $25k-50k, 7240.5% for AGIs $50k-75k, 11920.9% for AGIs $75k-100k, 19218.2% for AGIs $100k-200k, 108326.7% for AGIs over 200k)
Taxable interest for individuals: $6,849 (reported on 31.1% of returns)
This zip code:
$6,849
Oklahoma:
$1,603
(% of AGI for various income ranges: 12.1% for AGIs below $25k, 33.5% for AGIs $25k-50k, 32.0% for AGIs $50k-75k, 73.6% for AGIs $75k-100k, 250.9% for AGIs $100k-200k, 11903.3% for AGIs over 200k)
Ordinary dividends: $22,321 (reported on 24.0% of returns)
Here:
$22,321
State:
$7,001
(% of AGI for various income ranges: 35.3% for AGIs below $25k, 120.5% for AGIs $25k-50k, 123.5% for AGIs $50k-75k, 284.5% for AGIs $75k-100k, 770.9% for AGIs $100k-200k, 28163.3% for AGIs over 200k)
Net capital gain/loss in AGI: +$50,430 (reported on 24.0% of returns)
Here:
+$50,430
State:
+$19,855
(% of AGI for various income ranges: 24.4% for AGIs below $25k, 80.8% for AGIs $25k-50k, 88.0% for AGIs $50k-75k, 430.0% for AGIs $75k-100k, 1036.4% for AGIs $100k-200k, 71616.7% for AGIs over 200k)
Profit/loss from business: +$16,657 (reported on 18.9% of returns)
Here:
+$16,657
State:
+$9,904
(% of AGI for various income ranges: 138.6% for AGIs below $25k, 158.0% for AGIs $25k-50k, 434.5% for AGIs $50k-75k, 115.5% for AGIs $75k-100k, 964.5% for AGIs $100k-200k, 9593.3% for AGIs over 200k)
Taxable individual retirement arrangement distribution: $24,867 (reported on 7.7% of returns)
74119:
$24,867
Oklahoma:
$20,476
(% of AGI for various income ranges: 47.7% for AGIs below $25k, 129.8% for AGIs $25k-50k, 427.3% for AGIs $75k-100k, 1296.4% for AGIs $100k-200k, 3700.0% for AGIs over 200k)
Total itemized deductions: $75,761 (reported on 9.2% of returns)
Here:
$75,761
State:
$39,736
(% of AGI for various income ranges: 142.8% for AGIs $25k-50k, 317.0% for AGIs $50k-75k, 1600.0% for AGIs $100k-200k, 35573.3% for AGIs over 200k)
Charity contributions: $41,547 (reported on 8.7% of returns)
Here:
$41,547
State:
$17,288
(% of AGI for various income ranges: 156.0% for AGIs $50k-75k, 409.1% for AGIs $100k-200k, 21003.3% for AGIs over 200k)
Taxes paid: $9,050 (reported on 9.2% of returns)
74119:
$9,050
State:
$7,046
(% of AGI for various income ranges: 29.8% for AGIs $25k-50k, 87.0% for AGIs $50k-75k, 444.5% for AGIs $100k-200k, 2823.3% for AGIs over 200k)
Earned income credit: $1,100 (reported on 10.2% of returns)
Here:
$1,100
State:
$2,435
(% of AGI for various income ranges: 39.5% for AGIs below $25k, 12.5% for AGIs $25k-50k)
Percentage of individuals using paid preparers for their 2020 taxes: 91.3%
Here:
91%
State:
94%
(% for various income ranges: 91.5% for AGIs below $25k, 90.9% for AGIs $25k-50k, 89.7% for AGIs $50k-75k, 94.7% for AGIs $75k-100k, 95.5% for AGIs $100k-200k, 83.3% for AGIs over 200k)
Averages for the 2012 tax year for zip code 74119, filed in 2013:
Average Adjusted Gross Income (AGI) in 2012: $221,844 (Individual Income Tax Returns)
Here:
$221,844
State:
$58,581
Salary/wage: $55,962 (reported on 81.7% of returns)
Here:
$55,962
State:
$45,973
(% of AGI for various income ranges: 77.4% for AGIs below $25k, 85.2% for AGIs $25k-50k, 76.1% for AGIs $50k-75k, 73.8% for AGIs $75k-100k, 65.9% for AGIs $100k-200k, 8.4% for AGIs over 200k)
Taxable interest for individuals: $10,418 (reported on 35.5% of returns)
This zip code:
$10,418
Oklahoma:
$1,625
(% of AGI for various income ranges: 1.3% for AGIs below $25k, 1.0% for AGIs $25k-50k, 1.3% for AGIs $50k-75k, 1.1% for AGIs $75k-100k, 2.0% for AGIs $100k-200k, 1.7% for AGIs over 200k)
Ordinary dividends: $38,666 (reported on 23.7% of returns)
Here:
$38,666
State:
$6,374
(% of AGI for various income ranges: 2.6% for AGIs below $25k, 1.5% for AGIs $25k-50k, 1.0% for AGIs $50k-75k, 4.6% for AGIs $75k-100k, 3.1% for AGIs $100k-200k, 4.5% for AGIs over 200k)
Net capital gain/loss in AGI: +$280,425 (reported on 21.5% of returns)
Here:
+$280,425
State:
+$24,023
(% of AGI for various income ranges: 0.4% for AGIs $25k-50k, 1.7% for AGIs $50k-75k, 3.2% for AGIs $75k-100k, 2.3% for AGIs $100k-200k, 32.9% for AGIs over 200k)
Profit/loss from business: +$35,509 (reported on 18.8% of returns)
Here:
+$35,509
State:
+$11,913
(% of AGI for various income ranges: 7.4% for AGIs below $25k, 3.3% for AGIs $25k-50k, 1.7% for AGIs $50k-75k, 3.7% for AGIs $75k-100k, 7.7% for AGIs $100k-200k, 2.6% for AGIs over 200k)
Taxable individual retirement arrangement distribution: $24,726 (reported on 10.2% of returns)
74119:
$24,726
Oklahoma:
$15,242
(% of AGI for various income ranges: 3.1% for AGIs below $25k, 1.5% for AGIs $25k-50k, 4.2% for AGIs $50k-75k, 3.2% for AGIs $100k-200k, 0.8% for AGIs over 200k)
Self-employment retirement plans: $20,500 (reported on 1.6% of returns)
74119:
$20,500
Oklahoma:
$20,266
Total itemized deductions: $206,590 (28% of AGI, reported on 26.3% of returns)
Here:
$206,590
State:
$24,882
Here:
27.9% of AGI
State:
18.8% of AGI
(% of AGI for various income ranges: 6.3% for AGIs below $25k, 4.9% for AGIs $25k-50k, 8.1% for AGIs $50k-75k, 14.8% for AGIs $75k-100k, 13.5% for AGIs $100k-200k, 27.9% for AGIs over 200k)
Charity contributions: $88,900 (reported on 20.4% of returns)
Here:
$88,900
State:
$6,591
(% of AGI for various income ranges: 0.7% for AGIs below $25k, 0.8% for AGIs $25k-50k, 1.3% for AGIs $50k-75k, 3.0% for AGIs $75k-100k, 2.8% for AGIs $100k-200k, 9.6% for AGIs over 200k)
Taxes paid: $44,053 (reported on 26.3% of returns)
74119:
$44,053
State:
$7,196
(% of AGI for various income ranges: 1.0% for AGIs below $25k, 0.9% for AGIs $25k-50k, 1.8% for AGIs $50k-75k, 3.5% for AGIs $75k-100k, 4.9% for AGIs $100k-200k, 5.8% for AGIs over 200k)
Earned income credit: $1,071 (reported on 12.9% of returns)
Here:
$1,071
State:
$2,354
(% of AGI for various income ranges: 2.7% for AGIs below $25k, 0.2% for AGIs $25k-50k)
Percentage of individuals using paid preparers for their 2012 taxes: 45.7%
Here:
46%
State:
56%
(% for various income ranges: 38.5% for AGIs below $25k, 38.5% for AGIs $25k-50k, 42.9% for AGIs $50k-75k, 54.5% for AGIs $75k-100k, 68.8% for AGIs $100k-200k, 78.6% for AGIs over 200k)
Averages for the 2004 tax year for zip code 74119, filed in 2005:
Average Adjusted Gross Income (AGI) in 2004: $72,219 (Individual Income Tax Returns)
Here:
$72,219
State:
$41,245
Salary/wage: $40,123 (reported on 79.9% of returns)
Here:
$40,123
State:
$35,318
(% of AGI for various income ranges: 99.3% for AGIs below $10k, 75.7% for AGIs $10k-25k, 84.4% for AGIs $25k-50k, 75.7% for AGIs $50k-75k, 64.0% for AGIs $75k-100k, 25.8% for AGIs over 100k)
Taxable interest for individuals: $4,345 (reported on 43.7% of returns)
This zip code:
$4,345
Oklahoma:
$1,745
(% of AGI for various income ranges: 6.6% for AGIs below $10k, 3.0% for AGIs $10k-25k, 1.8% for AGIs $25k-50k, 1.9% for AGIs $50k-75k, 3.2% for AGIs $75k-100k, 2.7% for AGIs over 100k)
Taxable dividends: $12,130 (reported on 26.0% of returns)
Here:
$12,130
State:
$2,920
(% of AGI for various income ranges: 5.2% for AGIs below $10k, 2.2% for AGIs $10k-25k, 1.5% for AGIs $25k-50k, 2.5% for AGIs $50k-75k, 3.8% for AGIs $75k-100k, 5.5% for AGIs over 100k)
Net capital gain/loss: +$51,796 (reported on 23.5% of returns)
Here:
+$51,796
State:
+$10,653
(% of AGI for various income ranges: -4.8% for AGIs below $10k, -0.4% for AGIs $10k-25k, 0.9% for AGIs $25k-50k, 2.6% for AGIs $50k-75k, 3.2% for AGIs $75k-100k, 25.5% for AGIs over 100k)
Profit/loss from business: +$39,839 (reported on 15.5% of returns)
Here:
+$39,839
State:
+$8,532
(% of AGI for various income ranges: -0.4% for AGIs below $10k, 3.4% for AGIs $10k-25k, 3.3% for AGIs $25k-50k, 2.3% for AGIs $50k-75k, 10.3% for AGIs $75k-100k, 11.0% for AGIs over 100k)
IRA payment deduction: $2,628 (reported on 2.4% of returns)
74119:
$2,628
Oklahoma:
$3,127
Self-employed pension: $21,760 (reported on 1.4% of returns)
Here:
$21,760
Oklahoma:
$14,276
Total itemized deductions: $30,023 (16% of AGI, reported on 30.1% of returns)
Here:
$30,023
State:
$17,093
Here:
16.3% of AGI
State:
20.5% of AGI
(% of AGI for various income ranges: 9.8% for AGIs below $10k, 4.9% for AGIs $10k-25k, 9.4% for AGIs $25k-50k, 12.8% for AGIs $50k-75k, 16.7% for AGIs $75k-100k, 13.6% for AGIs over 100k)
Charity contributions deductions: $9,875 (5% of AGI, reported on 26.2% of returns)
Here:
$9,875
State:
$4,240
Here:
4.9% of AGI
State:
4.8% of AGI
(% of AGI for various income ranges: 0.7% for AGIs below $10k, 0.9% for AGIs $10k-25k, 1.7% for AGIs $25k-50k, 1.9% for AGIs $50k-75k, 3.8% for AGIs $75k-100k, 4.5% for AGIs over 100k)
Total tax: $15,746 (reported on 79.3% of returns)
74119:
$15,746
State:
$6,542
(% of AGI for various income ranges: 2.0% for AGIs below $10k, 5.0% for AGIs $10k-25k, 9.6% for AGIs $25k-50k, 11.7% for AGIs $50k-75k, 12.5% for AGIs $75k-100k, 21.6% for AGIs over 100k)
Earned income credit: $1,143 (reported on 12.3% of returns)
Here:
$1,143
State:
$1,830
Percentage of individuals using paid preparers for their 2004 taxes: 55.5%
Here:
55%
State:
63%
(% for various income ranges: 51.2% for AGIs below $10k, 55.7% for AGIs $10k-25k, 49.5% for AGIs $25k-50k, 57.1% for AGIs $50k-75k, 63.4% for AGIs $75k-100k, 75.1% for AGIs over 100k)
Household received Food Stamps/SNAP in the past 12 months: 174 Household did not receive Food Stamps/SNAP in the past 12 months: 2,158
Women who had a birth in the past 12 months: 9 (9 now married, 0 unmarried) Women who did not have a birth in the past 12 months: 983 (214 now married, 769 unmarried)
Housing units in zip code 74119 with a mortgage: 270 (25 second mortgage, 19 both second mortgage and home equity loan) Houses without a mortgage: 38
Median monthly owner costs for units with a mortgage: $1,659 Median monthly owner costs for units without a mortgage: $813
Residents with income below the poverty level in 2022:
This zip code:
17.9%
Whole state:
15.7%
Residents with income below 50% of the poverty level in 2022:
This zip code:
6.3%
Whole state:
8.3%
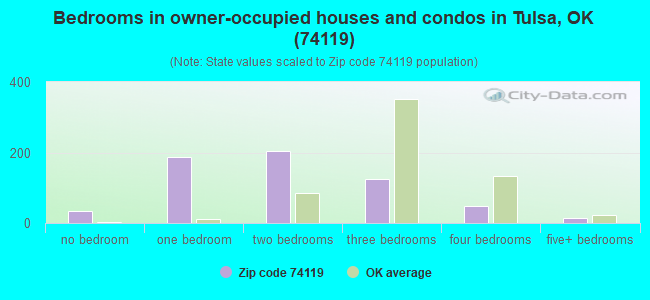
Median number of rooms in houses and condos:
Here:
5.4
State:
6.1
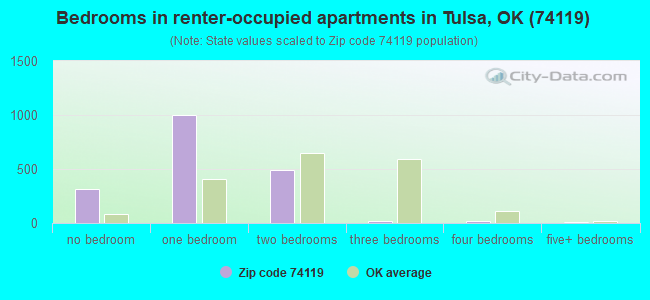
Median number of rooms in apartments:
Here:
3.1
State:
4.5
Notable locations in this zip code not listed on our city pages
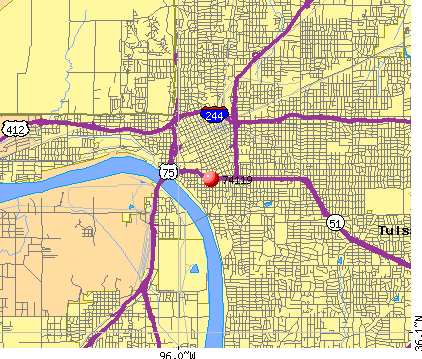
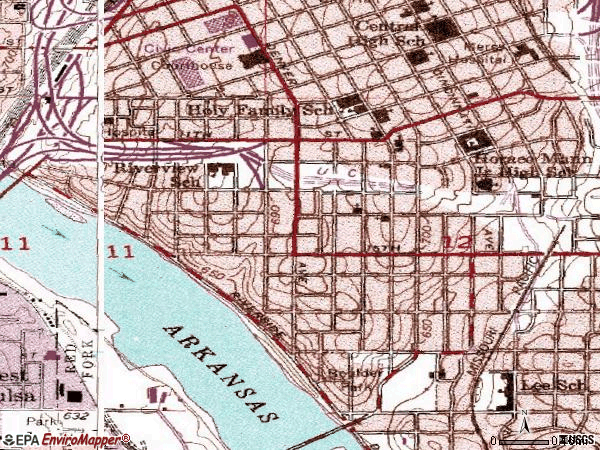
Notable locations in zip code 74119: Tulsa Fire Department District 1 Station 4 (A), Tulsa Fire Department Station 5 (B). Display/hide their locations on the map
Churches in zip code 74119 include: Holy Family Cathedral (A), Unity Center of Tulsa (B), Saint Pauls United Methodist Church (C), South Boston Avenue Methodist Episcopal Church (D), First Church Christ (E), Progressive Baptist Church (F), First Christian Church Devotional Center (G), First Presbyterian Church (H), First United Methodist Church (I). Display/hide their locations on the map
In group quarters: 99 (-1 institutionalized population)
Size of family households: 412 2-persons, 46 3-persons, 26 4-persons, 12 5-persons, 12 6-persons
Size of nonfamily households: 1,587 1-person, 264 2-persons, 6 3-persons
143 married couples with children.
69 single-parent households (8 men, 61 women).
94.6% of residents of 74119 zip code speak English at home.
2.1% of residents speak Spanish at home (100% very well).
0.7% of residents speak other Indo-European language at home (100% very well).
1.9% of residents speak Asian or Pacific Island language at home (100% very well).
0.4% of residents speak other language at home (100% well).
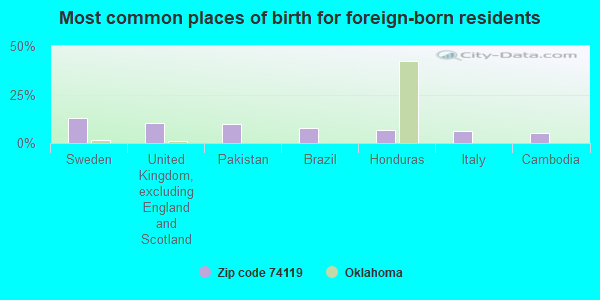
Foreign born population: 187 (5.5%) (38.8% of them are naturalized citizens)
Major facilities with environmental interests located in this zip code:
DOWNTOWN PLAZA II ICO TRANSWESTERN PROP (110 W 7TH in TULSA, OK)
(Integrated Compliance Information System) - ICIS-HQ-1996-0008, FORMAL ENFORCEMENT ACTION Conditionally Exempt Small Quantity Generators, less than 100 kg/month of hazardous waste (Resource Conservation and Recovery Act (tracking hazardous waste)) - notification Organizations: DOWNTOWN PLAZA II C/O TRANSWESTERN PROP (CONTACT/OWNER)
BRITTCO INC (819 S DENVER in TULSA, OK)
(Resource Conservation and Recovery Act (tracking hazardous waste)) Organizations: BYRON C BRITTON (CONTACT/OWNER)
CARLILE DX STATION (747 S BOSTON in TULSA, OK)
(Resource Conservation and Recovery Act (tracking hazardous waste)) Organizations: C A DORRIS (CONTACT/OWNER)
EXECUTIVE MOTORWORKS INC. (1202 S BOSTON in TULSA, OK)
(Resource Conservation and Recovery Act (tracking hazardous waste)) Organizations: ENGLAND DAVID L (CONTACT/OWNER)
FRED JONES FORD (1230 S BOSTON in TULSA, OK)
(Resource Conservation and Recovery Act (tracking hazardous waste)) Organizations: FRED JONES FORD OF TULSA (CONTACT/OWNER)
GETTY REFINING & MARKETING (1407 S BOULDER in TULSA, OK)
(Resource Conservation and Recovery Act (tracking hazardous waste)) Business NAICS classification: CRUDE PETROLEUM AND NATURAL GAS EXTRACTION.; SOFTWOOD VENEER AND PLYWOOD MANUFACTURING.
COMMUNICATIONS INSTALLATION (TALLAHASSEE TO MIAMI in MULTIPLE, FL)
National Pollutant Discharge Elimination System NON-MAJOR (Tracking pollutant discharge elimination systems) - permit Alternative names: WILLIAMS COMMUNICATIONS INC
CMS FIELD SERVICES INC. (1437 S. BOULDER, SUITE 1250 in TULSA, OK)
CRITERIA AND HAZARDOUS AIR POLLUTANT INVENTORY (Inventory of air pollution sources) Business SIC classification: NATURAL GAS TRANSMISSION Alternative names: HERITAGE GAS SE/MURPHY CO
Housing units lacking complete plumbing facilities: 2.3% Housing units lacking complete kitchen facilities: 3.2%
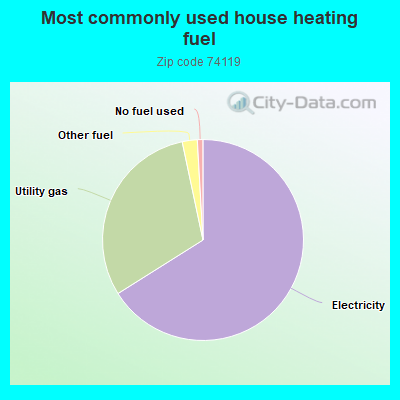
65.8%Electricity
30.5%Utility gas
2.4%Other fuel
0.9%No fuel used
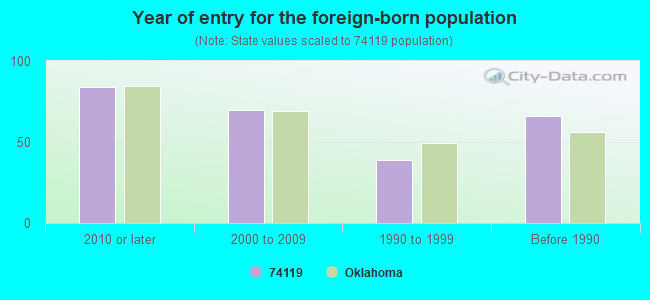
Population in 1990: 4,059.
Place of birth for U.S.-born residents:
This state: 1,606
Northeast: 70
Midwest: 536
South: 695
West: 286
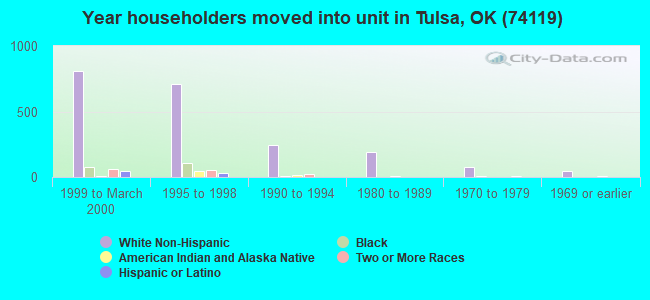
28% of the 74119 zip code residents lived in the same house 5 years ago. Out of people who lived in different houses, 59% lived in this county. Out of people who lived in different counties, 50% lived in Oklahoma.
77% of the 74119 zip code residents lived in the same house 1 year ago. Out of people who lived in different houses, 46% moved from this county. Out of people who lived in different houses, 17% moved from different county within same state. Out of people who lived in different houses, 32% moved from different state. Out of people who lived in different houses, 1% moved from abroad.
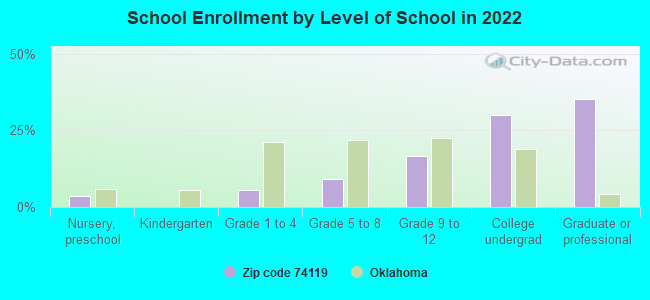
Private vs. public school enrollment:
Students in private schools in grades 1 to 8 (elementary and middle school): 18
Here:
28.7%
Oklahoma:
11.7%
Students in private schools in grades 9 to 12 (high school): 7
Here:
9.8%
Oklahoma:
11.7%
Students in private undergraduate colleges: 54
Here:
40.3%
Oklahoma:
19.3%
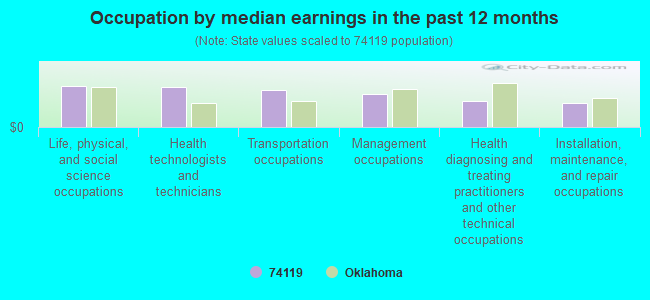
Occupation by median earnings in the past 12 months ($)
105,281Life, physical, and social science occupations
101,069Health technologists and technicians
95,218Transportation occupations
83,827Management occupations
65,098Health diagnosing and treating practitioners and other technical occupations
60,666Installation, maintenance, and repair occupations
Companies with federal contracts located in this zip code (TULSA, OK):
NONNI'S FOOD COMPANY INC (601 S BOULDER AVE STE 900; small business) : $998,248 in 5 contractsfrom 2004 to 2005
Contracts for Food Items For Resale, Non-Food Items For Resale by Defense Commissary Agency Signed by year:2000: $0; 2001: $0; 2002: $0; 2003: $0; 2004: $311,989; 2005: $686,259; 2006: $0.
Biggest contracts:
$311,989 with Defense Commissary Agency for Food Items For Resale. Signed on 2004-10-01. Completion date: 2005-02-28.
$300,000 with Defense Commissary Agency for Non-Food Items For Resale. Signed on 2005-10-01. Completion date: 2005-12-31.
$249,786 with Defense Commissary Agency for Food Items For Resale. Signed on 2005-04-01. Completion date: 2005-08-31.
$88,319, same as above.Signed on 2005-01-01. Completion date: 2005-03-31.
CYNTERGY AEC LLC (1307 S BOULDER AVE; small business) : $929,367 in 15 contractsfrom 2002 to 2005
Contracts for Architect - Engineer Services (including landscaping, interior layout, and designing), Other Architect and Engineering Services, A&E Management Engineering Services, Hospital Buildings, and moreby Department of Veterans Affairs, Army Signed by year:2000: $0; 2001: $0; 2002: $470,000; 2003: $344,451; 2004: $47,529; 2005: $67,387; 2006: $0.
Biggest contracts:
$290,000 with Department of Veterans Affairs for Architect - Engineer Services (including landscaping, interior layout, and designing). Taking place in AR. Signed on 2002-09-15. Completion date: 2003-06-15.
$180,000, same as above.Signed on 2002-06-15. Completion date: 2003-05-15.
$95,798 with Army for Architect - Engineer Services (including landscaping, interior layout, and designing). Signed on 2003-04-01. Completion date: 2003-07-18.
$80,890, same as above.Signed on 2003-06-25. Completion date: 2003-11-26.
URS GROUP, INC (1437 SOUTH BOULDER AVE STE) : $901,381 in 20 contractsfrom 2004 to 2006
Contracts for Miscellaneous Items, Architect - Engineer Services (including landscaping, interior layout, and designing) by Army, U.S. Army Corps of Engineers - civil program financing only Signed by year:2000: $0; 2001: $0; 2002: $0; 2003: $0; 2004: $254,044; 2005: $532,337; 2006: $115,000.
Biggest contracts:
$99,930 with Army for Miscellaneous Items. Taking place in MO. Signed on 2005-05-17. Completion date: 2005-04-06.
$99,343 with U.S. Army Corps of Engineers - civil program financing only for Architect - Engineer Services (including landscaping, interior layout, and designing). Signed on 2005-05-09. Completion date: 2006-05-30.
$99,343 with Army for Architect - Engineer Services (including landscaping, interior layout, and designing). Signed on 2005-05-09. Completion date: 2006-05-30.
$85,906 with Army for Architect - Engineer Services (including landscaping, interior layout, and designing). Taking place in LA. Signed on 2006-03-13. Completion date: 2006-07-31.
MATRIX ARCHITECTS, ENGINEERS, (624 S BOSTON AVE; small business) : $94,086 in 3 contractsin 2003
$52,630 with Army for Architect - Engineer Services (including landscaping, interior layout, and designing). Signed on 2003-08-21. Completion date: 2003-11-01.
$41,456, same as above.Signed on 2003-06-16. Completion date: 2003-04-30.
$0, same as above.Signed on 2003-06-16. Completion date: 2003-04-30.
FISHER, LINDA K (417 W 7TH ST 304) : $48,000 in 6 contractsin 2005
Contracts for Court Reporting Services by Army, U.S. Army Corps of Engineers - civil program financing only Signed by year:2000: $0; 2001: $0; 2002: $0; 2003: $0; 2004: $0; 2005: $48,000; 2006: $0.
Biggest contracts:
$18,000 with Army for Court Reporting Services. Signed on 2005-02-08. Completion date: 2005-02-08.
$18,000 with U.S. Army Corps of Engineers - civil program financing only for Court Reporting Services. Signed on 2005-02-08. Completion date: 2005-02-08.
$3,000 with Army for Court Reporting Services. Signed on 2005-09-20. Completion date: 2005-10-12.
$3,000, same as above.Signed on 2005-08-19. Completion date: 2005-08-22.
Top industries in this zip code by the number of employees in 2005:
Finance and Insurance: Direct Health and Medical Insurance Carriers (over 1000 employees: 1 establishment, 250-499 employees: 1 establishment, 20-49 employees: 1 establishment)
Professional, Scientific, and Technical Services: Offices of Lawyers (100-249: 1, 50-99: 1, 20-49: 7, 10-19: 6, 5-9: 20, 1-4: 91)
Administrative and Support and Waste Management and Remediation Services: Temporary Help Services (250-499: 1, 100-249: 1, 50-99: 1, 20-49: 1, 5-9: 1, 1-4: 1)
Mining: Crude Petroleum and Natural Gas Extraction (100-249: 3, 50-99: 1, 20-49: 1, 5-9: 3, 1-4: 9)
Management of Companies and Enterprises: Corporate, Subsidiary, and Regional Managing Offices (100-249: 2, 50-99: 2, 20-49: 1, 10-19: 1, 5-9: 3, 1-4: 1)
Utilities: Electric Power Distribution (250-499: 1, 50-99: 1)
Real Estate and Rental and Leasing: Residential Property Managers (250-499: 1, 20-49: 1, 5-9: 1)
Other Services (except Public Administration): Religious Organizations (100-249: 1, 50-99: 2, 20-49: 1, 5-9: 3, 1-4: 2)
2002 - 2018 National Fire Incident Reporting System (NFIRS) incidents
According to the data from the years 2002 - 2018 the average number of fire incidents per year is 32. The highest number of fires - 53 took place in 2007, and the least - 16 in 2014. The data has a rising trend.
When looking into fire subcategories, the most reports belonged to: Outside Fires (46.4%), and Structure Fires (29.8%).
Fire incident types reported to NFIRS in Zip Code 74119
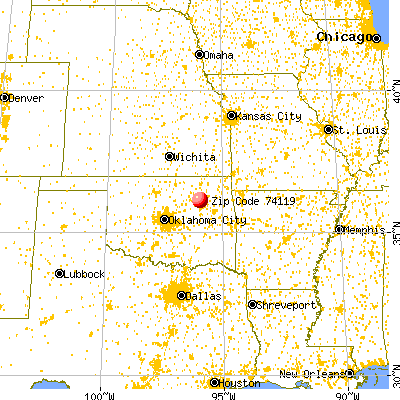


 Nearest zip codes: 74103, 74120, 74104, 74114, 74106, 74107.
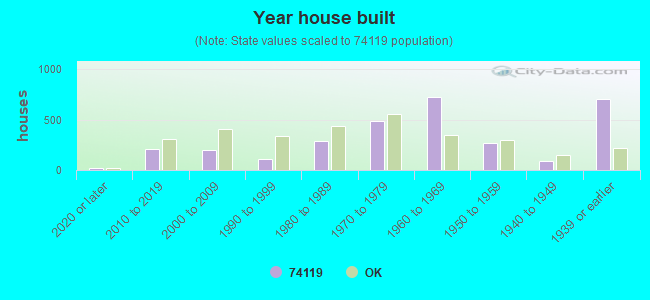


 According to the data from the years 2002 - 2018 the average number of fire incidents per year is 32. The highest number of fires - 53 took place in 2007, and the least - 16 in 2014. The data has a rising trend.
 When looking into fire subcategories, the most reports belonged to: Outside Fires (46.4%), and Structure Fires (29.8%).