Estimated zip code population in 2022: 26,773 Zip code population in 2010: 26,547 Zip code population in 2000: 28,455
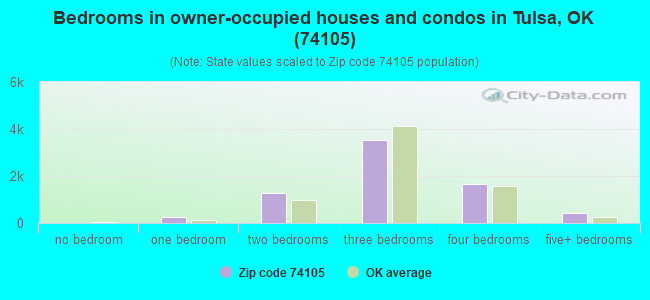
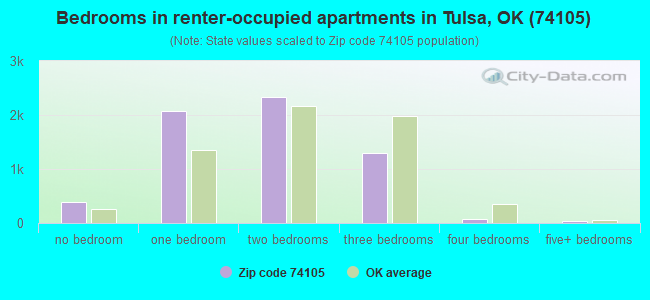
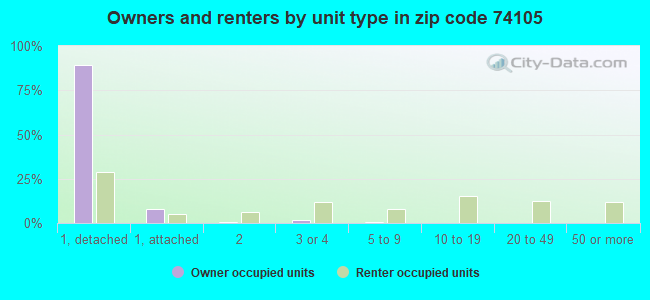
Houses and condos: 14,725 Renter-occupied apartments: 6,142
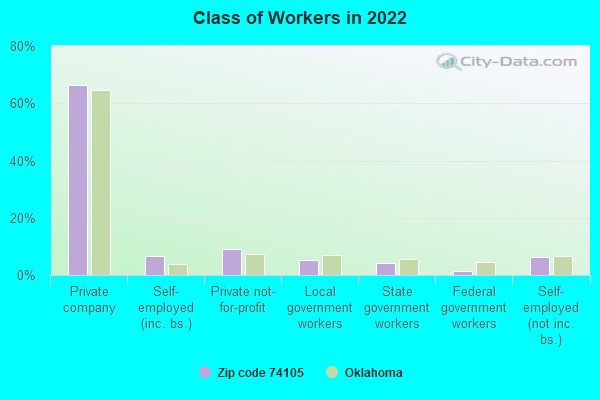
% of renters here:
46%
State:
35%
March 2022 cost of living index in zip code 74105: 88.3 (less than average, U.S. average is 100)
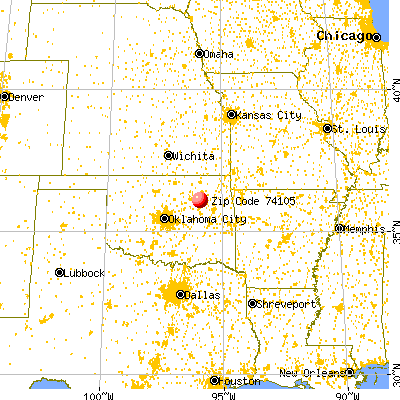
Land area: 7.3 sq. mi. Water area: 0.3 sq. mi.
Population density: 3,665 people per square mile
(average).
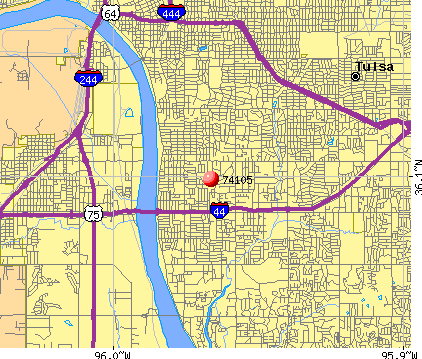
OSM Map
General Map
Google Map
MSN Map
OSM Map
General Map
Google Map
MSN Map
OSM Map
General Map
Google Map
MSN Map
OSM Map
General Map
Google Map
MSN Map
Please wait while loading the map...
Real estate property taxes paid for housing units in 2022:
This zip code:
1.0% ($3,150)
Oklahoma:
0.8% ($1,501)
Median real estate property taxes paid for housing units with mortgages in 2022: $3,029 (0.9%) Median real estate property taxes paid for housing units with no mortgage in 2022: $3,234 (1.0%)
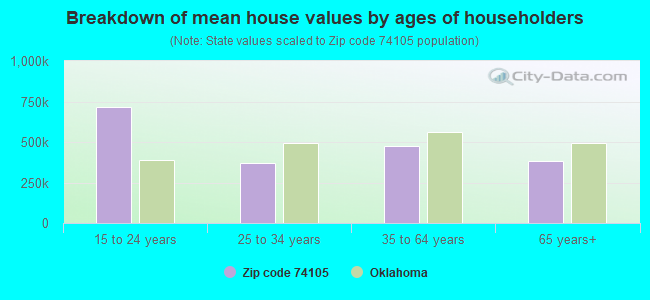
Estimated median house/condo value in 2022: $331,568
74105:
$331,568
Oklahoma:
$191,700
According to our research of Oklahoma and other state lists, there were 11 registered sex offenders living in 74105 zip code as of April 27, 2024. The ratio of all residents to sex offenders in zip code 74105 is 2,337 to 1. The ratio of registered sex offenders to all residents in this zip code is much lower than the state average.
Median resident age:
This zip code:
41.2 years
Oklahoma median age:
37.1 years
Average household size:
This zip code:
2.0 people
Oklahoma:
2.5 people
Averages for the 2020 tax year for zip code 74105, filed in 2021:
Average Adjusted Gross Income (AGI) in 2020: $118,208 (Individual Income Tax Returns)
Here:
$118,208
State:
$63,060
Salary/wage: $80,368 (reported on 79.9% of returns)
Here:
$80,368
State:
$52,427
(% of AGI for various income ranges: 1166.3% for AGIs below $25k, 3608.5% for AGIs $25k-50k, 6647.9% for AGIs $50k-75k, 9881.1% for AGIs $75k-100k, 17551.8% for AGIs $100k-200k, 91906.2% for AGIs over 200k)
Taxable interest for individuals: $3,936 (reported on 37.2% of returns)
This zip code:
$3,936
Oklahoma:
$1,603
(% of AGI for various income ranges: 19.8% for AGIs below $25k, 39.9% for AGIs $25k-50k, 71.6% for AGIs $50k-75k, 151.6% for AGIs $75k-100k, 356.0% for AGIs $100k-200k, 2724.0% for AGIs over 200k)
Ordinary dividends: $23,262 (reported on 29.2% of returns)
Here:
$23,262
State:
$7,001
(% of AGI for various income ranges: 57.0% for AGIs below $25k, 92.5% for AGIs $25k-50k, 212.9% for AGIs $50k-75k, 509.8% for AGIs $75k-100k, 1359.1% for AGIs $100k-200k, 14402.4% for AGIs over 200k)
Net capital gain/loss in AGI: +$45,600 (reported on 27.1% of returns)
Here:
+$45,600
State:
+$19,855
(% of AGI for various income ranges: 24.9% for AGIs below $25k, 73.5% for AGIs $25k-50k, 207.2% for AGIs $50k-75k, 392.0% for AGIs $75k-100k, 1404.1% for AGIs $100k-200k, 30177.1% for AGIs over 200k)
Profit/loss from business: +$19,849 (reported on 19.2% of returns)
Here:
+$19,849
State:
+$9,904
(% of AGI for various income ranges: 131.8% for AGIs below $25k, 119.6% for AGIs $25k-50k, 200.4% for AGIs $50k-75k, 510.7% for AGIs $75k-100k, 1005.3% for AGIs $100k-200k, 6150.7% for AGIs over 200k)
Taxable individual retirement arrangement distribution: $29,449 (reported on 10.5% of returns)
74105:
$29,449
Oklahoma:
$20,476
(% of AGI for various income ranges: 53.3% for AGIs below $25k, 113.2% for AGIs $25k-50k, 251.7% for AGIs $50k-75k, 543.6% for AGIs $75k-100k, 1449.2% for AGIs $100k-200k, 3768.9% for AGIs over 200k)
Self-employed (Keogh) retirement plans: $24,357 (reported on 1.1% of returns)
74105:
$24,357
Oklahoma:
$23,482
(% of AGI for various income ranges: 5.3% for AGIs below $25k, 61.2% for AGIs $100k-200k, 617.1% for AGIs over 200k)
Total itemized deductions: $55,576 (reported on 14.3% of returns)
Here:
$55,576
State:
$39,736
(% of AGI for various income ranges: 54.0% for AGIs below $25k, 121.6% for AGIs $25k-50k, 349.0% for AGIs $50k-75k, 807.9% for AGIs $75k-100k, 1707.3% for AGIs $100k-200k, 16057.1% for AGIs over 200k)
Charity contributions: $32,315 (reported on 12.7% of returns)
Here:
$32,315
State:
$17,288
(% of AGI for various income ranges: 4.7% for AGIs below $25k, 15.5% for AGIs $25k-50k, 57.1% for AGIs $50k-75k, 198.4% for AGIs $75k-100k, 481.7% for AGIs $100k-200k, 10012.7% for AGIs over 200k)
Taxes paid: $8,495 (reported on 14.3% of returns)
74105:
$8,495
State:
$7,046
(% of AGI for various income ranges: 8.1% for AGIs below $25k, 20.3% for AGIs $25k-50k, 70.2% for AGIs $50k-75k, 195.5% for AGIs $75k-100k, 478.6% for AGIs $100k-200k, 1938.4% for AGIs over 200k)
Earned income credit: $2,126 (reported on 14.9% of returns)
Here:
$2,126
State:
$2,435
(% of AGI for various income ranges: 95.9% for AGIs below $25k, 48.3% for AGIs $25k-50k)
Percentage of individuals using paid preparers for their 2020 taxes: 93.2%
Here:
93%
State:
94%
(% for various income ranges: 93.2% for AGIs below $25k, 93.6% for AGIs $25k-50k, 92.5% for AGIs $50k-75k, 92.5% for AGIs $75k-100k, 93.5% for AGIs $100k-200k, 93.8% for AGIs over 200k)
Averages for the 2012 tax year for zip code 74105, filed in 2013:
Average Adjusted Gross Income (AGI) in 2012: $115,672 (Individual Income Tax Returns)
Here:
$115,672
State:
$58,581
Salary/wage: $76,978 (reported on 82.2% of returns)
Here:
$76,978
State:
$45,973
(% of AGI for various income ranges: 75.8% for AGIs below $25k, 81.5% for AGIs $25k-50k, 75.1% for AGIs $50k-75k, 71.0% for AGIs $75k-100k, 66.8% for AGIs $100k-200k, 44.6% for AGIs over 200k)
Taxable interest for individuals: $4,615 (reported on 38.0% of returns)
This zip code:
$4,615
Oklahoma:
$1,625
(% of AGI for various income ranges: 1.4% for AGIs below $25k, 0.8% for AGIs $25k-50k, 1.0% for AGIs $50k-75k, 1.3% for AGIs $75k-100k, 1.2% for AGIs $100k-200k, 1.7% for AGIs over 200k)
Ordinary dividends: $21,257 (reported on 26.9% of returns)
Here:
$21,257
State:
$6,374
(% of AGI for various income ranges: 2.7% for AGIs below $25k, 1.7% for AGIs $25k-50k, 2.3% for AGIs $50k-75k, 3.3% for AGIs $75k-100k, 4.0% for AGIs $100k-200k, 6.0% for AGIs over 200k)
Net capital gain/loss in AGI: +$46,266 (reported on 23.3% of returns)
Here:
+$46,266
State:
+$24,023
(% of AGI for various income ranges: 0.4% for AGIs below $25k, 0.3% for AGIs $25k-50k, 0.9% for AGIs $50k-75k, 1.6% for AGIs $75k-100k, 2.7% for AGIs $100k-200k, 13.6% for AGIs over 200k)
Profit/loss from business: +$25,880 (reported on 18.1% of returns)
Here:
+$25,880
State:
+$11,913
(% of AGI for various income ranges: 8.1% for AGIs below $25k, 3.5% for AGIs $25k-50k, 2.8% for AGIs $50k-75k, 5.4% for AGIs $75k-100k, 4.5% for AGIs $100k-200k, 3.8% for AGIs over 200k)
Taxable individual retirement arrangement distribution: $25,092 (reported on 11.2% of returns)
74105:
$25,092
Oklahoma:
$15,242
(% of AGI for various income ranges: 2.7% for AGIs below $25k, 2.6% for AGIs $25k-50k, 3.4% for AGIs $50k-75k, 3.9% for AGIs $75k-100k, 4.3% for AGIs $100k-200k, 1.8% for AGIs over 200k)
Self-employment retirement plans: $20,425 (reported on 1.2% of returns)
74105:
$20,425
Oklahoma:
$20,266
(% of AGI for various income ranges: 0.4% for AGIs $50k-75k, 0.3% for AGIs $100k-200k, 0.2% for AGIs over 200k)
Total itemized deductions: $42,410 (16% of AGI, reported on 36.0% of returns)
Here:
$42,410
State:
$24,882
Here:
16.0% of AGI
State:
18.8% of AGI
(% of AGI for various income ranges: 9.5% for AGIs below $25k, 9.6% for AGIs $25k-50k, 11.7% for AGIs $50k-75k, 14.7% for AGIs $75k-100k, 15.0% for AGIs $100k-200k, 13.5% for AGIs over 200k)
Charity contributions: $12,576 (reported on 30.7% of returns)
Here:
$12,576
State:
$6,591
(% of AGI for various income ranges: 1.0% for AGIs below $25k, 1.2% for AGIs $25k-50k, 1.8% for AGIs $50k-75k, 2.5% for AGIs $75k-100k, 3.0% for AGIs $100k-200k, 4.0% for AGIs over 200k)
Taxes paid: $14,520 (reported on 35.8% of returns)
74105:
$14,520
State:
$7,196
(% of AGI for various income ranges: 1.8% for AGIs below $25k, 2.1% for AGIs $25k-50k, 3.3% for AGIs $50k-75k, 4.7% for AGIs $75k-100k, 5.8% for AGIs $100k-200k, 4.8% for AGIs over 200k)
Earned income credit: $2,001 (reported on 16.2% of returns)
Here:
$2,001
State:
$2,354
(% of AGI for various income ranges: 5.7% for AGIs below $25k, 0.6% for AGIs $25k-50k)
Percentage of individuals using paid preparers for their 2012 taxes: 51.9%
Here:
52%
State:
56%
(% for various income ranges: 46.0% for AGIs below $25k, 44.7% for AGIs $25k-50k, 51.0% for AGIs $50k-75k, 56.0% for AGIs $75k-100k, 62.8% for AGIs $100k-200k, 81.2% for AGIs over 200k)
Averages for the 2004 tax year for zip code 74105, filed in 2005:
Average Adjusted Gross Income (AGI) in 2004: $67,761 (Individual Income Tax Returns)
Here:
$67,761
State:
$41,245
Salary/wage: $48,927 (reported on 79.5% of returns)
Here:
$48,927
State:
$35,318
(% of AGI for various income ranges: 139.6% for AGIs below $10k, 76.4% for AGIs $10k-25k, 78.8% for AGIs $25k-50k, 71.1% for AGIs $50k-75k, 66.3% for AGIs $75k-100k, 46.7% for AGIs over 100k)
Taxable interest for individuals: $4,240 (reported on 49.1% of returns)
This zip code:
$4,240
Oklahoma:
$1,745
(% of AGI for various income ranges: 13.4% for AGIs below $10k, 3.1% for AGIs $10k-25k, 2.0% for AGIs $25k-50k, 2.7% for AGIs $50k-75k, 2.9% for AGIs $75k-100k, 3.2% for AGIs over 100k)
Taxable dividends: $6,936 (reported on 32.8% of returns)
Here:
$6,936
State:
$2,920
(% of AGI for various income ranges: 11.2% for AGIs below $10k, 2.4% for AGIs $10k-25k, 2.3% for AGIs $25k-50k, 2.8% for AGIs $50k-75k, 3.8% for AGIs $75k-100k, 3.6% for AGIs over 100k)
Net capital gain/loss: +$24,106 (reported on 28.3% of returns)
Here:
+$24,106
State:
+$10,653
(% of AGI for various income ranges: -5.3% for AGIs below $10k, 0.4% for AGIs $10k-25k, 0.6% for AGIs $25k-50k, 1.4% for AGIs $50k-75k, 2.0% for AGIs $75k-100k, 15.6% for AGIs over 100k)
Profit/loss from business: +$19,406 (reported on 17.8% of returns)
Here:
+$19,406
State:
+$8,532
(% of AGI for various income ranges: 2.7% for AGIs below $10k, 5.1% for AGIs $10k-25k, 3.1% for AGIs $25k-50k, 4.2% for AGIs $50k-75k, 4.5% for AGIs $75k-100k, 5.8% for AGIs over 100k)
IRA payment deduction: $3,306 (reported on 3.1% of returns)
74105:
$3,306
Oklahoma:
$3,127
(% of AGI for various income ranges: 0.6% for AGIs below $10k, 0.2% for AGIs $10k-25k, 0.2% for AGIs $25k-50k, 0.3% for AGIs $50k-75k, 0.3% for AGIs $75k-100k, 0.1% for AGIs over 100k)
Self-employed pension: $16,394 (reported on 1.5% of returns)
Here:
$16,394
Oklahoma:
$14,276
(% of AGI for various income ranges: 0.1% for AGIs $10k-25k, 0.1% for AGIs $25k-50k, 0.2% for AGIs $50k-75k, 0.4% for AGIs $75k-100k, 0.5% for AGIs over 100k)
Total itemized deductions: $23,549 (18% of AGI, reported on 41.2% of returns)
Here:
$23,549
State:
$17,093
Here:
17.6% of AGI
State:
20.5% of AGI
(% of AGI for various income ranges: 28.6% for AGIs below $10k, 11.0% for AGIs $10k-25k, 14.0% for AGIs $25k-50k, 17.8% for AGIs $50k-75k, 17.3% for AGIs $75k-100k, 13.6% for AGIs over 100k)
Charity contributions deductions: $6,837 (5% of AGI, reported on 36.8% of returns)
Here:
$6,837
State:
$4,240
Here:
4.8% of AGI
State:
4.8% of AGI
(% of AGI for various income ranges: 2.2% for AGIs below $10k, 1.4% for AGIs $10k-25k, 2.2% for AGIs $25k-50k, 3.0% for AGIs $50k-75k, 3.5% for AGIs $75k-100k, 4.4% for AGIs over 100k)
Total tax: $14,688 (reported on 76.9% of returns)
74105:
$14,688
State:
$6,542
(% of AGI for various income ranges: 5.2% for AGIs below $10k, 4.4% for AGIs $10k-25k, 7.9% for AGIs $25k-50k, 10.5% for AGIs $50k-75k, 11.6% for AGIs $75k-100k, 21.5% for AGIs over 100k)
Earned income credit: $1,614 (reported on 14.1% of returns)
Here:
$1,614
State:
$1,830
Percentage of individuals using paid preparers for their 2004 taxes: 61.1%
Here:
61%
State:
63%
(% for various income ranges: 59.2% for AGIs below $10k, 62.1% for AGIs $10k-25k, 54.6% for AGIs $25k-50k, 58.4% for AGIs $50k-75k, 62.8% for AGIs $75k-100k, 75.1% for AGIs over 100k)
Likely homosexual households (counted as self-reported same-sex unmarried-partner households)
Lesbian couples: 0.1% of all households
Gay men: 0.4% of all households
Household received Food Stamps/SNAP in the past 12 months: 1,717 Household did not receive Food Stamps/SNAP in the past 12 months: 11,465
Women who had a birth in the past 12 months: 389 (248 now married, 140 unmarried) Women who did not have a birth in the past 12 months: 6,036 (2,291 now married, 3,745 unmarried)
Housing units in zip code 74105 with a mortgage: 4,042 (422 second mortgage, 10 home equity loan, 290 both second mortgage and home equity loan) Houses without a mortgage: 80
Median monthly owner costs for units with a mortgage: $1,771 Median monthly owner costs for units without a mortgage: $702
Residents with income below the poverty level in 2022:
This zip code:
16.1%
Whole state:
15.7%
Residents with income below 50% of the poverty level in 2022:
This zip code:
7.3%
Whole state:
8.3%
Median number of rooms in houses and condos:
Here:
7.0
State:
6.1
Median number of rooms in apartments:
Here:
4.1
State:
4.5
Notable locations in this zip code not listed on our city pages
Notable locations in zip code 74105: Brook Plaza (A), The Consortium (B), London Square (C), Tulsa Fire Department Station 14 (D), Tulsa Fire Department Station 18 (E). Display/hide their locations on the map
Shopping Centers: Abdo Shopping Center (1), Bellaire Village Shopping Center (2), Fikes Shopping Center (3), Lighthouse Shopping Center (4), Southern Village Shopping Center (5), Stonehorse Shopping Center (6). Display/hide their locations on the map
Churches in zip code 74105 include: Evangelistic Temple (A), Word Christian Church (B), Trinity United Methodist Church (C), Saint Marys Church (D), Southside Christian Church (E), Southminster Presbyterian Church (F), International Gospel Center (G), Liberty World Outreach Church (H), Life Line International Incorporated Church (I). Display/hide their locations on the map
Tourist attractions (not listed on the city page) : Gifts unlimited (Cultural Attractions- Events- & Facilities; 1404 E. 52nd St.), C & P Catalyst (Tours & Charters; 3121 East 33rd Street), World Travel Service- LLC (Tours & Charters; 5727 South Lewis Avenue).
2,971 married couples with children.
1,782 single-parent households (344 men, 1,438 women).
94.2% of residents of 74105 zip code speak English at home.
3.9% of residents speak Spanish at home (78% very well, 9% well, 10% not well, 2% not at all).
0.7% of residents speak other Indo-European language at home (85% very well, 15% well).
0.7% of residents speak Asian or Pacific Island language at home (74% very well, 25% well, 1% not well).
0.4% of residents speak other language at home (94% very well, 6% well).
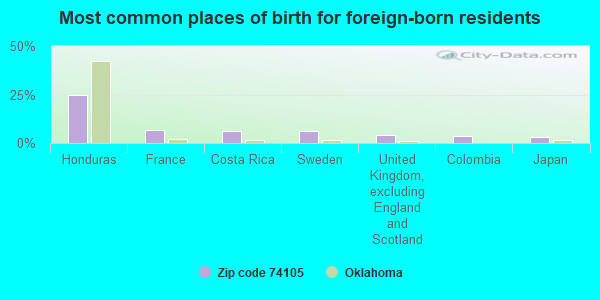
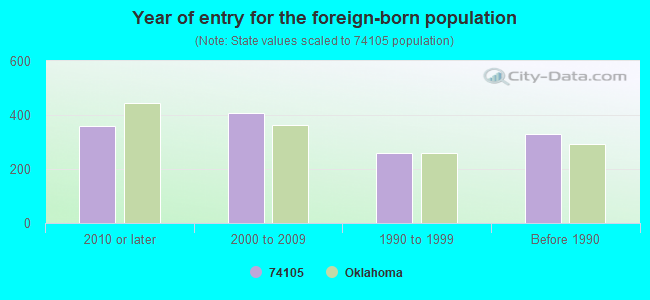
Foreign born population: 1,109 (4.1%) (59.1% of them are naturalized citizens)
Major facilities with environmental interests located in this zip code:
GRIMES ES (3213 E 56TH STREET TULSA in TULSA, OK)
AIR MONITORING SITE (Airborne pollution emission tracking) (National Center for Education Statistics) - STATE ID-72-I001-199 Organizations: TULSA (SCHOOL DISTRICT)
EDISON PREPARATORY MS (2906 E.41 STREET in TULSA, OK)
(National Center for Education Statistics) - STATE ID-72-I001-537 Organizations: TULSA (SCHOOL DISTRICT)
ELIOT ES (1442 EAST 36TH STREET in TULSA, OK)
(National Center for Education Statistics) - STATE ID-72-I001-175 Organizations: TULSA (SCHOOL DISTRICT)
MARSHALL ES (1142 E. 56TH STREET in TULSA, OK)
(National Center for Education Statistics) - STATE ID-72-I001-310 Organizations: TULSA (SCHOOL DISTRICT)
CALUMET OIL CO (2455 E 51ST ST STE 101 in TULSA, OK)
(Integrated Compliance Information System) - ICIS-06-1995-0278, FORMAL ENFORCEMENT ACTION Business SIC classification: CRUDE PETROLEUM AND NATURAL GAS
CLAIRBORNE DX (3535 S PEORIA in TULSA, OK)
(Resource Conservation and Recovery Act (tracking hazardous waste)) Organizations: RAY & WES CLAIBORNE (CONTACT/OWNER)
(Resource Conservation and Recovery Act (tracking hazardous waste)) Organizations: S J WHITMAN (CONTACT/OWNER)
AM LAUNDRY LLC BLUE/1810 E 51ST ST (BLUE (1810 E 51ST ST in TULSA, OK) . Tribal Land
AIR MINOR (AIRS/AFS) Business SIC classification: DRYCLEANING PLANTS, EXCEPT RUG CLEANING Alternative names: AM LAUNDRY LIMITED LIABILITY COMPANY D 1810 E 51ST SAINT, BLUE MONDAY DRY CLEANERS
DJB ENTERPRISES OLD VILLAGE CLEANERS (3723 SOUTH PEORIA AVENUE in TULSA, OK)
AIR SYNTHETIC MINOR (AIRS/AFS) Conditionally Exempt Small Quantity Generators, less than 100 kg/month of hazardous waste (Resource Conservation and Recovery Act (tracking hazardous waste)) - notification Business SIC classification: DRYCLEANING PLANTS, EXCEPT RUG CLEANING Organizations: RICHARD & BEATY FAMILY (CONTACT/OWNER)
ESB INC (3726 S PEORIA in TULSA, OK)
(Resource Conservation and Recovery Act (tracking hazardous waste))
GRINDSTAFF CLNRS/4427 E 31ST ST (GRIN (4427 E. 31ST ST. in TULSA, OK)
AIR SYNTHETIC MINOR (AIRS/AFS) Conditionally Exempt Small Quantity Generators, less than 100 kg/month of hazardous waste (Resource Conservation and Recovery Act (tracking hazardous waste)) - notification Business SIC classification: DRYCLEANING PLANTS, EXCEPT RUG CLEANING Organizations: GRINSTAFF,KEN & GRINDSTAFF,LARRY (CONTACT/OWNER)
Alternative names: GRINDSTAFF CLEANERS, GRINDSTAFF CLEANERS 4427 E 31ST SAINT
AJS TRANSMISSIONS (4410 S PEORIA in TULSA, OK)
Conditionally Exempt Small Quantity Generators, less than 100 kg/month of hazardous waste (Resource Conservation and Recovery Act (tracking hazardous waste)) - notification Organizations: AJS AUTO INC (CONTACT/OWNER)
Housing units lacking complete plumbing facilities: 0.7% Housing units lacking complete kitchen facilities: 1.9%
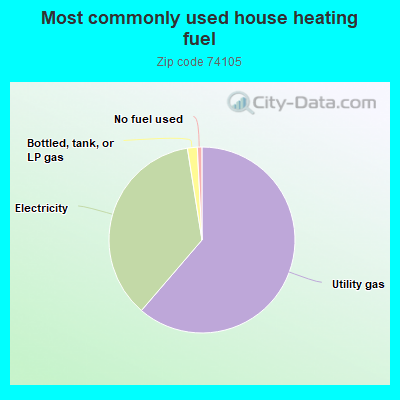
61.3%Utility gas
36.2%Electricity
1.7%Bottled, tank, or LP gas
0.8%No fuel used
Population in 1990: 29,466.
Place of birth for U.S.-born residents:
This state: 14,647
Northeast: 1,026
Midwest: 3,600
South: 3,817
West: 2,354
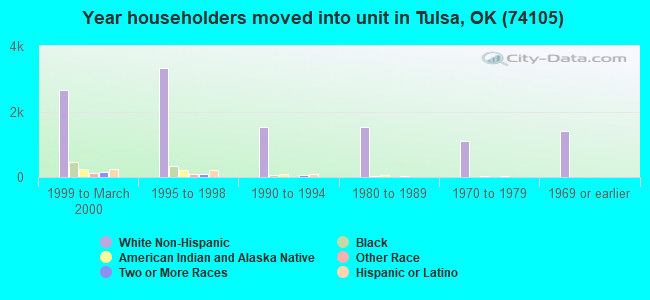
48% of the 74105 zip code residents lived in the same house 5 years ago. Out of people who lived in different houses, 61% lived in this county. Out of people who lived in different counties, 50% lived in Oklahoma.
85% of the 74105 zip code residents lived in the same house 1 year ago. Out of people who lived in different houses, 54% moved from this county. Out of people who lived in different houses, 15% moved from different county within same state. Out of people who lived in different houses, 24% moved from different state. Out of people who lived in different houses, 5% moved from abroad.
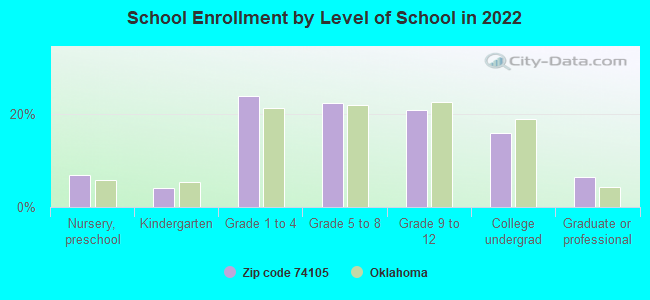
Private vs. public school enrollment:
Students in private schools in grades 1 to 8 (elementary and middle school): 849
Here:
36.5%
Oklahoma:
11.7%
Students in private schools in grades 9 to 12 (high school): 448
Here:
43.7%
Oklahoma:
11.7%
Students in private undergraduate colleges: 374
Here:
45.2%
Oklahoma:
19.3%
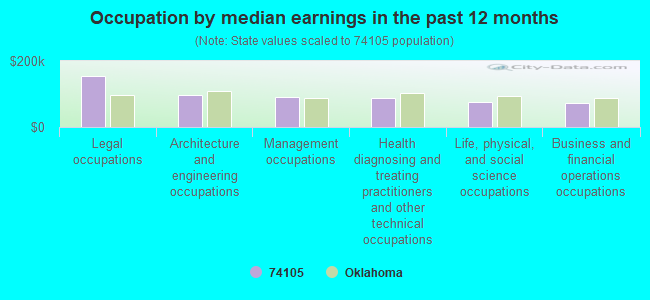
Occupation by median earnings in the past 12 months ($)
155,908Legal occupations
96,402Architecture and engineering occupations
89,655Management occupations
87,074Health diagnosing and treating practitioners and other technical occupations
76,959Life, physical, and social science occupations
72,095Business and financial operations occupations
Companies with federal contracts located in this zip code:
CHEM-MET SERVICES INC (1326 E 43RD COURT in TULSA, MI) : $8,178,294 in 842 contractsfrom 1999 to 2006
Contracts for Waste Treatment and Storage, Hazardous Substance Removal, Cleanup, and Disposal Services and Operational Support by Defense Logistics Agency Signed by year:2000: $1,480,823; 2001: $1,246,045; 2002: $1,824,665; 2003: $240,527; 2004: $1,476,160; 2005: $1,752,967; 2006: $37,477.
Biggest contracts:
$4,026,250 with Defense Logistics Agency for Waste Treatment and Storage. Taking place in FL. Signed on 2004-01-27. Completion date: 2004-01-30.
$315,000 with Defense Logistics Agency for Hazardous Substance Removal, Cleanup, and Disposal Services and Operational Support. Taking place in VA. Signed on 2000-03-08. Completion date: 2000-03-29.
$302,443 with Defense Logistics Agency for Hazardous Substance Removal, Cleanup, and Disposal Services and Operational Support. Taking place in CA. Signed on 2002-04-25. Completion date: 2002-05-10.
$266,085 with Defense Logistics Agency for Hazardous Substance Removal, Cleanup, and Disposal Services and Operational Support. Taking place in FL. Signed on 2002-04-29. Completion date: 2002-05-29.
CLEAR CREEK PROPERTIES, INC (5800 S LEWIS AVE STE 167 in TULSA, OK; small business)
$27,375 with U.S. Army Corps of Engineers - civil program financing only for Maintenance, Repair or Alteration of Real Property -- Other Industrial Buildings. Signed on 2000-02-29. Completion date: 2000-04-14.
NORIA CORPORATION (1328 E 43RD COURT in TULSA, OK; small business)
$12,200 with Army for Program Review/Development Services. Taking place in AL. Signed on 2005-05-12. Completion date: 2005-07-29.
Jack Cowley Institute Program (3807 GH S Peoria in Tulsa, ok; small business)
$5,500 with Bureau of Prisoners/Federal Prison System for Educational Services. Taking place in KS. Signed on 2005-03-03. Completion date: 2005-06-26.
HEATHERWOOD APARTMENTS (3006 E 51ST in TULSA, OK; small business) : $1,600 in 4 contractsin 2004
$800 with Army for Other Administrative Support Services. Signed on 2004-01-27. Completion date: 2004-01-23.
$800 with U.S. Army Corps of Engineers - civil program financing only for Other Administrative Support Services. Signed on 2004-01-27. Completion date: 2004-01-23.
$0 with Army for Other Administrative Support Services. Signed on 2004-01-27. Completion date: 2004-01-23.
$0 with U.S. Army Corps of Engineers - civil program financing only for Other Administrative Support Services. Signed on 2004-01-27. Completion date: 2004-01-23.
Top industries in this zip code by the number of employees in 2005:
Administrative and Support and Waste Management and Remediation Services: Temporary Help Services (250-499 employees: 3 establishments, 100-249 employees: 5 establishments, 50-99 employees: 1 establishment, 20-49 employees: 4 establishments, 10-19 employees: 1 establishment, 1-4 employees: 3 establishments)
2002 - 2018 National Fire Incident Reporting System (NFIRS) incidents
According to the data from the years 2002 - 2018 the average number of fires per year is 100. The highest number of reported fire incidents - 130 took place in 2006, and the least - 69 in 2012. The data has a decreasing trend.
When looking into fire subcategories, the most reports belonged to: Outside Fires (42.7%), and Structure Fires (34.1%).
Fire incident types reported to NFIRS in Zip Code 74105


 Nearest zip codes: 74114, 74135, 74136, 74104, 74119, 74120.


 According to the data from the years 2002 - 2018 the average number of fires per year is 100. The highest number of reported fire incidents - 130 took place in 2006, and the least - 69 in 2012. The data has a decreasing trend.
 When looking into fire subcategories, the most reports belonged to: Outside Fires (42.7%), and Structure Fires (34.1%).