Estimated zip code population in 2022: 14,935 Zip code population in 2010: 14,862 Zip code population in 2000: 15,267
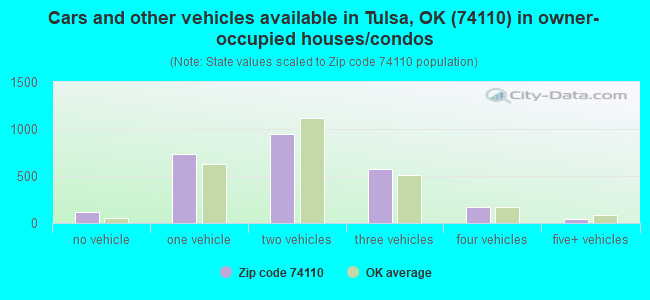
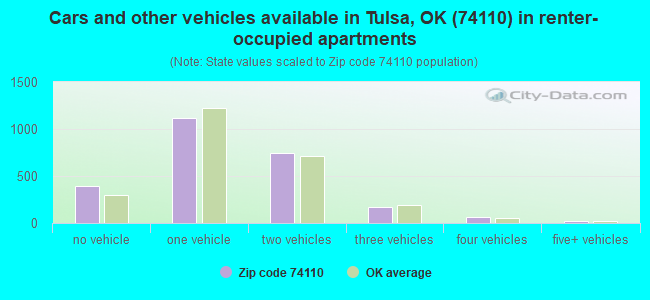
Houses and condos: 5,983 Renter-occupied apartments: 2,500
% of renters here:
49%
State:
35%
March 2022 cost of living index in zip code 74110: 84.9 (less than average, U.S. average is 100)
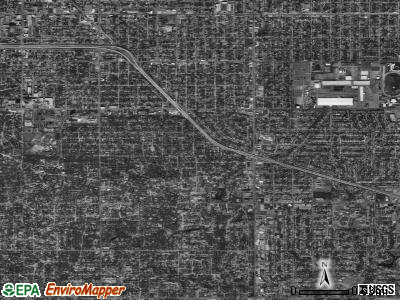
Land area: 5.9 sq. mi. Water area: 0.0 sq. mi.
Population density: 2,524 people per square mile
(average).
OSM Map
General Map
Google Map
MSN Map
OSM Map
General Map
Google Map
MSN Map
OSM Map
General Map
Google Map
MSN Map
OSM Map
General Map
Google Map
MSN Map
Please wait while loading the map...
Real estate property taxes paid for housing units in 2022:
This zip code:
0.9% ($620)
Oklahoma:
0.8% ($1,501)
Median real estate property taxes paid for housing units with mortgages in 2022: $995 (1.1%) Median real estate property taxes paid for housing units with no mortgage in 2022: $528 (0.9%)
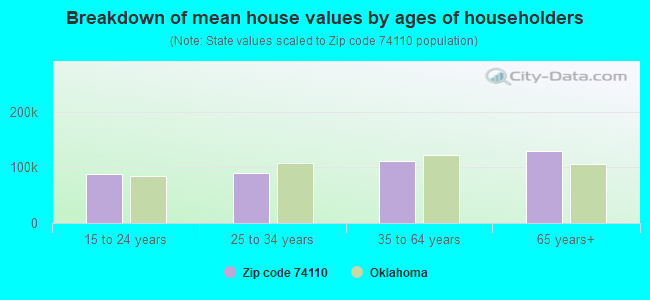
Estimated median house/condo value in 2022: $68,023
74110:
$68,023
Oklahoma:
$191,700
According to our research of Oklahoma and other state lists, there were 16 registered sex offenders living in 74110 zip code as of April 27, 2024. The ratio of all residents to sex offenders in zip code 74110 is 932 to 1. The ratio of registered sex offenders to all residents in this zip code is lower than the state average.
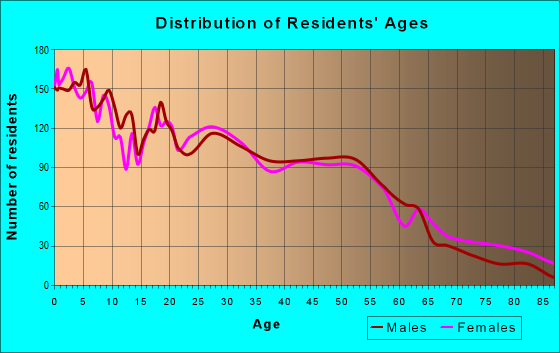
Median resident age:
This zip code:
31.2 years
Oklahoma median age:
37.1 years
Average household size:
This zip code:
2.9 people
Oklahoma:
2.5 people
Averages for the 2020 tax year for zip code 74110, filed in 2021:
Average Adjusted Gross Income (AGI) in 2020: $27,604 (Individual Income Tax Returns)
Here:
$27,604
State:
$63,060
Salary/wage: $26,567 (reported on 85.1% of returns)
Here:
$26,567
State:
$52,427
(% of AGI for various income ranges: 1161.4% for AGIs below $25k, 3625.0% for AGIs $25k-50k, 6959.7% for AGIs $50k-75k, 11068.8% for AGIs $75k-100k, 16062.5% for AGIs $100k-200k)
Taxable interest for individuals: $366 (reported on 7.5% of returns)
This zip code:
$366
Oklahoma:
$1,603
(% of AGI for various income ranges: 2.7% for AGIs below $25k, 2.5% for AGIs $25k-50k, 8.6% for AGIs $50k-75k, 3.8% for AGIs $75k-100k, 40.0% for AGIs $100k-200k)
Ordinary dividends: $588 (reported on 1.5% of returns)
Here:
$588
State:
$7,001
(% of AGI for various income ranges: 0.2% for AGIs below $25k, 2.0% for AGIs $25k-50k, 3.1% for AGIs $50k-75k)
Net capital gain/loss in AGI: +$1,114 (reported on 1.3% of returns)
Here:
+$1,114
State:
+$19,855
(% of AGI for various income ranges: 2.8% for AGIs $25k-50k, 9.7% for AGIs $50k-75k)
Profit/loss from business: +$9,234 (reported on 18.6% of returns)
Here:
+$9,234
State:
+$9,904
(% of AGI for various income ranges: 235.7% for AGIs below $25k, 172.1% for AGIs $25k-50k, 82.0% for AGIs $50k-75k, 1068.8% for AGIs $75k-100k)
Taxable individual retirement arrangement distribution: $8,020 (reported on 1.8% of returns)
74110:
$8,020
Oklahoma:
$20,476
(% of AGI for various income ranges: 10.4% for AGIs below $25k, 23.6% for AGIs $25k-50k, 54.9% for AGIs $50k-75k)
Total itemized deductions: $32,740 (reported on 0.9% of returns)
Here:
$32,740
State:
$39,736
(% of AGI for various income ranges: 52.8% for AGIs $25k-50k, 1023.8% for AGIs $75k-100k)
Charity contributions: $10,950 (reported on 0.7% of returns)
Here:
$10,950
State:
$17,288
(% of AGI for various income ranges: 125.1% for AGIs $50k-75k)
Taxes paid: $4,240 (reported on 0.9% of returns)
74110:
$4,240
State:
$7,046
(% of AGI for various income ranges: 5.5% for AGIs $25k-50k, 157.5% for AGIs $75k-100k)
Earned income credit: $2,823 (reported on 35.8% of returns)
Here:
$2,823
State:
$2,435
(% of AGI for various income ranges: 162.1% for AGIs below $25k, 109.7% for AGIs $25k-50k, 3.4% for AGIs $50k-75k)
Percentage of individuals using paid preparers for their 2020 taxes: 92.3%
Here:
92%
State:
94%
(% for various income ranges: 91.8% for AGIs below $25k, 94.1% for AGIs $25k-50k, 89.4% for AGIs $50k-75k, 92.3% for AGIs $75k-100k, 85.7% for AGIs $100k-200k)
Averages for the 2012 tax year for zip code 74110, filed in 2013:
Average Adjusted Gross Income (AGI) in 2012: $25,507 (Individual Income Tax Returns)
Here:
$25,507
State:
$58,581
Salary/wage: $24,259 (reported on 89.3% of returns)
Here:
$24,259
State:
$45,973
(% of AGI for various income ranges: 81.9% for AGIs below $25k, 92.4% for AGIs $25k-50k, 85.6% for AGIs $50k-75k, 80.9% for AGIs $75k-100k, 53.0% for AGIs $100k-200k)
Taxable interest for individuals: $478 (reported on 8.6% of returns)
This zip code:
$478
Oklahoma:
$1,625
(% of AGI for various income ranges: 0.2% for AGIs below $25k, 0.3% for AGIs $50k-75k, 0.2% for AGIs $75k-100k, 0.3% for AGIs $100k-200k)
Ordinary dividends: $1,991 (reported on 2.1% of returns)
Here:
$1,991
State:
$6,374
(% of AGI for various income ranges: 0.3% for AGIs $25k-50k, 0.2% for AGIs $50k-75k)
Profit/loss from business: +$8,433 (reported on 14.9% of returns)
Here:
+$8,433
State:
+$11,913
(% of AGI for various income ranges: 12.0% for AGIs below $25k, 2.0% for AGIs $25k-50k, 0.8% for AGIs $50k-75k, 4.4% for AGIs $75k-100k)
Taxable individual retirement arrangement distribution: $8,457 (reported on 2.7% of returns)
74110:
$8,457
Oklahoma:
$15,242
(% of AGI for various income ranges: 0.6% for AGIs below $25k, 0.6% for AGIs $25k-50k, 2.9% for AGIs $50k-75k)
Total itemized deductions: $17,643 (26% of AGI, reported on 5.4% of returns)
Here:
$17,643
State:
$24,882
Here:
26.0% of AGI
State:
18.8% of AGI
(% of AGI for various income ranges: 1.3% for AGIs below $25k, 2.4% for AGIs $25k-50k, 6.7% for AGIs $50k-75k, 9.8% for AGIs $75k-100k, 11.2% for AGIs $100k-200k)
Charity contributions: $4,362 (reported on 4.0% of returns)
Here:
$4,362
State:
$6,591
(% of AGI for various income ranges: 0.2% for AGIs below $25k, 0.5% for AGIs $25k-50k, 1.4% for AGIs $50k-75k, 2.3% for AGIs $75k-100k, 1.4% for AGIs $100k-200k)
Taxes paid: $3,082 (reported on 5.4% of returns)
74110:
$3,082
State:
$7,196
(% of AGI for various income ranges: 0.1% for AGIs below $25k, 0.4% for AGIs $25k-50k, 1.2% for AGIs $50k-75k, 2.2% for AGIs $75k-100k, 2.0% for AGIs $100k-200k)
Earned income credit: $2,705 (reported on 40.8% of returns)
Here:
$2,705
State:
$2,354
(% of AGI for various income ranges: 11.4% for AGIs below $25k, 1.8% for AGIs $25k-50k)
Percentage of individuals using paid preparers for their 2012 taxes: 57.5%
Here:
57%
State:
56%
(% for various income ranges: 55.5% for AGIs below $25k, 59.5% for AGIs $25k-50k, 60.0% for AGIs $50k-75k, 62.5% for AGIs $75k-100k, 100.0% for AGIs $100k-200k)
Averages for the 2004 tax year for zip code 74110, filed in 2005:
Average Adjusted Gross Income (AGI) in 2004: $20,551 (Individual Income Tax Returns)
Here:
$20,551
State:
$41,245
Salary/wage: $20,157 (reported on 90.2% of returns)
Here:
$20,157
State:
$35,318
(% of AGI for various income ranges: 85.0% for AGIs below $10k, 89.3% for AGIs $10k-25k, 92.8% for AGIs $25k-50k, 86.7% for AGIs $50k-75k, 79.9% for AGIs $75k-100k, 44.2% for AGIs over 100k)
Taxable interest for individuals: $995 (reported on 13.9% of returns)
This zip code:
$995
Oklahoma:
$1,745
(% of AGI for various income ranges: 1.3% for AGIs below $10k, 0.7% for AGIs $10k-25k, 0.5% for AGIs $25k-50k, 1.0% for AGIs $50k-75k, 0.4% for AGIs $75k-100k, 1.2% for AGIs over 100k)
Taxable dividends: $872 (reported on 3.8% of returns)
Here:
$872
State:
$2,920
(% of AGI for various income ranges: 0.3% for AGIs below $10k, 0.2% for AGIs $10k-25k, 0.2% for AGIs $25k-50k, 0.1% for AGIs $50k-75k, 0.4% for AGIs $75k-100k)
Net capital gain/loss: +$515 (reported on 2.2% of returns)
Here:
+$515
State:
+$10,653
(% of AGI for various income ranges: 0.4% for AGIs below $10k, -0.1% for AGIs $10k-25k, 0.0% for AGIs $25k-50k, 0.3% for AGIs $50k-75k, 0.0% for AGIs $75k-100k)
Profit/loss from business: +$4,125 (reported on 10.3% of returns)
Here:
+$4,125
State:
+$8,532
(% of AGI for various income ranges: 10.7% for AGIs below $10k, 3.0% for AGIs $10k-25k, 0.8% for AGIs $25k-50k, -0.4% for AGIs $50k-75k)
IRA payment deduction: $1,944 (reported on 0.8% of returns)
74110:
$1,944
Oklahoma:
$3,127
Total itemized deductions: $12,099 (27% of AGI, reported on 9.6% of returns)
Here:
$12,099
State:
$17,093
Here:
27.4% of AGI
State:
20.5% of AGI
(% of AGI for various income ranges: 2.5% for AGIs below $10k, 2.5% for AGIs $10k-25k, 5.6% for AGIs $25k-50k, 11.2% for AGIs $50k-75k, 14.5% for AGIs $75k-100k, 17.7% for AGIs over 100k)
Charity contributions deductions: $3,361 (7% of AGI, reported on 7.8% of returns)
Here:
$3,361
State:
$4,240
Here:
7.3% of AGI
State:
4.8% of AGI
(% of AGI for various income ranges: 0.4% for AGIs below $10k, 0.5% for AGIs $10k-25k, 1.2% for AGIs $25k-50k, 3.2% for AGIs $50k-75k, 4.2% for AGIs $75k-100k, 3.0% for AGIs over 100k)
Total tax: $2,041 (reported on 49.3% of returns)
74110:
$2,041
State:
$6,542
(% of AGI for various income ranges: 2.4% for AGIs below $10k, 2.6% for AGIs $10k-25k, 5.0% for AGIs $25k-50k, 8.2% for AGIs $50k-75k, 10.7% for AGIs $75k-100k, 16.2% for AGIs over 100k)
Earned income credit: $1,985 (reported on 41.5% of returns)
Here:
$1,985
State:
$1,830
Percentage of individuals using paid preparers for their 2004 taxes: 68.3%
Here:
68%
State:
63%
(% for various income ranges: 69.0% for AGIs below $10k, 70.2% for AGIs $10k-25k, 65.4% for AGIs $25k-50k, 64.2% for AGIs $50k-75k, 66.0% for AGIs $75k-100k, 63.2% for AGIs over 100k)
Likely homosexual households (counted as self-reported same-sex unmarried-partner households)
Lesbian couples: 0.0% of all households
Gay men: 0.1% of all households
Household received Food Stamps/SNAP in the past 12 months: 1,860 Household did not receive Food Stamps/SNAP in the past 12 months: 3,370
Women who had a birth in the past 12 months: 185 (72 now married, 108 unmarried) Women who did not have a birth in the past 12 months: 3,759 (1,286 now married, 2,473 unmarried)
Housing units in zip code 74110 with a mortgage: 847 (15 second mortgage, 11 both second mortgage and home equity loan) Median monthly owner costs for units with a mortgage: $927 Median monthly owner costs for units without a mortgage: $331
Residents with income below the poverty level in 2022:
This zip code:
33.9%
Whole state:
15.7%
Residents with income below 50% of the poverty level in 2022:
This zip code:
17.3%
Whole state:
8.3%
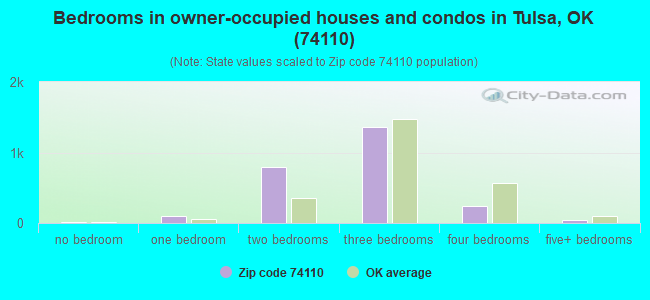
Median number of rooms in houses and condos:
Here:
5.4
State:
6.1
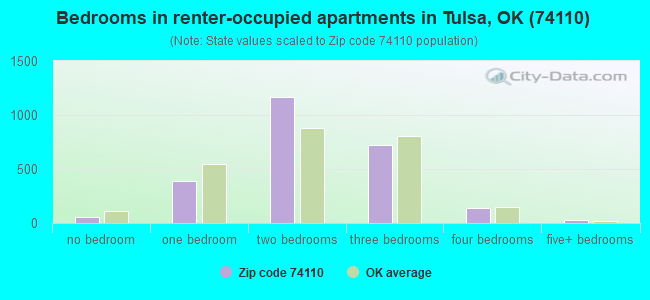
Median number of rooms in apartments:
Here:
4.8
State:
4.5
Notable locations in this zip code not listed on our city pages
Churches in zip code 74110 include: Victory Tabernacle Church of God (A), United Pentecostal Church (B), Tulsa Indian Methodist Church (C), Tabernacle Church of God (D), Saint Peter Baptist Church (E), Saint Paul Trinity Church (F), Springdale Church of God (G), Springdale Baptist Church (H), Lewis Avenue Assembly of God Church (I). Display/hide their locations on the map
Parks in zip code 74110 include: Clinton Park (1), Admiral Park (2), Archer Playground (3), Springdale Playground (4). Display/hide their locations on the map
2,267 married couples with children.
1,622 single-parent households (365 men, 1,257 women).
65.9% of residents of 74110 zip code speak English at home.
33.7% of residents speak Spanish at home (53% very well, 22% well, 18% not well, 7% not at all).
0.2% of residents speak other Indo-European language at home (80% very well, 7% not well, 13% not at all).
0.4% of residents speak Asian or Pacific Island language at home (55% very well, 45% well).
0.4% of residents speak other language at home (78% very well, 22% well).
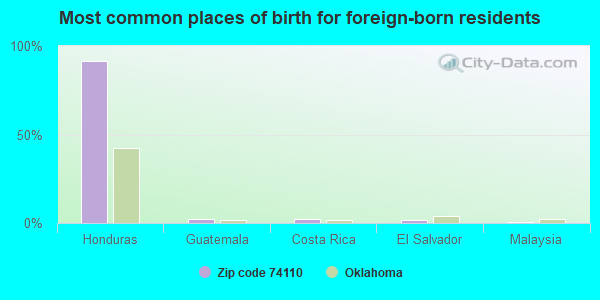
Foreign born population: 2,250 (15.1%) (19.1% of them are naturalized citizens)
Major facilities with environmental interests located in this zip code:
CROSBY MCKISSICK (2857 DAWSON ROAD in TULSA, OK)
AIR MINOR (AIRS/AFS) CRITERIA AND HAZARDOUS AIR POLLUTANT INVENTORY (Inventory of air pollution sources) HAZARDOUS WASTE BIENNIAL REPORTER (Resource Conservation and Recovery Act (tracking hazardous waste)) Large Quantity Generators, more that 1000 kg of hazardous waste/month (Resource Conservation and Recovery Act (tracking hazardous waste)) - notification TRI REPORTER (Tracking of toxic chemicals releasing facilities) Business SIC classification: METAL STAMPINGS; COATING, ENGRAVING, AND ALLIED SERVICES Business NAICS classification: ALL OTHER MISCELLANEOUS FABRICATED METAL PRODUCT MANUFACTURING. Organizations: CROSBY GROUP - MCKISSICK PRODUCTS (CONTACT/OPERATOR)
, FKI PLC (CONTACT/OWNER)
Alternative names: CROSBY GROUP, MCKISSICK, CROSBY GROUP MCKISSICK PLANT
ALPHA INVESTMENT CASTINGS COMPANY (2441 E. INDEPENDENCE in TULSA, OK) . Tribal Land
AIR MINOR (AIRS/AFS) (Resource Conservation and Recovery Act (tracking hazardous waste)) TRI REPORTER (Tracking of toxic chemicals releasing facilities) Business SIC classification: STEEL INVESTMENT FOUNDRIES; STEEL FOUNDRIES Business NAICS classification: STEEL INVESTMENT FOUNDRIES.; NONFERROUS (EXCEPT ALUMINUM) DIE-CASTING FOUNDRIES. Organizations: UNKNOWN (CONTACT/OWNER)
Alternative names: ALPHA INVESTMENT CA/ALPHA INVESTMENT CAS
ANDERSON ES (1921 EAST 29TH STREET in TULSA, OK)
(National Center for Education Statistics) - STATE ID-72-I001-111 Organizations: TULSA (SCHOOL DISTRICT)
BORG COMPRESSED STEEL (1032 NORTH LEWIS AVENUE in TULSA, OK)
AIR MINOR (AIRS/AFS) National Pollutant Discharge Elimination System NON-MAJOR (Tracking pollutant discharge elimination systems) - permit Conditionally Exempt Small Quantity Generators, less than 100 kg/month of hazardous waste (Resource Conservation and Recovery Act (tracking hazardous waste)) - notification Business SIC classification: ALUMINUM ROLLING AND DRAWING Organizations: HARRY SWARTZ (CONTACT/OWNER)
Alternative names: BORG COMP STEEL CORP, BORG COMPRESSED STE 1032 N LEWIS ALUMI, BORG COMPRESSED STE/1032 N LEWIS ALUMINU
CLEVELAND MS (724 N. BIRMINGHAM AVE in TULSA, OK)
(National Center for Education Statistics) - STATE ID-72-I001-525 Organizations: TULSA (SCHOOL DISTRICT)
LINDSEY ES (2740 E. 41 ST. N. in TULSA, OK)
(National Center for Education Statistics) - STATE ID-72-I001-280 Organizations: TULSA (SCHOOL DISTRICT)
CREATIVE MAILING AN/7041 E 15TH ST (7041 EAST 15TH STREET in TULSA, OK)
AIR MINOR (AIRS/AFS) (Resource Conservation and Recovery Act (tracking hazardous waste)) Business SIC classification: COMMERCIAL PRINTING Business NAICS classification: ALL OTHER MISCELLANEOUS MANUFACTURING. Organizations: SOURCECORP (CONTACT/OWNER)
Alternative names: F Y I DIRECT, FYI DIRECT DBA GLOBAL DIRECT INC, FYI DIRECT DBA GLOBAL DIRECT INC, SOURCECORP
DOLPHIN MANUFACTURING (2929 EAST APACHE STREET in TULSA, OK) . Tribal Land
CRITERIA AND HAZARDOUS AIR POLLUTANT INVENTORY (Inventory of air pollution sources) (Resource Conservation and Recovery Act (tracking hazardous waste)) TRI REPORTER (Tracking of toxic chemicals releasing facilities) Business SIC classification: WOOD OFFICE AND STORE FIXTURES, PARTITIONS, SHELVING, AND LOCKERS; FURNITURE AND FIXTURES Business NAICS classification: ALL OTHER MISCELLANEOUS GENERAL PURPOSE MACHINERY MANUFACTURING.; ALL OTHER MOTOR VEHICLE PARTS MANUFACTURING. Organizations: PUROLATOR PRODUCTS CO (CONTACT/OWNER)
ACCURATE MANUFACTURING INC (18 N PEORIA in TULSA, OK)
(Resource Conservation and Recovery Act (tracking hazardous waste)) Organizations: GCGF TOM HANCOCK (CONTACT/OWNER)
ARROW SPECIALTY CO. (2301 E INDEPENDENCE in TULSA, OK) . Tribal Land
FACET INTERNATIONAL, INC. (2929 E. APACHE ST. in TULSA, OK)
STATE MASTER (Oklahoma environmental compliance activities data) National Pollutant Discharge Elimination System NON-MAJOR (Tracking pollutant discharge elimination systems) - permit Business SIC classification: LABORATORY ANALYTICAL INSTRUMENTS
Housing units lacking complete plumbing facilities: 6.6% Housing units lacking complete kitchen facilities: 7.8%
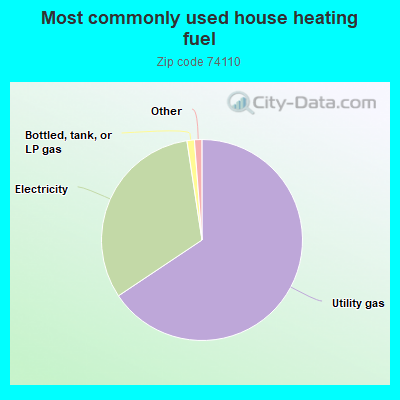
65.7%Utility gas
32.0%Electricity
1.2%Bottled, tank, or LP gas
Population in 1990: 14,224. Population change in the 1990s: +1,043 (+7.3%).
Place of birth for U.S.-born residents:
This state: 9,271
Northeast: 161
Midwest: 784
South: 1,057
West: 1,162
45% of the 74110 zip code residents lived in the same house 5 years ago. Out of people who lived in different houses, 77% lived in this county. Out of people who lived in different counties, 50% lived in Oklahoma.
87% of the 74110 zip code residents lived in the same house 1 year ago. Out of people who lived in different houses, 67% moved from this county. Out of people who lived in different houses, 15% moved from different county within same state. Out of people who lived in different houses, 6% moved from different state. Out of people who lived in different houses, 6% moved from abroad.
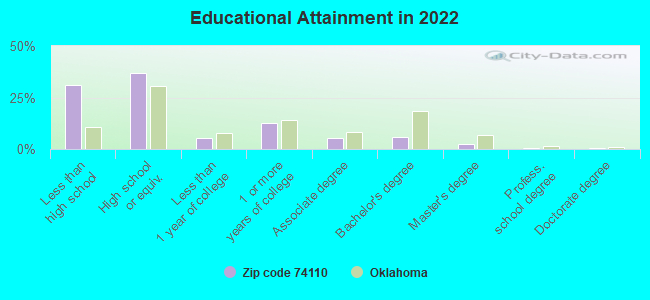
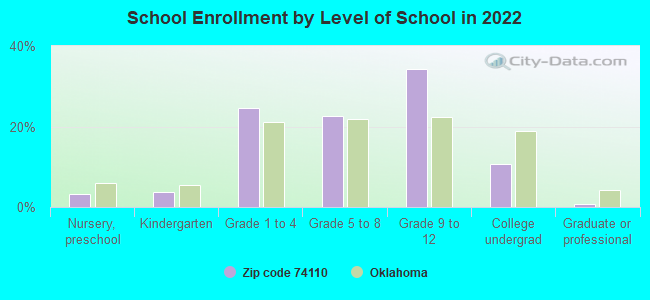
Private vs. public school enrollment:
Students in private schools in grades 1 to 8 (elementary and middle school): 312
Here:
15.3%
Oklahoma:
11.7%
Students in private schools in grades 9 to 12 (high school): 215
Here:
14.7%
Oklahoma:
11.7%
Students in private undergraduate colleges: 99
Here:
21.3%
Oklahoma:
19.3%
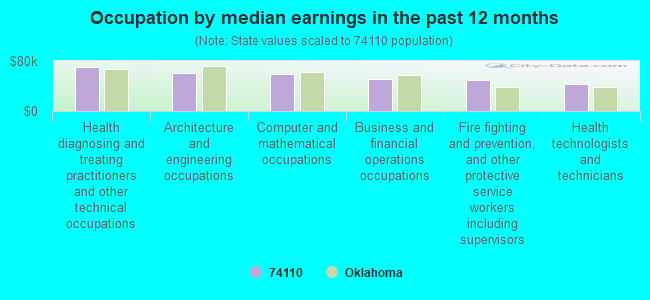
Occupation by median earnings in the past 12 months ($)
70,079Health diagnosing and treating practitioners and other technical occupations
60,592Architecture and engineering occupations
59,006Computer and mathematical occupations
51,746Business and financial operations occupations
50,368Fire fighting and prevention, and other protective service workers including supervisors
43,718Health technologists and technicians
Companies with federal contracts located in this zip code (TULSA, OK):
SPECIALTY COMPONENTS, INC (2444 N COLUMBIA PL) : $465,196 in 73 contractsfrom 2004 to 2006
Contracts for Valves, Nonpowered, Lathes, Miscellaneous Power Transmission Equipment, Hose, Pipe, Tube, Lubrication, and Railing Fittings, and moreby Defense Logistics Agency Signed by year:2000: $0; 2001: $0; 2002: $0; 2003: $0; 2004: $165,692; 2005: $248,771; 2006: $50,733.
Biggest contracts:
$26,586 with Defense Logistics Agency for Valves, Nonpowered. Signed on 2005-12-27. Completion date: 2006-02-20.
$24,504 with Defense Logistics Agency for Lathes. Signed on 2006-01-27. Completion date: 2006-03-29.
$22,500 with Defense Logistics Agency for Miscellaneous Power Transmission Equipment. Signed on 2005-01-06. Completion date: 2005-05-10.
$22,296 with Defense Logistics Agency for Lathes. Signed on 2006-01-14. Completion date: 2006-03-16.
INTERNATIONAL TELECOMMUNICATIO (2703 DAWSON RD; small business) : $393,637 in 6 contractsfrom 2004 to 2005
Contracts for Prefabricated Tower Structures, Miscellaneous Communication Equipment, Aircraft Gunnery Fire Control Components, Meteorological Instruments and Apparatus, and moreby Navy, Army, Research and Innovative Technology Administration, Air Force, and others Signed by year:2000: $0; 2001: $0; 2002: $0; 2003: $0; 2004: $39,306; 2005: $354,331; 2006: $0.
Biggest contracts:
$238,572 with Navy for Prefabricated Tower Structures. Taking place in DC. Signed on 2005-02-04. Completion date: 2005-04-15.
$54,649 with Army for Miscellaneous Communication Equipment. Signed on 2005-06-16. Completion date: 2005-08-05.
$48,728 with Research and Innovative Technology Administration for Aircraft Gunnery Fire Control Components. Signed on 2005-08-04. Completion date: 2005-12-30.
$39,306 with Army for Meteorological Instruments and Apparatus. Taking place in NM. Signed on 2004-09-17. Completion date: 2004-11-01.
VALMONT INDUSTRIES INC (801 N XANTHUS AVE)
$99,790 with Army for Indoor and Outdoor Electric Lighting Fixtures. Signed on 2004-03-15. Completion date: 2004-06-14.
HILL'S JANITORIAL SERVICES (2257 N EVANSTON AVE; small business) : $89,090 in 15 contractsfrom 2003 to 2006
Contracts for Custodial Janitorial Services, Landscaping/Groundskeeping Services by Army, U.S. Army Corps of Engineers - civil program financing only Signed by year:2000: $0; 2001: $0; 2002: $0; 2003: $18,780; 2004: $39,000; 2005: $16,800; 2006: $14,510.
Biggest contracts:
$10,800 with Army for Custodial Janitorial Services. Signed on 2005-12-13. Completion date: 2004-12-31.
$9,960, same as above.Signed on 2004-12-02. Completion date: 2004-12-31.
$9,600, same as above.Signed on 2003-12-12. Completion date: 2004-12-31.
$9,180 with Army for Landscaping/Groundskeeping Services. Signed on 2003-12-01. Completion date: 2004-11-30.
CROSBY GROUP INC (2801 DAWSON RD) : $63,239 in 4 contractsfrom 2004 to 2005
$35,962 with Defense Logistics Agency for Hardware, Weapon System. Signed on 2004-02-09. Completion date: 2004-04-12.
$27,277 with Navy for Hardware, Commercial. Signed on 2004-11-01. Completion date: 2004-12-21.
$5,310 with Army for Bars and Rods. Signed on 2005-12-09. Completion date: 2006-03-31.
-$5,310, same as above.Signed on 2005-12-20. Completion date: 2006-03-31.
BELGER CARTAGE SERVICE, INC (2534 E KING ST; small business) : $39,929 in 5 contractsfrom 2002 to 2004
Contracts for Lease or Rental of Equipment -- Construction, Mining, Excavating, and Highway Maintenance Equipment, Winches, Hoists, Cranes, and Derricks, Other Housekeeping Services, Other Professional Services by U.S. Army Corps of Engineers - civil program financing only, Army Signed by year:2000: $0; 2001: $0; 2002: $28,940; 2003: $0; 2004: $10,989; 2005: $0; 2006: $0.
Biggest contracts:
$28,940 with U.S. Army Corps of Engineers - civil program financing only for Lease or Rental of Equipment -- Construction, Mining, Excavating, and Highway Maintenance Equipment. Signed on 2002-09-24. Completion date: 2002-10-24.
$6,992 with Army for Winches, Hoists, Cranes, and Derricks. Signed on 2004-01-27. Completion date: 2004-01-23.
$3,200 with Army for Other Housekeeping Services. Signed on 2004-10-06. Completion date: 2005-10-01.
$2,750 with Army for Other Professional Services. Signed on 2004-01-06. Completion date: 2004-01-09.
TULSA POWER LLC (913 N WHEELING AVE; small business) : $25,081 in 2 contractsfrom 2003 to 2005
$19,717 with U.S. Army Corps of Engineers - civil program financing only for Miscellaneous Materials Handling Equipment. Taking place in MO. Signed on 2003-03-25. Completion date: 2003-05-07.
$5,364 with Air Force for Miscellaneous Special Industry Machinery. Signed on 2005-02-09. Completion date: 2005-03-25.
CRAIN DISPLAYS & EXHIBITS, INC (2300 NORTH LEWIS; small business)
$9,955 with Army for Signs, Advertising Displays, and Identification Plates. Signed on 2004-04-15. Completion date: 2004-05-05.
JOHN CRANE INC (2931 E APACHE AVE) : $0 in 2 contractsin 2005
$390 with Navy for Hose, Pipe, Tube, Lubrication, and Railing Fittings. Signed on 2005-01-21. Completion date: 2004-12-24.
-$390, same as above.Signed on 2005-02-14. Completion date: 2004-12-24.
Top industries in this zip code by the number of employees in 2005:
Wholesale Trade: Beer and Ale Merchant Wholesalers (250-499 employees: 1 establishment)
Wholesale Trade: Metal Service Centers and Other Metal Merchant Wholesalers (50-99: 2, 20-49: 2, 5-9: 1)
Wholesale Trade: Other Grocery and Related Products Merchant Wholesalers (100-249: 1, 10-19: 1)
Health Care and Social Assistance: Residential Mental Retardation Facilities (50-99: 1, 1-4: 3)
Health Care and Social Assistance: Vocational Rehabilitation Services (50-99: 1, 1-4: 1)
People in group quarters in 2010:
210 people in workers' group living quarters and job corps centers
104 people in nursing facilities/skilled-nursing facilities
33 people in residential treatment centers for adults
8 people in other noninstitutional facilities
People in group quarters in 2000:
248 people in job corps and vocational training facilities
107 people in nursing homes
2 people in schools, hospitals, or wards for the intellectually disabled
Fatal accident statistics in 2014:
Fatal accident count: 4
Vehicles involved in fatal accidents: 5
Fatal accidents caused by drunken drivers: 0
Fatalities: 4
Persons involved in fatal accidents: 9
Pedestrians involved in fatal accidents: 3
Fatal accident statistics in 2013:
Fatal accident count: 2
Vehicles involved in fatal accidents: 4
Fatal accidents caused by drunken drivers: 1
Fatalities: 3
Persons involved in fatal accidents: 5
Pedestrians involved in fatal accidents: 0
Home Mortgage Disclosure Act Aggregated Statistics For Year 2009 (Based on 6 full and 8 partial tracts)
A) FHA, FSA/RHS & VA Home Purchase Loans
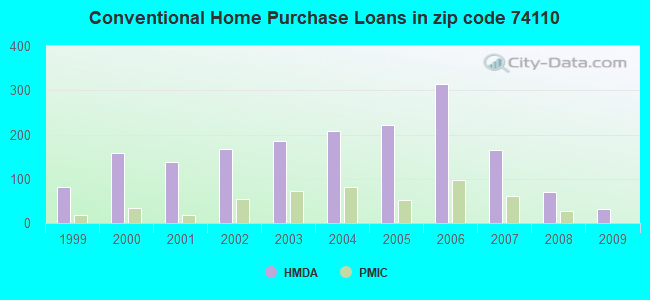
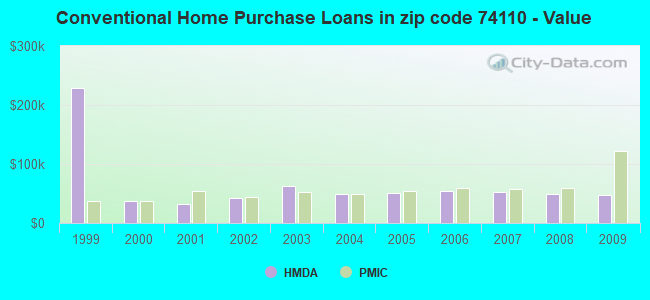
B) Conventional Home Purchase Loans
C) Refinancings
D) Home Improvement Loans
F) Non-occupant Loans on < 5 Family Dwellings (A B C & D)
G) Loans On Manufactured Home Dwelling (A B C & D)
Number
Average Value
Number
Average Value
Number
Average Value
Number
Average Value
Number
Average Value
Number
Average Value
LOANS ORIGINATED
54
$65,050
32
$47,146
85
$79,474
36
$20,673
63
$57,380
2
$2,985
APPLICATIONS APPROVED, NOT ACCEPTED
4
$85,650
0
$0
19
$45,316
3
$26,750
2
$46,120
0
$0
APPLICATIONS DENIED
14
$86,529
26
$52,654
107
$61,199
43
$15,013
24
$42,568
1
$129,200
APPLICATIONS WITHDRAWN
3
$86,700
2
$70,945
47
$86,612
0
$0
6
$124,012
0
$0
FILES CLOSED FOR INCOMPLETENESS
0
$0
0
$0
15
$64,204
2
$5,975
0
$0
0
$0
Aggregated Statistics For Year 2008 (Based on 6 full and 8 partial tracts)
A) FHA, FSA/RHS & VA Home Purchase Loans
B) Conventional Home Purchase Loans
C) Refinancings
D) Home Improvement Loans
E) Loans on Dwellings For 5+ Families
F) Non-occupant Loans on < 5 Family Dwellings (A B C & D)
G) Loans On Manufactured Home Dwelling (A B C & D)
Number
Average Value
Number
Average Value
Number
Average Value
Number
Average Value
Number
Average Value
Number
Average Value
Number
Average Value
LOANS ORIGINATED
51
$68,693
70
$49,026
91
$79,838
41
$14,892
4
$242,515
92
$68,802
0
$0
APPLICATIONS APPROVED, NOT ACCEPTED
3
$50,833
3
$46,097
20
$40,524
3
$26,187
0
$0
4
$49,705
1
$87,990
APPLICATIONS DENIED
10
$60,304
46
$53,714
139
$61,783
72
$34,472
0
$0
40
$34,152
3
$60,440
APPLICATIONS WITHDRAWN
9
$65,034
7
$57,091
45
$78,769
10
$71,184
0
$0
15
$37,631
0
$0
FILES CLOSED FOR INCOMPLETENESS
4
$96,452
1
$29,480
15
$62,513
3
$51,720
0
$0
8
$48,309
0
$0
Aggregated Statistics For Year 2007 (Based on 6 full and 8 partial tracts)
A) FHA, FSA/RHS & VA Home Purchase Loans
B) Conventional Home Purchase Loans
C) Refinancings
D) Home Improvement Loans
E) Loans on Dwellings For 5+ Families
F) Non-occupant Loans on < 5 Family Dwellings (A B C & D)
G) Loans On Manufactured Home Dwelling (A B C & D)
Number
Average Value
Number
Average Value
Number
Average Value
Number
Average Value
Number
Average Value
Number
Average Value
Number
Average Value
LOANS ORIGINATED
21
$63,242
165
$52,900
165
$49,566
36
$20,358
6
$411,017
139
$44,869
0
$0
APPLICATIONS APPROVED, NOT ACCEPTED
1
$116,950
19
$57,653
31
$49,807
9
$30,608
0
$0
8
$48,678
4
$58,305
APPLICATIONS DENIED
8
$87,785
67
$63,970
239
$55,892
111
$27,304
0
$0
91
$46,818
5
$72,508
APPLICATIONS WITHDRAWN
1
$107,640
23
$70,702
68
$56,398
23
$29,853
0
$0
22
$51,132
3
$47,740
FILES CLOSED FOR INCOMPLETENESS
0
$0
14
$64,516
25
$71,965
1
$55,420
0
$0
9
$54,929
0
$0
Aggregated Statistics For Year 2006 (Based on 6 full and 8 partial tracts)
A) FHA, FSA/RHS & VA Home Purchase Loans
B) Conventional Home Purchase Loans
C) Refinancings
D) Home Improvement Loans
E) Loans on Dwellings For 5+ Families
F) Non-occupant Loans on < 5 Family Dwellings (A B C & D)
G) Loans On Manufactured Home Dwelling (A B C & D)
Number
Average Value
Number
Average Value
Number
Average Value
Number
Average Value
Number
Average Value
Number
Average Value
Number
Average Value
LOANS ORIGINATED
23
$71,125
313
$53,458
261
$47,837
63
$23,719
6
$639,935
327
$44,832
0
$0
APPLICATIONS APPROVED, NOT ACCEPTED
0
$0
64
$49,409
50
$70,019
4
$24,608
0
$0
39
$42,537
6
$46,120
APPLICATIONS DENIED
3
$74,023
183
$58,927
254
$57,547
116
$31,104
0
$0
140
$51,245
11
$53,019
APPLICATIONS WITHDRAWN
2
$50,100
83
$60,869
153
$69,013
21
$49,554
2
$1,553,760
60
$49,156
3
$97,950
FILES CLOSED FOR INCOMPLETENESS
2
$54,745
15
$53,485
26
$53,497
2
$56,740
0
$0
6
$66,098
0
$0
Aggregated Statistics For Year 2005 (Based on 6 full and 8 partial tracts)
A) FHA, FSA/RHS & VA Home Purchase Loans
B) Conventional Home Purchase Loans
C) Refinancings
D) Home Improvement Loans
E) Loans on Dwellings For 5+ Families
F) Non-occupant Loans on < 5 Family Dwellings (A B C & D)
G) Loans On Manufactured Home Dwelling (A B C & D)
Number
Average Value
Number
Average Value
Number
Average Value
Number
Average Value
Number
Average Value
Number
Average Value
Number
Average Value
LOANS ORIGINATED
34
$63,715
221
$50,100
248
$56,034
59
$26,986
4
$94,620
237
$55,192
0
$0
APPLICATIONS APPROVED, NOT ACCEPTED
0
$0
33
$55,340
68
$51,766
7
$19,871
0
$0
29
$47,519
7
$50,801
APPLICATIONS DENIED
8
$50,604
133
$50,493
426
$57,780
137
$25,029
2
$470,110
94
$45,244
25
$51,744
APPLICATIONS WITHDRAWN
4
$49,635
53
$76,511
197
$72,430
41
$58,419
2
$470,110
37
$60,250
0
$0
FILES CLOSED FOR INCOMPLETENESS
0
$0
7
$34,089
13
$82,745
4
$66,675
0
$0
3
$58,310
0
$0
Aggregated Statistics For Year 2004 (Based on 6 full and 8 partial tracts)
A) FHA, FSA/RHS & VA Home Purchase Loans
B) Conventional Home Purchase Loans
C) Refinancings
D) Home Improvement Loans
E) Loans on Dwellings For 5+ Families
F) Non-occupant Loans on < 5 Family Dwellings (A B C & D)
G) Loans On Manufactured Home Dwelling (A B C & D)
Number
Average Value
Number
Average Value
Number
Average Value
Number
Average Value
Number
Average Value
Number
Average Value
Number
Average Value
LOANS ORIGINATED
28
$58,778
208
$48,467
293
$53,347
62
$28,003
8
$794,926
219
$41,321
0
$0
APPLICATIONS APPROVED, NOT ACCEPTED
2
$61,715
64
$54,754
88
$45,793
15
$31,225
0
$0
26
$44,842
12
$38,337
APPLICATIONS DENIED
4
$62,845
116
$45,866
466
$52,492
101
$26,534
4
$474,095
97
$43,905
37
$42,030
APPLICATIONS WITHDRAWN
6
$62,378
21
$80,434
214
$54,329
14
$37,260
0
$0
12
$49,421
2
$95,615
FILES CLOSED FOR INCOMPLETENESS
2
$53,750
4
$56,738
32
$54,560
4
$53,555
0
$0
10
$45,015
0
$0
Aggregated Statistics For Year 2003 (Based on 6 full and 8 partial tracts)
A) FHA, FSA/RHS & VA Home Purchase Loans
B) Conventional Home Purchase Loans
C) Refinancings
D) Home Improvement Loans
E) Loans on Dwellings For 5+ Families
F) Non-occupant Loans on < 5 Family Dwellings (A B C & D)
Number
Average Value
Number
Average Value
Number
Average Value
Number
Average Value
Number
Average Value
Number
Average Value
LOANS ORIGINATED
39
$62,442
186
$63,265
370
$50,270
54
$50,181
6
$369,492
194
$55,537
APPLICATIONS APPROVED, NOT ACCEPTED
2
$71,725
32
$45,202
101
$53,041
11
$16,439
0
$0
23
$32,363
APPLICATIONS DENIED
2
$47,810
94
$66,565
421
$48,743
91
$16,413
0
$0
72
$64,010
APPLICATIONS WITHDRAWN
3
$106,173
24
$47,395
193
$49,816
13
$18,051
0
$0
24
$35,646
FILES CLOSED FOR INCOMPLETENESS
2
$38,540
9
$54,383
30
$55,597
3
$19,240
0
$0
4
$49,800
Aggregated Statistics For Year 2002 (Based on 6 full and 8 partial tracts)
A) FHA, FSA/RHS & VA Home Purchase Loans
B) Conventional Home Purchase Loans
C) Refinancings
D) Home Improvement Loans
E) Loans on Dwellings For 5+ Families
F) Non-occupant Loans on < 5 Family Dwellings (A B C & D)
Number
Average Value
Number
Average Value
Number
Average Value
Number
Average Value
Number
Average Value
Number
Average Value
LOANS ORIGINATED
48
$56,662
168
$42,169
303
$44,886
58
$18,641
4
$485,025
191
$36,747
APPLICATIONS APPROVED, NOT ACCEPTED
1
$61,880
42
$42,424
94
$44,270
14
$29,606
0
$0
25
$37,716
APPLICATIONS DENIED
3
$44,143
75
$41,213
341
$45,427
90
$13,032
0
$0
80
$35,576
APPLICATIONS WITHDRAWN
9
$63,941
16
$62,001
214
$49,828
18
$12,182
0
$0
9
$40,641
FILES CLOSED FOR INCOMPLETENESS
0
$0
7
$25,859
38
$51,487
2
$10,950
0
$0
10
$28,671
Aggregated Statistics For Year 2001 (Based on 6 full and 8 partial tracts)
A) FHA, FSA/RHS & VA Home Purchase Loans
B) Conventional Home Purchase Loans
C) Refinancings
D) Home Improvement Loans
E) Loans on Dwellings For 5+ Families
F) Non-occupant Loans on < 5 Family Dwellings (A B C & D)
Number
Average Value
Number
Average Value
Number
Average Value
Number
Average Value
Number
Average Value
Number
Average Value
LOANS ORIGINATED
60
$49,197
138
$32,771
327
$42,048
64
$12,289
6
$331,003
164
$30,687
APPLICATIONS APPROVED, NOT ACCEPTED
1
$53,390
38
$34,308
65
$39,023
11
$25,945
0
$0
14
$27,719
APPLICATIONS DENIED
9
$52,680
138
$35,929
387
$42,665
88
$10,725
0
$0
57
$29,118
APPLICATIONS WITHDRAWN
9
$42,687
29
$54,962
235
$41,011
13
$12,985
0
$0
12
$37,882
FILES CLOSED FOR INCOMPLETENESS
0
$0
9
$38,530
35
$40,195
0
$0
0
$0
2
$24,610
Aggregated Statistics For Year 2000 (Based on 6 full and 8 partial tracts)
A) FHA, FSA/RHS & VA Home Purchase Loans
B) Conventional Home Purchase Loans
C) Refinancings
D) Home Improvement Loans
F) Non-occupant Loans on < 5 Family Dwellings (A B C & D)
Number
Average Value
Number
Average Value
Number
Average Value
Number
Average Value
Number
Average Value
LOANS ORIGINATED
83
$46,314
159
$36,938
179
$38,200
82
$17,593
121
$29,315
APPLICATIONS APPROVED, NOT ACCEPTED
9
$52,257
43
$41,290
70
$36,051
25
$20,128
20
$22,052
APPLICATIONS DENIED
36
$44,678
136
$41,451
237
$37,289
110
$14,790
38
$31,276
APPLICATIONS WITHDRAWN
19
$50,763
36
$42,616
115
$37,637
13
$10,751
8
$33,249
FILES CLOSED FOR INCOMPLETENESS
2
$83,585
11
$44,596
30
$38,680
1
$21,080
9
$51,814
Aggregated Statistics For Year 1999 (Based on 3 full and 4 partial tracts)
A) FHA, FSA/RHS & VA Home Purchase Loans
B) Conventional Home Purchase Loans
C) Refinancings
D) Home Improvement Loans
E) Loans on Dwellings For 5+ Families
F) Non-occupant Loans on < 5 Family Dwellings (A B C & D)
2002 - 2018 National Fire Incident Reporting System (NFIRS) incidents
According to the data from the years 2002 - 2018 the average number of fires per year is 146. The highest number of reported fire incidents - 209 took place in 2005, and the least - 105 in 2012. The data has a decreasing trend.
When looking into fire subcategories, the most reports belonged to: Outside Fires (45.3%), and Structure Fires (34.4%).
Fire incident types reported to NFIRS in Zip Code 74110


 Nearest zip codes: 74106, 74104, 74120, 74115, 74103, 74130.
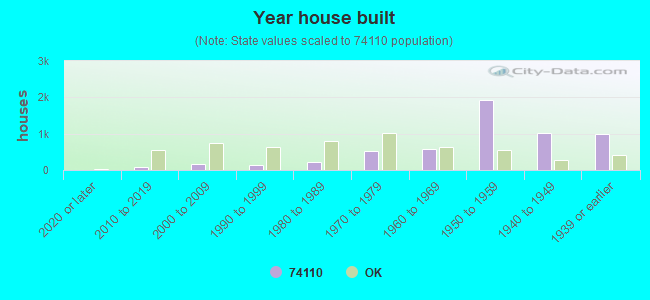


 According to the data from the years 2002 - 2018 the average number of fires per year is 146. The highest number of reported fire incidents - 209 took place in 2005, and the least - 105 in 2012. The data has a decreasing trend.
 When looking into fire subcategories, the most reports belonged to: Outside Fires (45.3%), and Structure Fires (34.4%).