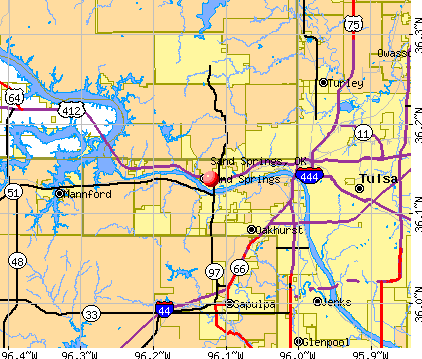
Sand Springs, Oklahoma

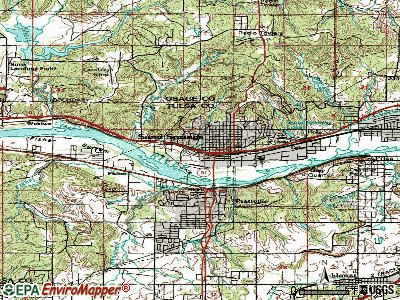
Sand Springs: Arkansas River Bridge between Sand Springs and Prattville(#2)

Sand Springs: Charles Page Memorial

Sand Springs: Arkansas River Bridge between Sand Springs and Prattville

Sand Springs: Sand Springs Water Tower
- add
your
Submit your own pictures of this city and show them to the world
- OSM Map
- General Map
- Google Map
- MSN Map
Population change since 2000: +14.8%
 |
| Males: 9,885 | |
| Females: 10,146 |
| Median resident age: | 36.9 years |
| Oklahoma median age: | 37.1 years |
Zip codes: 74073, 74126, 74127.
Sand Springs Zip Code Map| Sand Springs: | $68,383 |
| OK: | $59,673 |
Estimated per capita income in 2022: $30,633 (it was $18,193 in 2000)
Sand Springs city income, earnings, and wages data
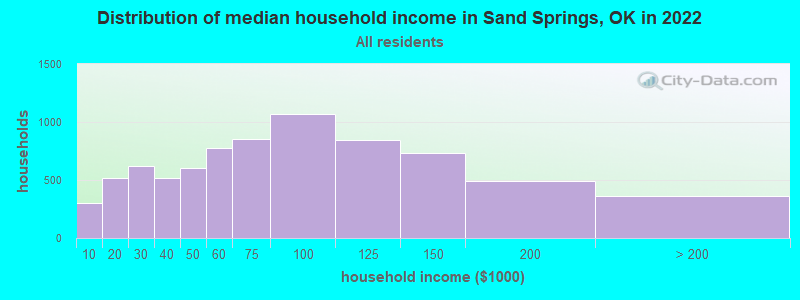
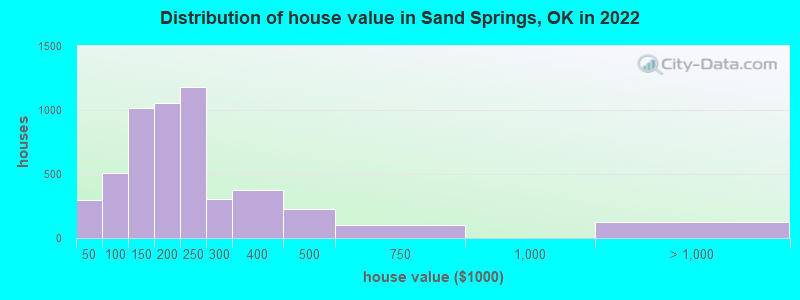
Estimated median house or condo value in 2022: $195,307 (it was $78,000 in 2000)
| Sand Springs: | $195,307 |
| OK: | $191,700 |
Mean prices in 2022: all housing units: $230,261; detached houses: $236,585; townhouses or other attached units: $134,557; mobile homes: $117,780; occupied boats, rvs, vans, etc.: $106,790
Median gross rent in 2022: $995.
(9.9% for White Non-Hispanic residents, 3.9% for Black residents, 22.9% for Hispanic or Latino residents, 16.0% for American Indian residents, 31.6% for other race residents, 10.9% for two or more races residents)
Detailed information about poverty and poor residents in Sand Springs, OK


Compare current foreclosures in Sand Springs, OK:
| Photo | Address | Area | Beds / Baths | Price | Details |
|---|---|---|---|---|---|

|
#1
W 28th Ct
Sand Springs, OK 74063
|
1,188 sq. feet
|
1 baths 3 beds |
$174,500
|
show details |

|
#2
Imperial Blvd
Sand Springs, OK 74063
|
1,568 sq. feet
|
2 baths 2 beds |
show details | |

|
#3
W 12th St
Sand Springs, OK 74063
|
2,083 sq. feet
|
2 baths - beds |
show details | |

|
#4
N 194th West Ave
Sand Springs, OK 74063
|
1,680 sq. feet
|
2 baths 3 beds |
show details | |

|
#5
Goldenrod Ln
Sand Springs, OK 74063
|
1,557 sq. feet
|
2 baths 3 beds |
show details | |

|
#6
Osage Pass
Sand Springs, OK 74063
|
1,216 sq. feet
|
2 baths 4 beds |
show details | |

|
#7
Washington Ave
Sand Springs, OK 74063
|
1,329 sq. feet
|
1 baths - beds |
show details | |

|
#8
S 220th West Ave
Sand Springs, OK 74063
|
1,430 sq. feet
|
2 baths - beds |
show details | |

|
#9
Redbud Pl
Sand Springs, OK 74063
|
1,722 sq. feet
|
2 baths - beds |
show details | |

|
#10
Antigua Dr
Sand Springs, OK 74063
|
1,808 sq. feet
|
2 baths - beds |
show details |
| Photo | Address | Area | Beds / Baths | Price | Details |
|---|---|---|---|---|---|

|
#11
S Linwood Dr
Sand Springs, OK 74063
|
1,424 sq. feet
|
2 baths - beds |
show details | |

|
#12
Douglas Ave
Sand Springs, OK 74063
|
1,735 sq. feet
|
1 baths - beds |
show details | |

|
#13
Redbud Pl
Sand Springs, OK 74063
|
1,672 sq. feet
|
2 baths - beds |
show details | |

|
#14
W 54th St
Sand Springs, OK 74063
|
1,829 sq. feet
|
2 baths - beds |
show details | |

|
#15
W 47th Pl
Sand Springs, OK 74063
|
912 sq. feet
|
1 baths - beds |
show details | |

|
#16
S 155th West Ave
Sand Springs, OK 74063
|
1,440 sq. feet
|
1 baths - beds |
show details | |

|
#17
N Wilson Ave
Sand Springs, OK 74063
|
1,284 sq. feet
|
1 baths - beds |
show details | |

|
#18
S 263rd West Ave
Sand Springs, OK 74063
|
2,076 sq. feet
|
2 baths - beds |
show details | |

|
#19
S 169th West Ave
Sand Springs, OK 74063
|
1,820 sq. feet
|
1 baths - beds |
show details | |

|
#20
N Main St
Sand Springs, OK 74063
|
2,452 sq. feet
|
2 baths - beds |
show details |
| Photo | Address | Area | Beds / Baths | Price | Details |
|---|---|---|---|---|---|

|
#21
S 148th West Ave
Sand Springs, OK 74063
|
1,545 sq. feet
|
2 baths - beds |
show details | |

|
#22
W 44th St
Sand Springs, OK 74063
|
1,566 sq. feet
|
1 baths - beds |
show details | |

|
#23
W 51st Pl
Sand Springs, OK 74063
|
2,102 sq. feet
|
2 baths - beds |
show details | |

|
#24
W 47th Pl
Sand Springs, OK 74063
|
1,110 sq. feet
|
2 baths - beds |
show details | |

|
#25
Ridge Dr
Sand Springs, OK 74063
|
1,102 sq. feet
|
1 baths - beds |
show details | |

|
#26
N Roosevelt Ave
Sand Springs, OK 74063
|
1,557 sq. feet
|
1 baths - beds |
show details | |

|
#27
Valley Dr
Sand Springs, OK 74063
|
1,368 sq. feet
|
1 baths - beds |
show details | |

|
#28
E 48th St
Sand Springs, OK 74063
|
- sq. feet
|
- baths - beds |
show details | |

|
#29
N Franklin Ave
Sand Springs, OK 74063
|
- sq. feet
|
- baths - beds |
show details | |

|
#30
N Greats Rd
Sand Springs, OK 74063
|
- sq. feet
|
- baths - beds |
show details |
| Photo | Address | Area | Beds / Baths | Price | Details |
|---|---|---|---|---|---|

|
#31
E 10th St
Sand Springs, OK 74063
|
- sq. feet
|
- baths - beds |
show details | |

|
#32
Shell Creek Rd
Sand Springs, OK 74063
|
- sq. feet
|
- baths - beds |
show details | |

|
#33
Redbud Pl
Sand Springs, OK 74063
|
- sq. feet
|
- baths - beds |
show details | |

|
#34
W 26th St
Sand Springs, OK 74063
|
- sq. feet
|
- baths - beds |
show details | |

|
#35
Osage St
Sand Springs, OK 74063
|
- sq. feet
|
- baths - beds |
show details | |

|
#36
E Colony Cir
Sand Springs, OK 74063
|
- sq. feet
|
- baths - beds |
show details | |

|
#37
Anderson Ln
Sand Springs, OK 74063
|
- sq. feet
|
- baths - beds |
show details | |

|
#38
S Highway 97, # 253
Sand Springs, OK 74063
|
- sq. feet
|
- baths - beds |
show details | |

|
Check over 1 million property listings on Foreclosure.com!
|
browse all offers | |||


- 15,44176.5%White alone
- 1,5347.6%Two or more races
- 1,3046.5%American Indian alone
- 1,1295.6%Hispanic
- 3331.7%Black alone
- 1350.7%Asian alone
- 430.2%Other race alone
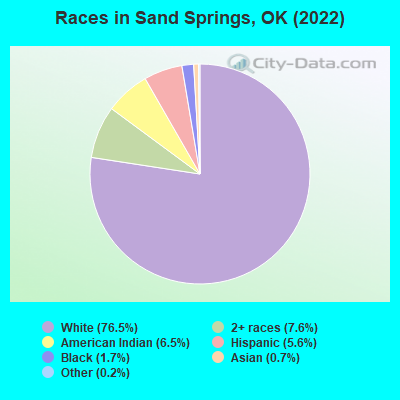
Races in Sand Springs detailed stats: ancestries, foreign born residents, place of birth
According to our research of Oklahoma and other state lists, there were 66 registered sex offenders living in Sand Springs, Oklahoma as of April 28, 2024.
The ratio of all residents to sex offenders in Sand Springs is 302 to 1.
Type |
2009 |
2010 |
2011 |
2012 |
2013 |
2014 |
2015 |
2016 |
2017 |
2018 |
2019 |
2020 |
2021 |
2022 |
|---|---|---|---|---|---|---|---|---|---|---|---|---|---|---|
| Murders (per 100,000) | 1 (5.4) | 1 (5.3) | 0 (0.0) | 0 (0.0) | 0 (0.0) | 0 (0.0) | 0 (0.0) | 0 (0.0) | 0 (0.0) | 0 (0.0) | 0 (0.0) | 0 (0.0) | 5 (24.8) | 0 (0.0) |
| Rapes (per 100,000) | 11 (59.1) | 3 (15.9) | 3 (15.7) | 5 (26.0) | 5 (26.1) | 16 (82.2) | 3 (15.2) | 5 (25.0) | 4 (20.0) | 5 (24.9) | 5 (25.0) | 6 (30.0) | 7 (34.8) | 7 (35.0) |
| Robberies (per 100,000) | 10 (53.8) | 11 (58.2) | 11 (57.6) | 11 (57.1) | 10 (52.1) | 5 (25.7) | 7 (35.5) | 7 (35.1) | 15 (75.1) | 5 (24.9) | 8 (40.0) | 6 (30.0) | 6 (29.8) | 4 (20.0) |
| Assaults (per 100,000) | 21 (112.9) | 18 (95.2) | 11 (57.6) | 19 (98.7) | 5 (26.1) | 13 (66.8) | 17 (86.2) | 15 (75.1) | 6 (30.0) | 9 (44.9) | 9 (44.9) | 7 (35.0) | 17 (84.4) | 28 (140.0) |
| Burglaries (per 100,000) | 116 (623.6) | 98 (518.4) | 125 (654.2) | 107 (555.6) | 100 (521.4) | 82 (421.5) | 86 (436.0) | 88 (440.9) | 88 (440.5) | 82 (408.9) | 88 (439.5) | 117 (584.2) | 103 (511.4) | 89 (444.9) |
| Thefts (per 100,000) | 522 (2,806) | 481 (2,544) | 504 (2,638) | 623 (3,235) | 561 (2,925) | 481 (2,472) | 564 (2,859) | 508 (2,545) | 416 (2,082) | 525 (2,618) | 710 (3,546) | 649 (3,241) | 604 (2,999) | 632 (3,159) |
| Auto thefts (per 100,000) | 44 (236.5) | 57 (301.5) | 39 (204.1) | 54 (280.4) | 35 (182.5) | 44 (226.2) | 85 (430.9) | 67 (335.7) | 75 (375.4) | 76 (378.9) | 80 (399.5) | 136 (679.1) | 114 (566.1) | 67 (334.9) |
| Arson (per 100,000) | 0 (0.0) | 1 (5.3) | 3 (15.7) | 1 (5.2) | 2 (10.4) | 1 (5.1) | 2 (10.1) | 2 (10.0) | 3 (15.0) | 1 (5.0) | 1 (5.0) | 0 (0.0) | 1 (5.0) | 1 (5.0) |
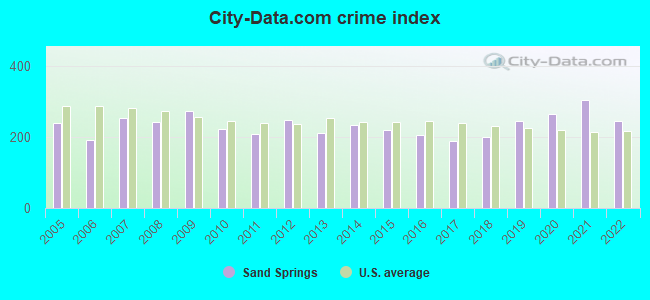
| City-Data.com crime index | 271.6 | 221.9 | 209.0 | 248.4 | 209.8 | 233.3 | 219.4 | 205.1 | 188.7 | 200.0 | 245.5 | 264.8 | 304.3 | 246.3 |
The City-Data.com crime index weighs serious crimes and violent crimes more heavily. Higher means more crime, U.S. average is 246.1. It adjusts for the number of visitors and daily workers commuting into cities.
Crime rate in Sand Springs detailed stats: murders, rapes, robberies, assaults, burglaries, thefts, arson
Full-time law enforcement employees in 2021, including police officers: 41 (31 officers - 29 male; 2 female).
| Officers per 1,000 residents here: | 1.54 |
| Oklahoma average: | 2.27 |
 Recent articles from our blog. Our writers, many of them Ph.D. graduates or candidates, create easy-to-read articles on a wide variety of topics.

 | Sand Springs, safest areas? (5 replies) |
| "The American" in Sand Springs (9 replies) |
| Cleveland, Ok or Bristow (4 replies) |
| High-speed internet options in Sand Springs (0 replies) |
| Living in between Stillwater and Tulsa? (14 replies) |
| Help! Possible relo to Sand Springs (4 replies) |
Latest news from Sand Springs, OK collected exclusively by city-data.com from local newspapers, TV, and radio stations
Sand Springs, OK City Guides:
Ancestries: American (14.0%), English (10.2%), Irish (8.5%), German (6.7%), European (2.7%), Dutch (1.5%).
Current Local Time: CST time zone
Incorporated in 1912
Elevation: 670 feet
Land area: 18.7 square miles.
Population density: 1,072 people per square mile (low).
379 residents are foreign born
| This city: | 1.9% |
| Oklahoma: | 6.1% |
Median real estate property taxes paid for housing units with mortgages in 2022: $1,869 (0.9%)
Median real estate property taxes paid for housing units with no mortgage in 2022: $1,435 (0.8%)
Nearest city with pop. 50,000+: Tulsa, OK  (10.3 miles , pop. 393,049).
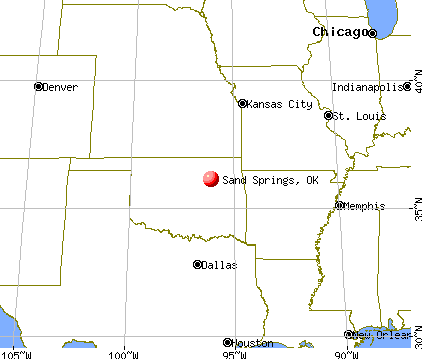
Nearest city with pop. 1,000,000+: Dallas, TX (234.0 miles , pop. 1,188,580).
Nearest cities:
), ), ), Latitude: 36.14 N, Longitude: 96.12 W
Daytime population change due to commuting: -2,190 (-10.9%)
Workers who live and work in this city: 2,294 (24.7%)
Area code: 918
Property values in Sand Springs, OK
Sand Springs, Oklahoma accommodation & food services, waste management - Economy and Business Data
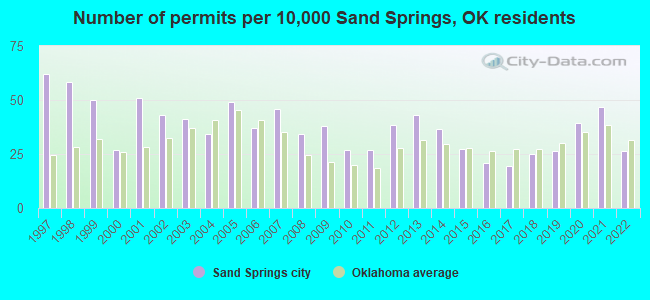
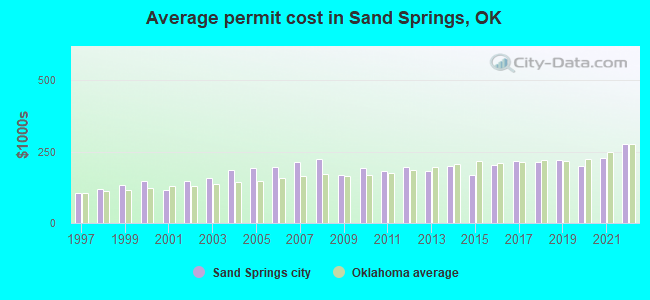
Single-family new house construction building permits:
- 2022: 46 buildings, average cost: $276,300
- 2021: 82 buildings, average cost: $229,400
- 2020: 69 buildings, average cost: $198,800
- 2019: 46 buildings, average cost: $220,600
- 2018: 44 buildings, average cost: $213,900
- 2017: 34 buildings, average cost: $217,100
- 2016: 36 buildings, average cost: $201,500
- 2015: 48 buildings, average cost: $169,600
- 2014: 64 buildings, average cost: $199,000
- 2013: 75 buildings, average cost: $184,100
- 2012: 67 buildings, average cost: $195,100
- 2011: 47 buildings, average cost: $184,000
- 2010: 47 buildings, average cost: $193,700
- 2009: 66 buildings, average cost: $167,600
- 2008: 60 buildings, average cost: $223,600
- 2007: 80 buildings, average cost: $214,400
- 2006: 65 buildings, average cost: $197,800
- 2005: 86 buildings, average cost: $194,000
- 2004: 60 buildings, average cost: $186,400
- 2003: 72 buildings, average cost: $156,800
- 2002: 75 buildings, average cost: $148,300
- 2001: 89 buildings, average cost: $117,400
- 2000: 47 buildings, average cost: $149,300
- 1999: 87 buildings, average cost: $135,400
- 1998: 102 buildings, average cost: $120,400
- 1997: 108 buildings, average cost: $105,200
| Here: | 3.3% |
| Oklahoma: | 3.2% |
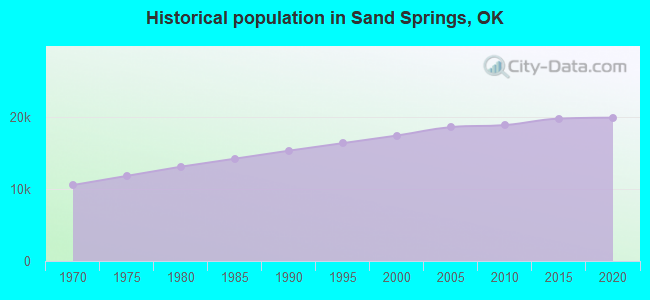
Population change in the 1990s: +1,249 (+7.7%).
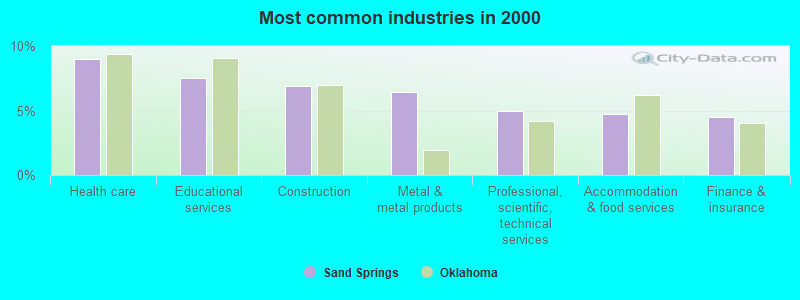
- Health care (9.0%)
- Educational services (7.5%)
- Construction (6.9%)
- Metal & metal products (6.4%)
- Professional, scientific, technical services (5.0%)
- Accommodation & food services (4.7%)
- Finance & insurance (4.5%)
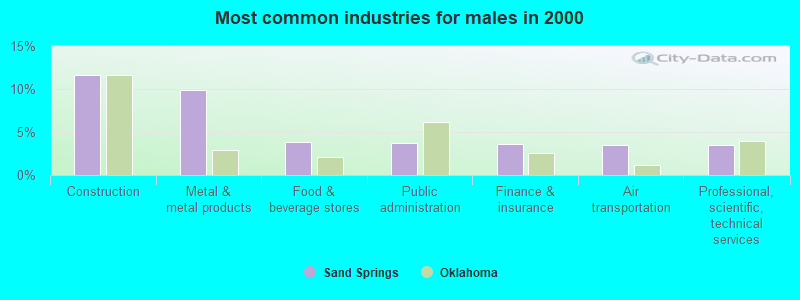
- Construction (11.6%)
- Metal & metal products (9.9%)
- Food & beverage stores (3.8%)
- Public administration (3.7%)
- Finance & insurance (3.6%)
- Air transportation (3.5%)
- Professional, scientific, technical services (3.5%)
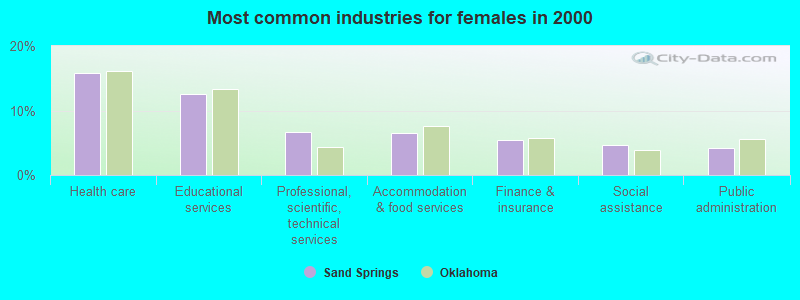
- Health care (15.9%)
- Educational services (12.6%)
- Professional, scientific, technical services (6.6%)
- Accommodation & food services (6.5%)
- Finance & insurance (5.4%)
- Social assistance (4.6%)
- Public administration (4.2%)
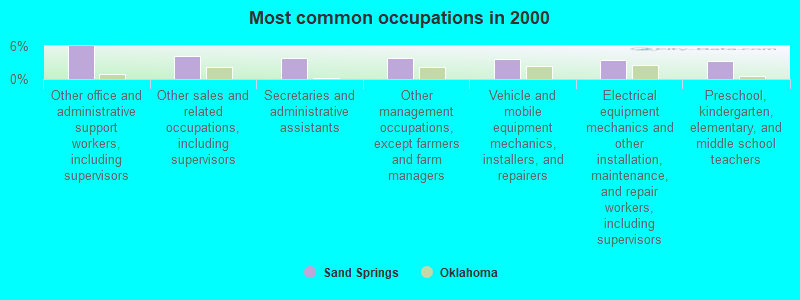
- Other office and administrative support workers, including supervisors (6.0%)
- Other sales and related occupations, including supervisors (4.1%)
- Secretaries and administrative assistants (3.9%)
- Other management occupations, except farmers and farm managers (3.8%)
- Vehicle and mobile equipment mechanics, installers, and repairers (3.6%)
- Electrical equipment mechanics and other installation, maintenance, and repair workers, including supervisors (3.4%)
- Preschool, kindergarten, elementary, and middle school teachers (3.3%)
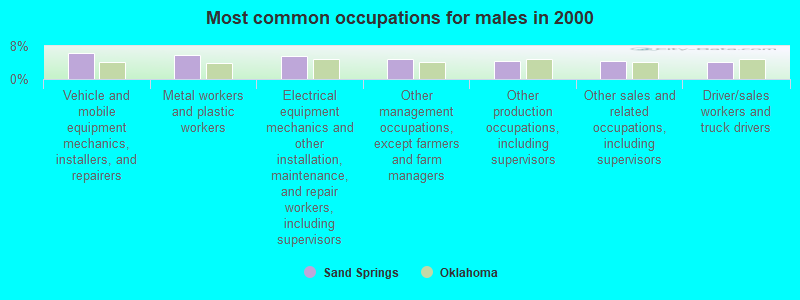
- Vehicle and mobile equipment mechanics, installers, and repairers (6.4%)
- Metal workers and plastic workers (5.9%)
- Electrical equipment mechanics and other installation, maintenance, and repair workers, including supervisors (5.5%)
- Other management occupations, except farmers and farm managers (4.9%)
- Other production occupations, including supervisors (4.3%)
- Other sales and related occupations, including supervisors (4.3%)
- Driver/sales workers and truck drivers (4.2%)
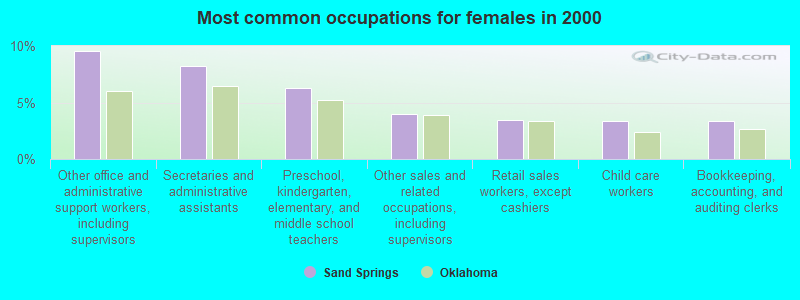
- Other office and administrative support workers, including supervisors (9.6%)
- Secretaries and administrative assistants (8.2%)
- Preschool, kindergarten, elementary, and middle school teachers (6.3%)
- Other sales and related occupations, including supervisors (4.0%)
- Retail sales workers, except cashiers (3.5%)
- Child care workers (3.4%)
- Bookkeeping, accounting, and auditing clerks (3.4%)
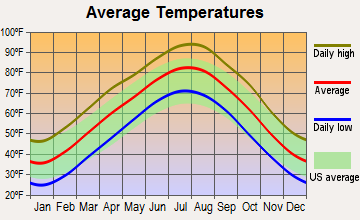
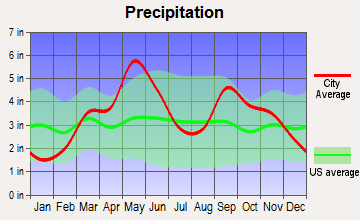
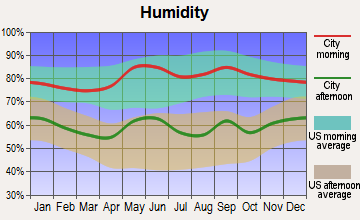
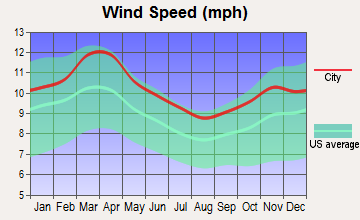
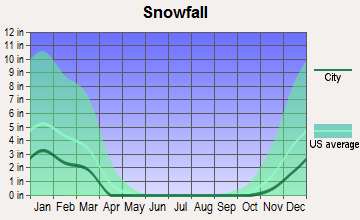
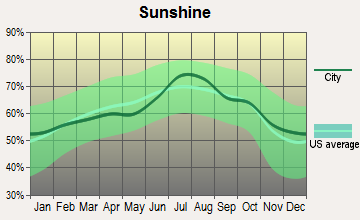
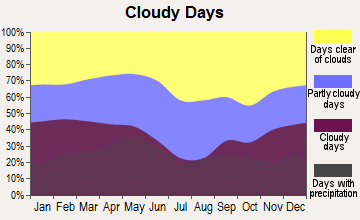
Average climate in Sand Springs, Oklahoma
Based on data reported by over 4,000 weather stations
|
|

(lower is better)
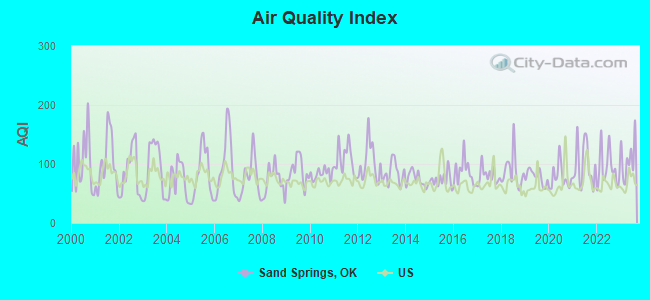
Air Quality Index (AQI) level in 2023 was 110. This is significantly worse than average.
| City: | 110 |
| U.S.: | 73 |
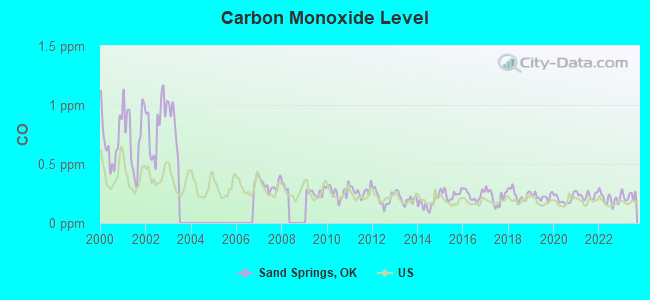
Carbon Monoxide (CO) [ppm] level in 2023 was 0.231. This is about average. Closest monitor was 8.1 miles away from the city center.
| City: | 0.231 |
| U.S.: | 0.251 |
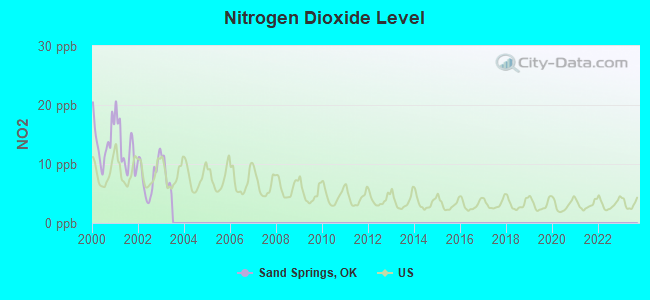
Nitrogen Dioxide (NO2) [ppb] level in 2002 was 7.79. This is significantly worse than average. Closest monitor was 7.0 miles away from the city center.
| City: | 7.79 |
| U.S.: | 5.11 |
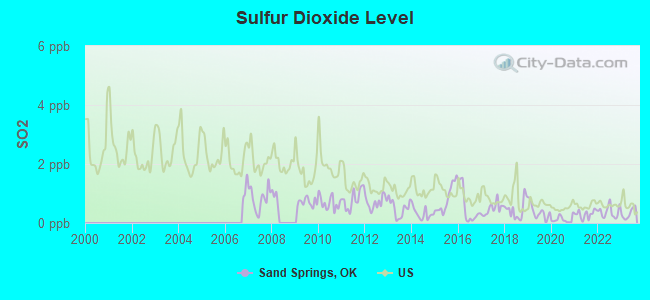
Sulfur Dioxide (SO2) [ppb] level in 2023 was 0.320. This is significantly better than average. Closest monitor was 6.1 miles away from the city center.
| City: | 0.320 |
| U.S.: | 1.515 |
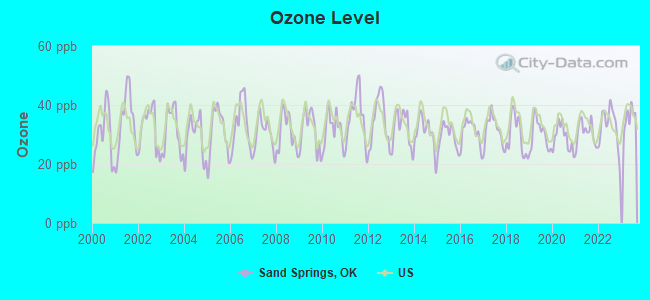
Ozone [ppb] level in 2023 was 35.6. This is about average. Closest monitor was 7.0 miles away from the city center.
| City: | 35.6 |
| U.S.: | 33.3 |
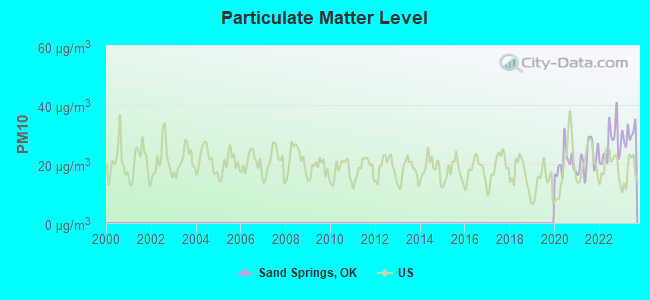
Particulate Matter (PM10) [µg/m3] level in 2023 was 30.2. This is significantly worse than average. Closest monitor was 6.1 miles away from the city center.
| City: | 30.2 |
| U.S.: | 19.2 |
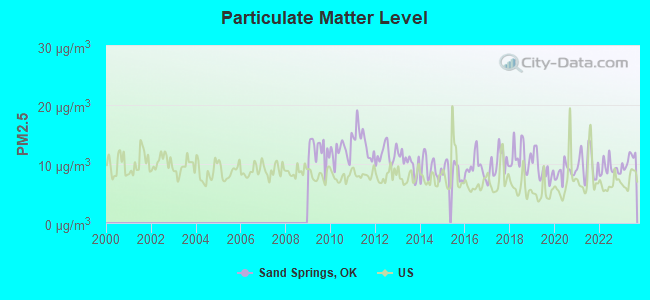
Particulate Matter (PM2.5) [µg/m3] level in 2023 was 10.7. This is worse than average. Closest monitor was 9.3 miles away from the city center.
| City: | 10.7 |
| U.S.: | 8.1 |
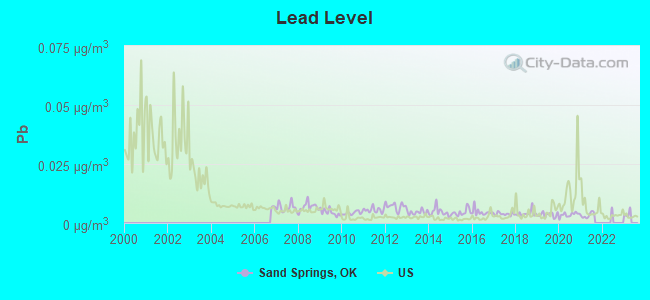
Lead (Pb) [µg/m3] level in 2021 was 0.00329. This is significantly better than average. Closest monitor was 0.0 miles away from the city center.
| City: | 0.00329 |
| U.S.: | 0.00931 |
Tornado activity:
Sand Springs-area historical tornado activity is slightly above Oklahoma state average. It is 182% greater than the overall U.S. average.
On 5/5/1960, a category F5 (max. wind speeds 261-318 mph) tornado 6.7 miles away from the Sand Springs city center killed 5 people and injured 81 people and caused between $500,000 and $5,000,000 in damages.
On 4/29/1984, a category F4 (max. wind speeds 207-260 mph) tornado 10.1 miles away from the city center killed one person and injured 60 people and caused between $5,000,000 and $50,000,000 in damages.
Earthquake activity:
Sand Springs-area historical earthquake activity is significantly above Oklahoma state average. It is 821% greater than the overall U.S. average.On 9/3/2016 at 12:02:44, a magnitude 5.8 (5.8 MW, Depth: 3.5 mi, Class: Moderate, Intensity: VI - VII) earthquake occurred 49.2 miles away from the city center
On 11/6/2011 at 03:53:10, a magnitude 5.7 (5.7 MW, Depth: 3.2 mi) earthquake occurred 55.4 miles away from Sand Springs center
On 11/7/2016 at 01:44:24, a magnitude 5.0 (5.0 MW, Depth: 2.8 mi) earthquake occurred 39.5 miles away from the city center
On 11/5/2011 at 07:12:45, a magnitude 4.8 (4.8 MW, Depth: 1.9 mi, Class: Light, Intensity: IV - V) earthquake occurred 54.4 miles away from the city center
On 11/8/2011 at 02:46:57, a magnitude 4.8 (4.8 MW, Depth: 3.1 mi) earthquake occurred 56.3 miles away from the city center
On 2/13/2016 at 17:07:06, a magnitude 5.1 (5.1 MW, Depth: 5.2 mi) earthquake occurred 146.3 miles away from Sand Springs center
Magnitude types: moment magnitude (MW)
Natural disasters:
The number of natural disasters in Tulsa County (34) is a lot greater than the US average (15).Major Disasters (Presidential) Declared: 22
Emergencies Declared: 7
Causes of natural disasters: Storms: 15, Floods: 14, Winter Storms: 9, Tornadoes: 8, Fires: 5, Heavy Rains: 2, Winds: 2, Hurricane: 1, Ice Storm: 1, Snow: 1, Snowstorm: 1, Other: 1 (Note: some incidents may be assigned to more than one category).
Main business address for: WEBCO INDUSTRIES INC (STEEL PIPE & TUBES).
Hospitals and medical centers in Sand Springs:
- INNOVATIVE SENIOR CARE HOME HEALTH (401 E BROADWAY, STE 250)
- SAND SPRINGS NURSING AND REHAB CENTER (1025 NORTH ADAMS)
Other hospitals and medical centers near Sand Springs:
- FMCNA - NORTH TULSA (Dialysis Facility, about 6 miles away; TULSA, OK)
- OKLAHOMA STATE UNIVERSITY MEDICAL CENTER Acute Care Hospitals (about 7 miles away; TULSA, OK)
- TULSA REGIONAL MEDICAL CENTER, SNF (Nursing Home, about 7 miles away; TULSA, OK)
- OSTEOPATHIC SURGICENTER (Hospital, about 7 miles away; TULSA, OK)
- HOMESTEAD NURSING HOME, INC (Nursing Home, about 7 miles away; TULSA, OK)
- INVERNESS VILLAGE (Nursing Home, about 8 miles away; TULSA, OK)
- TULSA SPINE & SPECIALTY HOSPITAL Acute Care Hospitals (about 8 miles away; TULSA, OK)
Airports located in Sand Springs:
- William R Pogue Municipal Airport (OWP) (Runways: 1, Itinerant Ops: 19,950, Local Ops: 10,000, Military Ops: 50)
- Double W Airport (3OK7) (Runways: 1)
- Flying G Ranch Airport (3OK8) (Runways: 2)
Colleges/Universities in Sand Springs:
Colleges/universities with over 2000 students nearest to Sand Springs:
- University of Tulsa (about 10 miles; Tulsa, OK; Full-time enrollment: 3,702)
- Oral Roberts University (about 12 miles; Tulsa, OK; FT enrollment: 3,216)
- Tulsa Community College (about 13 miles; Tulsa, OK; FT enrollment: 12,480)
- Rogers State University (about 30 miles; Claremore, OK; FT enrollment: 3,482)
- Oklahoma State University Institute of Technology (about 37 miles; Okmulgee, OK; FT enrollment: 3,243)
- Oklahoma State University-Main Campus (about 54 miles; Stillwater, OK; FT enrollment: 21,700)
- Langston University (about 66 miles; Langston, OK; FT enrollment: 2,075)
Public high schools in Sand Springs:
- CHARLES PAGE HS (Students: 1,206, Location: 500 NORTH ADAMS ROAD, Grades: 10-12)
- CENTRAL 9TH GRADE CTR (Students: 468, Location: 14 WEST 4TH STREET, Grades: 9)
Private high schools in Sand Springs:
Public elementary/middle schools in Sand Springs:
- PRATT ES (Students: 542, Location: 301WEST 35TH STREET, Grades: KG-5)
- KEYSTONE PUBLIC SCHOOL (Students: 456, Location: 23810 WEST HIGHWAY 51, Grades: PK-8)
- GARFIELD ES (Students: 450, Location: 701 NORTH ROOSEVELT, Grades: 3-5)
- ANGUS VALLEY ES (Students: 356, Location: 412 WEST 55TH STREET, Grades: PK-5)
- ANDERSON PUBLIC SCHOOL (Students: 297, Location: 2195 ANDERSON ROAD, Grades: PK-6)
- LIMESTONE ES (Students: 276, Location: 4201 SOUTH WALNUT CREEK DRIVE, Grades: PK-5)
- NORTHWOODS FINE ARTS ACADEMY (Location: 1691 EAST OLD NORTH ROAD, Grades: KG-2)
- CLYDE BOYD MS (Location: 305 WEST 35TH STREET, Grades: 6-8)
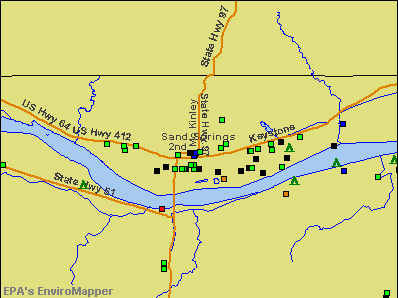
Points of interest:
Notable locations in Sand Springs: Arrowhead Ranch (A), Osage Hills Country Club (B), Village Square (C), Sand Springs Fire Department Station 2 (D), Rock Fire Department (E), Zink Fire Department (F), City of Sand Springs Fire Department Station 1 (G). Display/hide their locations on the map
Shopping Centers: Harris Shopping Center (1), Prattville Shopping Center (2), Sand Springs Shopping Center (3). Display/hide their locations on the map
Main business address in Sand Springs: WEBCO INDUSTRIES INC (A). Display/hide its location on the map
Churches in Sand Springs include: Delaware Church (A), Lake United Methodist Church (B), Fisher Church (C), Limestone Church (D), Tanglewood Church (E), First Church of God (F), Cornerstone Church (G), Saint Matthews Episcopal Church (H), Trinity Baptist Church (I). Display/hide their locations on the map
Cemeteries: Tullahassee Creek Indian Cemetery (1), Post Oak Cemetery (2). Display/hide their locations on the map
Reservoirs: Oknoname 143001 Reservoir (A), Oknoname 143005 Reservoir (B), Shell Lake (C), Sand Springs Lake (D). Display/hide their locations on the map
Creeks: Brush Creek (A), Turkey Creek (B), Anderson Creek (C), Shell Creek (D), Sand Creek (E), Goose Creek (F), Fisher Creek (G). Display/hide their locations on the map
Park in Sand Springs: Douglas Park (1). Display/hide its location on the map
Tourist attractions: Sand Springs Museum (Cultural Attractions- Events- & Facilities; 6 East Broadway Street) (1), Sandus Marketing (14806 West 18th Place) (2), Sandite Billiards & Grill (7822 West Parkway Boulevard) (3). Display/hide their approximate locations on the map
Hotels: Days Inn (1110 E Charles Page Blvd) (1), Best Western Sand Springs Inn & Suites (211 South Lake Drive) (2). Display/hide their approximate locations on the map
Birthplace of: Mae Young - Professional wreslter, Jerry Adair - Baseball player, Cindy Pickett - Film actor, Steve Barnett (American football) - Football player.
Drinking water stations with addresses in Sand Springs and their reported violations in the past:
DIAMONDHEAD HOMEOWNERS ASSOC (Address: 500 Diamonhead , Population served: 39, Purch surface water):Past monitoring violations:
- 5 routine major monitoring violations
| This city: | 2.5 people |
| Oklahoma: | 2.5 people |
| This city: | 70.7% |
| Whole state: | 66.8% |
| This city: | 5.2% |
| Whole state: | 5.9% |
Likely homosexual households (counted as self-reported same-sex unmarried-partner households)
- Lesbian couples: 0.4% of all households
- Gay men: 0.1% of all households
People in group quarters in Sand Springs in 2010:
- 84 people in nursing facilities/skilled-nursing facilities
- 68 people in residential treatment centers for juveniles (non-correctional)
- 32 people in other noninstitutional facilities
- 17 people in group homes for juveniles (non-correctional)
- 6 people in residential treatment centers for adults
- 6 people in workers' group living quarters and job corps centers
People in group quarters in Sand Springs in 2000:
- 186 people in training schools for juvenile delinquents
- 114 people in nursing homes
- 87 people in schools, hospitals, or wards for the intellectually disabled
- 30 people in other noninstitutional group quarters
- 24 people in homes for the mentally retarded
- 21 people in homes for abused, dependent, and neglected children
Banks with branches in Sand Springs (2011 data):
- International Bank of Commerce: Sand Springs Branch at 800 East Charles Page Blvd, branch established on 1922/01/01; Sand Springs South Branch at 3973 Highway 97, branch established on 1916/01/01. Info updated 2007/03/28: Bank assets: $9,621.9 mil, Deposits: $6,548.8 mil, headquarters in Laredo, TX, positive income, Commercial Lending Specialization, 197 total offices, Holding Company: International Bancshares Corporation
- BancFirst: West 41st Street Branch at 102 West 41st Street, branch established on 1984/04/02; Sand Springs Branch at 301 East Second, branch established on 1965/01/08. Info updated 2012/02/24: Bank assets: $5,407.8 mil, Deposits: $4,893.4 mil, headquarters in Oklahoma City, OK, positive income, Commercial Lending Specialization, 101 total offices, Holding Company: Bancfirst Corporation
- American Heritage Bank: South Sand Springs Branch at 3801 South 113th West Avenue, branch established on 1984/03/07; Adams Road Branch at 220 S. Adams Road, branch established on 2007/08/06. Info updated 2006/11/03: Bank assets: $752.5 mil, Deposits: $575.8 mil, headquarters in Sapulpa, OK, positive income, 16 total offices, Holding Company: American Bancorporation, Inc.
- Arvest Bank: Wal-Mart Super Center Branch at 220 South Highway 97, branch established on 2003/08/20. Info updated 2010/11/29: Bank assets: $12,520.8 mil, Deposits: $10,446.2 mil, headquarters in Fayetteville, AR, positive income, Commercial Lending Specialization, 241 total offices, Holding Company: Arvest Bank Group, Inc.
- BOKF, National Association: Sand Springs Branch at 401 East Broadway, branch established on 1913/10/14. Info updated 2012/02/28: Bank assets: $25,360.0 mil, Deposits: $19,171.3 mil, headquarters in Tulsa, OK, positive income, Commercial Lending Specialization, 189 total offices, Holding Company: Bok Financial Corporation
For population 15 years and over in Sand Springs:
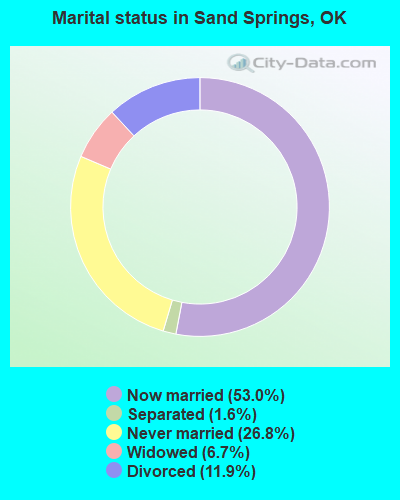
- Never married: 26.8%
- Now married: 53.0%
- Separated: 1.6%
- Widowed: 6.7%
- Divorced: 11.9%
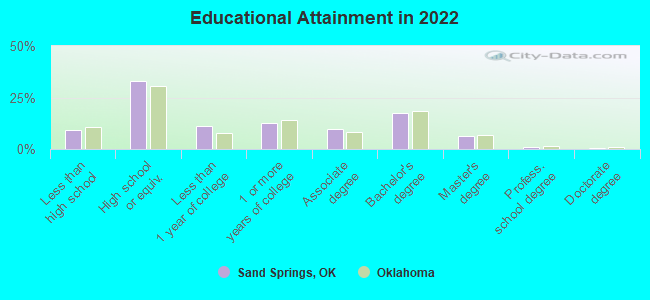
For population 25 years and over in Sand Springs:
- High school or higher: 90.4%
- Bachelor's degree or higher: 23.8%
- Graduate or professional degree: 7.0%
- Unemployed: 4.4%
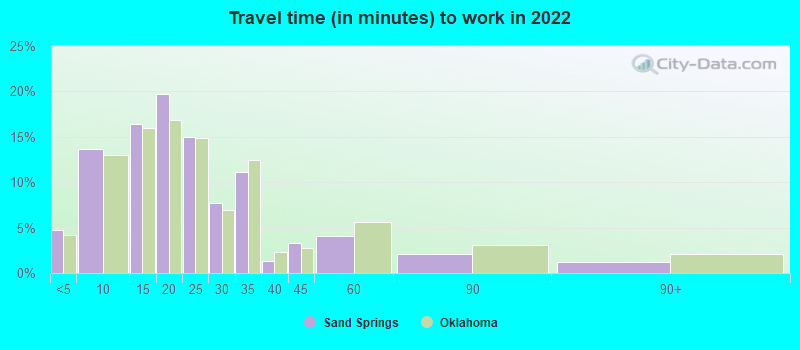
- Mean travel time to work (commute): 18.4 minutes
| Here: | 9.7 |
| Oklahoma average: | 11.3 |
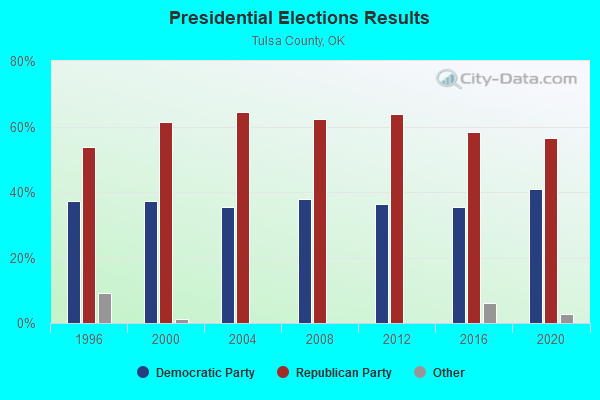
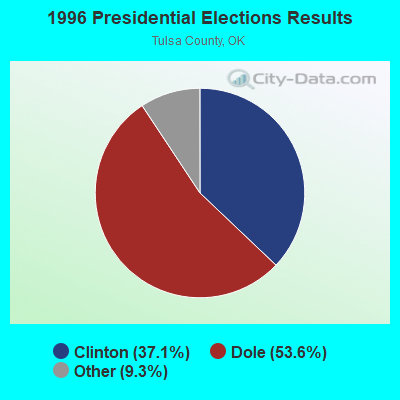
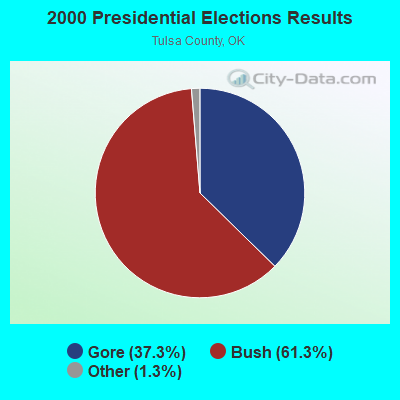

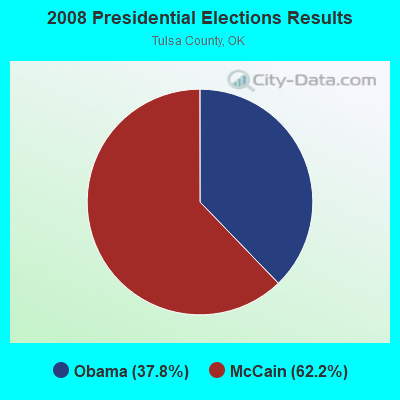
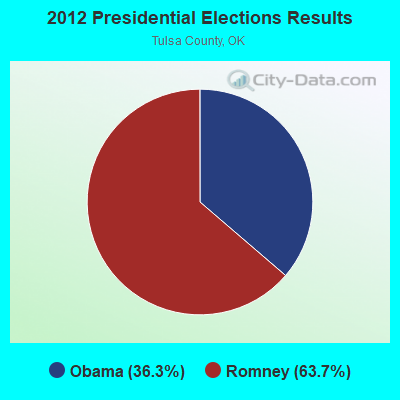
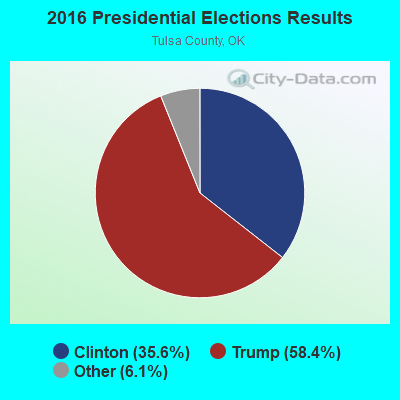
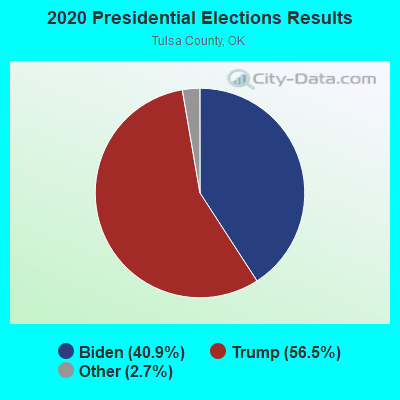
Graphs represent county-level data. Detailed 2008 Election Results
Religion statistics for Sand Springs, OK (based on Tulsa County data)
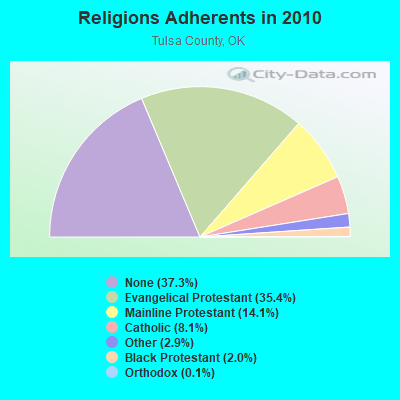
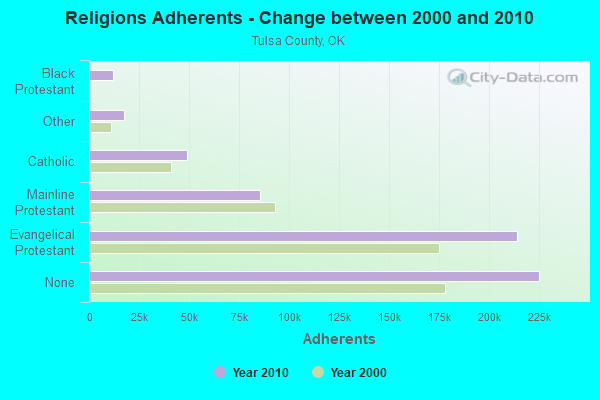
| Religion | Adherents | Congregations |
|---|---|---|
| Evangelical Protestant | 213,615 | 545 |
| Mainline Protestant | 85,250 | 103 |
| Catholic | 49,144 | 23 |
| Other | 17,310 | 49 |
| Black Protestant | 12,226 | 29 |
| Orthodox | 778 | 5 |
| None | 225,080 | - |
Food Environment Statistics:
| Here: | 1.51 / 10,000 pop. |
| State: | 1.97 / 10,000 pop. |
| Tulsa County: | 0.15 / 10,000 pop. |
| State: | 0.20 / 10,000 pop. |
| This county: | 0.51 / 10,000 pop. |
| State: | 0.76 / 10,000 pop. |
| This county: | 2.84 / 10,000 pop. |
| Oklahoma: | 4.35 / 10,000 pop. |
| Tulsa County: | 8.37 / 10,000 pop. |
| Oklahoma: | 6.89 / 10,000 pop. |
| Tulsa County: | 9.4% |
| Oklahoma: | 10.3% |
| Tulsa County: | 27.3% |
| Oklahoma: | 29.2% |
Health and Nutrition:
| Sand Springs: | 49.4% |
| Oklahoma: | 48.6% |
| Sand Springs: | 46.5% |
| Oklahoma: | 45.2% |
| Sand Springs: | 28.8 |
| Oklahoma: | 28.7 |
| Sand Springs: | 22.2% |
| State: | 21.4% |
| Sand Springs: | 10.2% |
| Oklahoma: | 10.8% |
| Here: | 6.8 |
| Oklahoma: | 6.8 |
| Sand Springs: | 35.1% |
| Oklahoma: | 33.9% |
| Sand Springs: | 56.2% |
| Oklahoma: | 55.2% |
| Here: | 78.6% |
| State: | 78.4% |
More about Health and Nutrition of Sand Springs, OK Residents
| Local government employment and payroll (March 2022) | |||||
| Function | Full-time employees | Monthly full-time payroll | Average yearly full-time wage | Part-time employees | Monthly part-time payroll |
|---|---|---|---|---|---|
| Firefighters | 33 | $189,751 | $69,000 | 0 | $0 |
| Police Protection - Officers | 28 | $154,003 | $66,001 | 0 | $0 |
| Water Supply | 26 | $83,450 | $38,515 | 0 | $0 |
| Sewerage | 18 | $60,171 | $40,114 | 0 | $0 |
| Parks and Recreation | 13 | $48,402 | $44,679 | 5 | $5,607 |
| Police - Other | 12 | $55,718 | $55,718 | 0 | $0 |
| Other and Unallocable | 11 | $58,262 | $63,559 | 0 | $0 |
| Financial Administration | 9 | $41,702 | $55,603 | 1 | $822 |
| Solid Waste Management | 9 | $31,390 | $41,853 | 0 | $0 |
| Streets and Highways | 8 | $25,389 | $38,084 | 0 | $0 |
| Other Government Administration | 7 | $44,531 | $76,339 | 0 | $0 |
| Housing and Community Development (Local) | 4 | $17,929 | $53,787 | 1 | $332 |
| Fire - Other | 3 | $9,199 | $36,796 | 0 | $0 |
| Judicial and Legal | 2 | $6,359 | $38,154 | 3 | $2,325 |
| Health | 2 | $3,909 | $23,454 | 1 | $1,426 |
| Airports | 1 | $4,693 | $56,316 | 2 | $2,400 |
| Totals for Government | 186 | $834,858 | $53,862 | 13 | $12,913 |
Sand Springs government finances - Expenditure in 2021 (per resident):
- Construction - Water Utilities: $1,022,000 ($51.02)
Sewerage: $455,000 ($22.71)
Air Transportation: $280,000 ($13.98)
Regular Highways: $227,000 ($11.33)
- Current Operations - Water Utilities: $5,881,000 ($293.59)
Police Protection: $5,166,000 ($257.90)
Local Fire Protection: $4,248,000 ($212.07)
Sewerage: $2,401,000 ($119.86)
Parks and Recreation: $2,281,000 ($113.87)
Solid Waste Management: $1,347,000 ($67.25)
Housing and Community Development: $1,344,000 ($67.10)
Central Staff Services: $1,193,000 ($59.56)
Financial Administration: $1,003,000 ($50.07)
Regular Highways: $816,000 ($40.74)
General - Other: $753,000 ($37.59)
Air Transportation: $475,000 ($23.71)
Judicial and Legal Services: $170,000 ($8.49)
Public Welfare Institutions: $3,000 ($0.15)
- General - Interest on Debt: $1,327,000 ($66.25)
- Other Capital Outlay - Housing and Community Development: $3,562,000 ($177.82)
Parks and Recreation: $1,868,000 ($93.26)
Regular Highways: $792,000 ($39.54)
Sewerage: $339,000 ($16.92)
Water Utilities: $234,000 ($11.68)
Central Staff Services: $193,000 ($9.64)
Police Protection: $155,000 ($7.74)
Solid Waste Management: $40,000 ($2.00)
Local Fire Protection: $36,000 ($1.80)
General - Other: $23,000 ($1.15)
Air Transportation: $4,000 ($0.20)
- Total Salaries and Wages: $9,166,000 ($457.59)
- Water Utilities - Interest on Debt: $894,000 ($44.63)
Sand Springs government finances - Revenue in 2021 (per resident):
- Charges - Sewerage: $4,902,000 ($244.72)
Solid Waste Management: $2,168,000 ($108.23)
Other: $883,000 ($44.08)
Parks and Recreation: $545,000 ($27.21)
Air Transportation: $369,000 ($18.42)
- Federal Intergovernmental - Other: $2,468,000 ($123.21)
Air Transportation: $250,000 ($12.48)
Water Utilities: $140,000 ($6.99)
- Local Intergovernmental - General Local Government Support: $1,327,000 ($66.25)
- Miscellaneous - General Revenue - Other: $875,000 ($43.68)
Fines and Forfeits: $230,000 ($11.48)
Interest Earnings: $151,000 ($7.54)
Rents: $48,000 ($2.40)
Donations From Private Sources: $6,000 ($0.30)
- Revenue - Water Utilities: $8,775,000 ($438.07)
- State Intergovernmental - General Local Government Support: $865,000 ($43.18)
Highways: $180,000 ($8.99)
- Tax - General Sales and Gross Receipts: $16,888,000 ($843.09)
Property: $3,025,000 ($151.02)
Public Utilities Sales: $818,000 ($40.84)
Other Selective Sales: $258,000 ($12.88)
Occupation and Business License - Other: $181,000 ($9.04)
Other: $181,000 ($9.04)
Sand Springs government finances - Debt in 2021 (per resident):
- Long Term Debt - Beginning Outstanding - Unspecified Public Purpose: $65,359,000 ($3262.89)
Outstanding Unspecified Public Purpose: $58,984,000 ($2944.64)
Retired Unspecified Public Purpose: $29,805,000 ($1487.94)
Issue, Unspecified Public Purpose: $23,430,000 ($1169.69)
Sand Springs government finances - Cash and Securities in 2021 (per resident):
- Bond Funds - Cash and Securities: $115,000 ($5.74)
- Other Funds - Cash and Securities: $59,921,000 ($2991.41)
- Sinking Funds - Cash and Securities: $1,984,000 ($99.05)
6.72% of this county's 2021 resident taxpayers lived in other counties in 2020 ($57,121 average adjusted gross income)
| Here: | 6.72% |
| Oklahoma average: | 8.28% |
0.01% of residents moved from foreign countries ($143 average AGI)
Tulsa County: 0.01% Oklahoma average: 0.04%
Top counties from which taxpayers relocated into this county between 2020 and 2021:
| from Wagoner County, OK | |
| from Rogers County, OK | |
| from Creek County, OK |
6.70% of this county's 2020 resident taxpayers moved to other counties in 2021 ($60,995 average adjusted gross income)
| Here: | 6.70% |
| Oklahoma average: | 7.66% |
0.01% of residents moved to foreign countries ($93 average AGI)
Tulsa County: 0.01% Oklahoma average: 0.03%
Top counties to which taxpayers relocated from this county between 2020 and 2021:
| to Wagoner County, OK | |
| to Rogers County, OK | |
| to Creek County, OK |
| Businesses in Sand Springs, OK | ||||
| Name | Count | Name | Count | |
|---|---|---|---|---|
| AT&T | 1 | Little Caesars Pizza | 1 | |
| Advance Auto Parts | 1 | Long John Silver's | 1 | |
| Arby's | 2 | McDonald's | 2 | |
| AutoZone | 1 | Papa John's Pizza | 1 | |
| Best Western | 1 | Payless | 1 | |
| Blockbuster | 1 | Pizza Hut | 1 | |
| Carl\s Jr. | 1 | RadioShack | 1 | |
| Chevrolet | 1 | SONIC Drive-In | 2 | |
| Church's Chicken | 1 | Subway | 3 | |
| Cricket Wireless | 2 | T-Mobile | 3 | |
| Domino's Pizza | 1 | Taco Bell | 1 | |
| FedEx | 2 | True Value | 1 | |
| GNC | 1 | U-Haul | 3 | |
| GameStop | 1 | UPS | 4 | |
| H&R Block | 1 | Walgreens | 1 | |
| IHOP | 1 | Walmart | 1 | |
| KFC | 1 | Wendy's | 1 | |
| Lane Furniture | 1 | |||
Strongest AM radio stations in Sand Springs:
- KRMG (740 AM; 50 kW; TULSA, OK; Owner: CXR HOLDINGS, INC.)
- KTFX (1340 AM; 1 kW; SAND SPRINGS, OK; Owner: K95.5, INC.)
- KFAQ (1170 AM; 50 kW; TULSA, OK; Owner: JOURNAL BROADCAST CORPORATION)
- KTBZ (1430 AM; 25 kW; TULSA, OK; Owner: CLEAR CHANNEL BROADCASTING LICENSES, INC.)
- KMUS (1380 AM; 20 kW; MUSKOGEE, OK; Owner: ABC, INC.)
- KCFO (970 AM; 2 kW; TULSA, OK; Owner: FRIENDSHIP BROADCASTING, L. P.)
- KGTO (1050 AM; 1 kW; TULSA, OK; Owner: KJMM, INC.)
- KYAL (1550 AM; 2 kW; SAPULPA, OK; Owner: KXOJ, INC.)
- KAKC (1300 AM; 5 kW; TULSA, OK; Owner: CLEAR CHANNEL BROADCASTING LICENSES, INC.)
- KOMA (1520 AM; 50 kW; OKLAHOMA CITY, OK; Owner: RENDA BROADCASTING CORP. OF NEVADA)
- KXTD (1530 AM; daytime; 5 kW; WAGONER, OK; Owner: GAYTAN-GALVAN LIMITED LIABILITY COMP)
- KGGF (690 AM; 10 kW; COFFEYVILLE, KS; Owner: KGGF-KUSN, INC.)
- WHB (810 AM; 50 kW; KANSAS CITY, MO; Owner: UNION BROADCASTING, INC.)
Strongest FM radio stations in Sand Springs:
- KBEZ (92.9 FM; TULSA, OK; Owner: RENDA BROADCASTING CORP. OF NEVADA)
- KVOO-FM (98.5 FM; TULSA, OK; Owner: JOURNAL BROADCAST CORPORATION)
- KMOD-FM (97.5 FM; TULSA, OK; Owner: CLEAR CHANNEL BROADCASTING LICENSES, INC.)
- KRAV-FM (96.5 FM; TULSA, OK; Owner: CXR HOLDINGS, INC.)
- KWEN (95.5 FM; TULSA, OK; Owner: CXR HOLDINGS, INC.)
- KIZS (92.1 FM; BROKEN ARROW, OK; Owner: CLEAR CHANNEL BROADCASTING LICENSES, INC.)
- KRTQ (102.3 FM; SAND SPRINGS, OK; Owner: CXR HOLDINGS, INC.)
- KXOJ-FM (100.9 FM; SAPULPA, OK; Owner: KXOJ, INC.)
- KJMM (105.3 FM; BIXBY, OK; Owner: KJMM, INC.)
- KNYD (90.5 FM; BROKEN ARROW, OK; Owner: CREATIVE EDUCATIONAL MEDIA CORP. INC)
- KXBL (99.5 FM; HENRYETTA, OK; Owner: JOURNAL BROADCAST CORPORATION)
- KJSR (103.3 FM; TULSA, OK; Owner: CXR HOLDINGS, INC.)
- KTSO (94.1 FM; OKMULGEE, OK; Owner: SHAMROCK COMMUNICATIONS, INC)
- KMYZ-FM (104.5 FM; PRYOR, OK; Owner: SHAMROCK COMMUNICATIONS, INC.)
- KWGS (89.5 FM; TULSA, OK; Owner: THE UNIVERSITY OF TULSA)
- KHTT (106.9 FM; MUSKOGEE, OK; Owner: RENDA BROADCASTING CORP. OF NEVADA)
- KQLL-FM (106.1 FM; OWASSO, OK; Owner: CLEAR CHANNEL BROADCASTING LICENSES, INC.)
- KTBT (101.5 FM; COLLINSVILLE, OK; Owner: CLEAR CHANNEL BROADCASTING LICENSES, INC.)
TV broadcast stations around Sand Springs:
- KLOT-LP (Channel 25; TULSA, OK; Owner: EQUITY BROADCASTING CORPORATION)
- K39CW (Channel 39; TULSA, OK; Owner: VENTANA TELEVISION, INC.)
- KTZT-LP (Channel 29; TULSA, OK; Owner: ARACELIS ORTIZ, EXECUTRIX OF THE ESTATE OF CARLOS ORTIZ)
- KOPE-LP (Channel 51; TULSA, OK; Owner: COPELAND BROADCASTING CORPORATION)
- K33EK (Channel 33; TULSA, OK; Owner: LOCKE SUPPLY CO.)
- KJRH (Channel 2; TULSA, OK; Owner: SCRIPPS HOWARD BROADCASTING COMPANY)
- KGEB (Channel 53; TULSA, OK; Owner: UNIVERSITY BROADCASTING, INC.)
- KOED-TV (Channel 11; TULSA, OK; Owner: OKLAHOMA EDUCATIONAL TELEVISION AUTHORITY)
- KOTV (Channel 6; TULSA, OK; Owner: GRIFFIN LICENSING, L.L.C.)
- KWHB (Channel 47; TULSA, OK; Owner: LESEA BROADCASTING CORPORATION)
- KTUL (Channel 8; TULSA, OK; Owner: KTUL, LLC)
- KTPX (Channel 44; OKMULGEE, OK; Owner: PAXSON TULSA LICENSE, INC.)
- KTFO (Channel 41; TULSA, OK; Owner: CLEAR CHANNEL BROADCASTING LICENSES, INC.)
- KOKI-TV (Channel 23; TULSA, OK; Owner: CLEAR CHANNEL BROADCASTING LICENSES, INC.)
- K15DA (Channel 15; TULSA, OK; Owner: LOCKE SUPPLY CO.)
- KDOR (Channel 17; BARTLESVILLE, OK; Owner: TRINITY BROADCASTING NETWORK)
- K69GO (Channel 69; TULSA, OK; Owner: THREE ANGELS BROADCASTING NETWORK)
- KRSC-TV (Channel 35; CLAREMORE, OK; Owner: BOARD OF REGENTS OF OKLAHOMA COLLEGES)
- KWBT (Channel 19; MUSKOGEE, OK; Owner: TULSA COMMUNICATIONS, L.L.C.)
- K04NZ (Channel 4; TULSA, OK; Owner: GERALD BROTHERS)
- National Bridge Inventory (NBI) Statistics
- 92Number of bridges
- 1,198ft / 365mTotal length
- $105,052,000Total costs
- 610,019Total average daily traffic
- 70,852Total average daily truck traffic
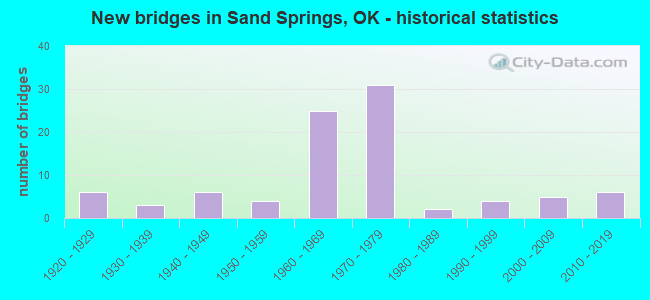
- New bridges - historical statistics
- 61920-1929
- 31930-1939
- 61940-1949
- 41950-1959
- 251960-1969
- 311970-1979
- 21980-1989
- 41990-1999
- 52000-2009
- 62010-2019
FCC Registered Antenna Towers: 164 (See the full list of FCC Registered Antenna Towers)
FCC Registered Commercial Land Mobile Towers: 3 (See the full list of FCC Registered Commercial Land Mobile Towers in Sand Springs, OK)
FCC Registered Private Land Mobile Towers: 2 (See the full list of FCC Registered Private Land Mobile Towers)
FCC Registered Broadcast Land Mobile Towers: 28 (See the full list of FCC Registered Broadcast Land Mobile Towers)
FCC Registered Microwave Towers: 39 (See the full list of FCC Registered Microwave Towers in this town)
FCC Registered Maritime Coast & Aviation Ground Towers: 3 (See the full list of FCC Registered Maritime Coast & Aviation Ground Towers)
FCC Registered Amateur Radio Licenses: 198 (See the full list of FCC Registered Amateur Radio Licenses in Sand Springs)
FAA Registered Aircraft: 43 (See the full list of FAA Registered Aircraft in Sand Springs)
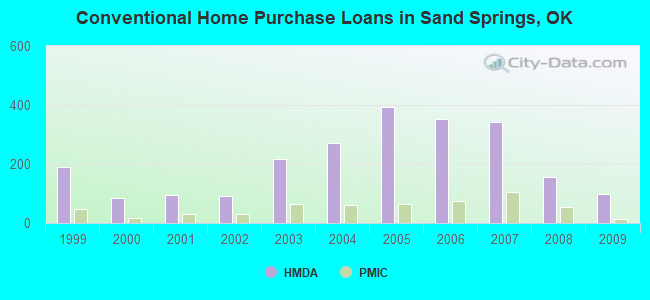
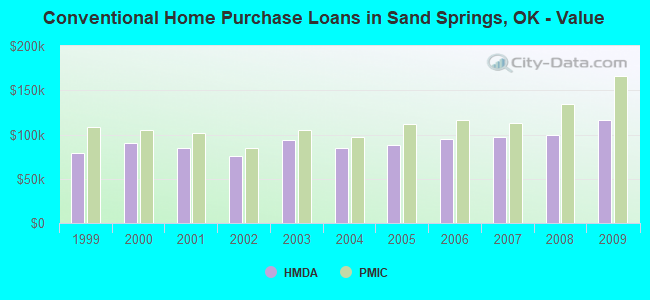
| Home Mortgage Disclosure Act Aggregated Statistics For Year 2009 (Based on 2 full and 7 partial tracts) | ||||||||||||||
| A) FHA, FSA/RHS & VA Home Purchase Loans | B) Conventional Home Purchase Loans | C) Refinancings | D) Home Improvement Loans | E) Loans on Dwellings For 5+ Families | F) Non-occupant Loans on < 5 Family Dwellings (A B C & D) | G) Loans On Manufactured Home Dwelling (A B C & D) | ||||||||
|---|---|---|---|---|---|---|---|---|---|---|---|---|---|---|
| Number | Average Value | Number | Average Value | Number | Average Value | Number | Average Value | Number | Average Value | Number | Average Value | Number | Average Value | |
| LOANS ORIGINATED | 156 | $115,577 | 99 | $116,544 | 339 | $125,315 | 65 | $34,385 | 2 | $270,115 | 37 | $72,816 | 14 | $28,764 |
| APPLICATIONS APPROVED, NOT ACCEPTED | 4 | $120,695 | 12 | $134,958 | 37 | $122,704 | 4 | $21,208 | 0 | $0 | 2 | $119,990 | 5 | $51,844 |
| APPLICATIONS DENIED | 17 | $101,773 | 24 | $89,250 | 129 | $116,778 | 50 | $22,593 | 0 | $0 | 15 | $51,835 | 10 | $71,397 |
| APPLICATIONS WITHDRAWN | 15 | $99,816 | 10 | $114,474 | 127 | $142,771 | 12 | $52,425 | 0 | $0 | 5 | $54,518 | 3 | $53,803 |
| FILES CLOSED FOR INCOMPLETENESS | 3 | $92,530 | 3 | $69,627 | 53 | $119,966 | 1 | $60,000 | 0 | $0 | 4 | $62,008 | 1 | $41,000 |
Detailed HMDA statistics for the following Tracts: 0065.06 , 0065.07, 0092.00, 0093.00, 0094.01, 0094.02, 0095.00
| Private Mortgage Insurance Companies Aggregated Statistics For Year 2009 (Based on 2 full and 7 partial tracts) | ||||||
| A) Conventional Home Purchase Loans | B) Refinancings | C) Non-occupant Loans on < 5 Family Dwellings (A & B) | ||||
|---|---|---|---|---|---|---|
| Number | Average Value | Number | Average Value | Number | Average Value | |
| LOANS ORIGINATED | 14 | $166,003 | 22 | $150,815 | 1 | $170,000 |
| APPLICATIONS APPROVED, NOT ACCEPTED | 6 | $125,973 | 11 | $166,054 | 1 | $183,770 |
| APPLICATIONS DENIED | 7 | $157,007 | 3 | $152,763 | 3 | $180,000 |
| APPLICATIONS WITHDRAWN | 3 | $71,753 | 1 | $120,300 | 0 | $0 |
| FILES CLOSED FOR INCOMPLETENESS | 1 | $43,000 | 1 | $181,130 | 0 | $0 |
Detailed PMIC statistics for the following Tracts: 0065.06 , 0065.07, 0092.00, 0093.00, 0094.01, 0094.02, 0095.00
2002 - 2018 National Fire Incident Reporting System (NFIRS) incidents
- Fire incident types reported to NFIRS in Sand Springs, OK
- 2,70563.7%Outside Fires
- 82619.5%Structure Fires
- 58613.8%Mobile Property/Vehicle Fires
- 1293.0%Other
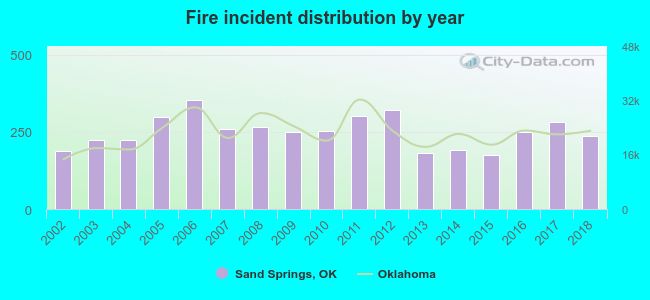 According to the data from the years 2002 - 2018 the average number of fires per year is 250. The highest number of reported fire incidents - 352 took place in 2006, and the least - 175 in 2015. The data has a rising trend.
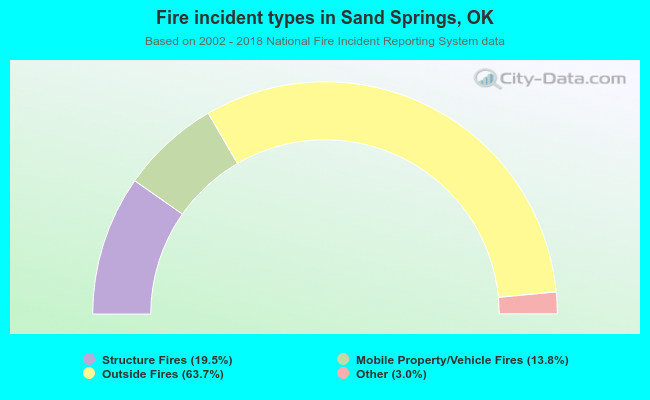 When looking into fire subcategories, the most reports belonged to: Outside Fires (63.7%), and Structure Fires (19.5%).
| Most common first names in Sand Springs, OK among deceased individuals | ||
| Name | Count | Lived (average) |
|---|---|---|
| James | 160 | 69.9 years |
| William | 147 | 71.5 years |
| John | 137 | 71.5 years |
| Mary | 123 | 78.5 years |
| Robert | 103 | 70.1 years |
| Charles | 102 | 73.9 years |
| George | 66 | 73.8 years |
| Ruth | 57 | 80.7 years |
| Betty | 48 | 70.4 years |
| Helen | 44 | 75.5 years |
| Most common last names in Sand Springs, OK among deceased individuals | ||
| Last name | Count | Lived (average) |
|---|---|---|
| Smith | 71 | 73.4 years |
| Johnson | 71 | 73.5 years |
| Jones | 64 | 73.6 years |
| Williams | 53 | 77.6 years |
| Brown | 50 | 74.6 years |
| Wilson | 45 | 70.7 years |
| Davis | 38 | 70.8 years |
| Thompson | 34 | 69.3 years |
| Anderson | 33 | 71.6 years |
| Miller | 33 | 74.4 years |
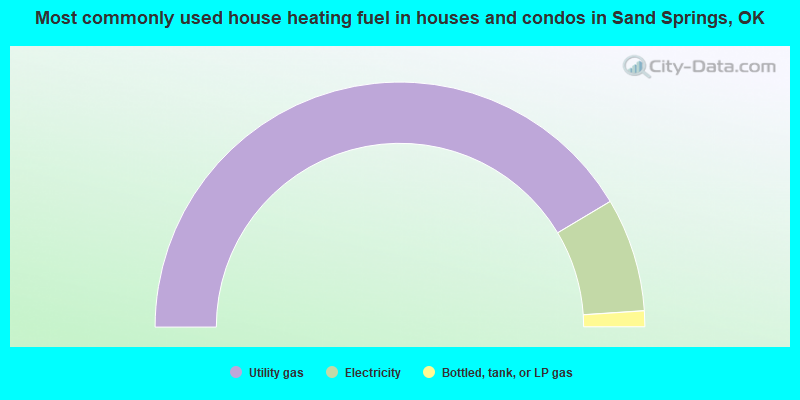
- 82.8%Utility gas
- 15.0%Electricity
- 2.1%Bottled, tank, or LP gas
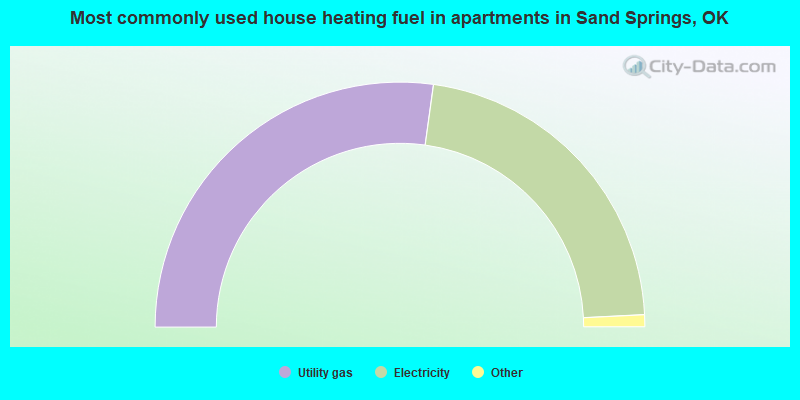
- 54.4%Utility gas
- 44.0%Electricity
- 1.0%Bottled, tank, or LP gas
- 0.3%Wood
- 0.3%No fuel used
Sand Springs compared to Oklahoma state average:
- Unemployed percentage significantly below state average.
- Black race population percentage significantly below state average.
- Hispanic race population percentage below state average.
- Foreign-born population percentage significantly below state average.
- Length of stay since moving in above state average.
Sand Springs on our top lists:
- #61 on the list of "Top 101 cities with the largest percentage of people in training schools for juvenile delinquents (population 1,000+)"
- #97 on the list of "Top 101 cities with the largest percentage of people in schools, hospitals, or wards for the mentally retarded (population 1,000+)"
- #101 (74127) on the list of "Top 101 zip codes with the most casinos in 2005"
- #6 on the list of "Top 101 counties with the highest lead air pollution readings in 2012 (µg/m3)"
- #13 on the list of "Top 101 counties with the lowest percentage of residents relocating from foreign countries between 2010 and 2011 (pop. 50,000+)"
- #20 on the list of "Top 101 counties with the most Evangelical Protestant adherents"
- #22 on the list of "Top 101 counties with the most Evangelical Protestant congregations"
- #24 on the list of "Top 101 counties with the lowest lead air pollution readings in 2012 (µg/m3)"

|
|
Total of 94 patent applications in 2008-2024.