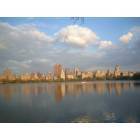
The comparison between Manhattan, an urban gem in New York, and Tulsa, a thriving city in Oklahoma, provides a deep understanding of two distinct approaches to American lifestyles. From the hustle and bustle of holistic city living to the relaxed rhythm of the midwest, both Manhattan and Tulsa offer unique experiences. The contrast ranges from crime rates, cost of living, and weather, extending to education, taxation, and healthcare facilities. This comparison will be beneficial for potential migrants and visitors by offering a comprehensive overview of each city's unique characteristics.
Manhattan has a higher crime rate compared to Tulsa, but it should be noted that crime in Manhattan is mostly non-violent and concentrated in certain neighborhoods. In contrast, Tulsa has a lower overall crime rate. The public safety departments for both cities have implemented strategies and initiatives to reduce crime rates, improving overall safety.
Cost of Living
Living in Manhattan is drastically more expensive than living in Tulsa. Everything from renting an apartment to groceries and transportation comes with a higher price tag in Manhattan. Tulsa, on the other hand, has a cost of living that's below the national average, making it an affordable city to live in.
Income Tax
New York State, including Manhattan, has a progressive income tax system with rates ranging from 4% to 8.82%. Oklahoma’s state income tax is significantly lower, with a maximum rate of 5%.
Property Tax
Both cities have property tax, but rates are higher in Manhattan, reflecting the high costs of real estate. Property tax rates in Tulsa are lower, given the more affordable real estate market.
Sales Tax
New York's combined state and local sales tax rates are relatively high compared to other states. The combined sales tax rate in Tulsa, Oklahoma, is moderate and closer to the national average.
Income
Type
Manhattan
Tulsa
Estimated median household income
$84,435
$51,008
Estimated per capita income
$76,589
$33,002
Cost of living index (U.S. average is 100)
185.3
86.5
If you make $50,000 in Tulsa, you will have to make $107,110 in Manhattan to maintain the same standard of living.
Geographical Conditions
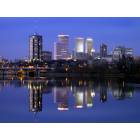
Manhattan is an island bordered by the Hudson, East, and Harlem rivers. Tulsa is located on the Arkansas River, at the foothills of the Ozark Mountains, giving it a more varied landscape.
Geographical information
Type
Manhattan
Tulsa
Land area
23 sq. miles
182.6 sq. miles
Population density
70,629 people per sq. mile
2,252.4 people per sq. mile
Relative area comparison
Manhattan, NY Tulsa, OK
Education
Manhattan has an abundance of high quality academic institutions, including Ivy League schools like Columbia University. Tulsa also has several colleges and universities but their level of prestige does not match that found in Manhattan. However, Tulsa's public school system consistently receives high ratings.
Manhattan boasts a thriving economy influenced by Wall Street, making it a hub for finance-related work. Tulsa's economy is diversified, with sectors such as energy, aviation, telecommunications, and technology contributing significantly.
Biggest Employers
In Manhattan, the biggest employers are largely multinational corporations and financial institutions. Jobs at universities and healthcare providers also feature prominently. In Tulsa, the largest employers are in the healthcare sector, followed by the public school system and the city government.
In Manhattan (New York County), 83.9% voted for Democrats and 14.9% for Republicans in 2012 Presidential Election. In Tulsa (Tulsa County), 36.3% voted for Democrats and 63.7% for Republicans.
Elections
Type
Democrats
Republicans
Other
Year
Manhattan
Tulsa
Manhattan
Tulsa
Manhattan
Tulsa
2020
86.5%
40.9%
12.2%
56.5%
1.2%
2.7%
2016
86.7%
35.6%
9.7%
58.4%
3.6%
6.1%
2012
83.9%
36.3%
14.9%
63.7%
1.2%
0.0%
2008
86.1%
37.8%
13.5%
62.2%
0.3%
0.0%
2004
82.3%
35.6%
16.8%
64.4%
0.9%
0.0%
2000
80.0%
37.3%
14.5%
61.3%
5.5%
1.3%
1996
80.0%
37.1%
13.8%
53.6%
6.3%
9.3%
Breakdown of population affiliated with a religious congregation
Type
Adherents
Congregations
Religion
Manhattan
Tulsa
Manhattan
Tulsa
CATHOLIC CHURCH
20.4%
8.1%
12.6%
3.1%
MUSLIM ESTIMATE
2.7%
0.5%
2.4%
0.7%
EPISCOPAL CHURCH
1.7%
0.8%
5.3%
1.3%
AMERICAN BAPTIST CHURCHES IN THE USA
1.6%
0.3%
4.7%
0.5%
REFORMED CHURCH IN AMERICA
0.6%
0.0%
1.2%
0.0%
PATRIAR PARISHE RUSSIAN ORTHODO CHURCH USA
0.4%
0.0%
0.2%
0.0%
EVANGELICAL LUTHERAN CHURCH IN AMERICA
0.3%
0.4%
2.0%
0.9%
SEVENTH DAY ADVENTIST CHURCH
0.3%
0.4%
2.4%
1.1%
SOUTHERN BAPTIST CONVENTION
0.2%
14.9%
2.9%
18.6%
INTERNA PENTECO HOLINESS CHURCH
0.0%
0.7%
0.2%
0.7%
LUTHERAN CHURCH
0.0%
0.7%
0.6%
1.2%
NATIONAL ASSOCIATION FREE WILL BAPTISTS
0.0%
0.5%
0.0%
3.1%
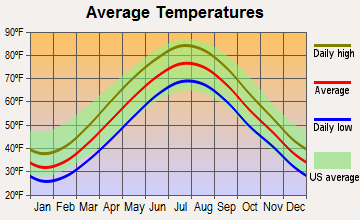
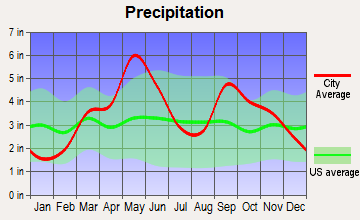
Weather
Manhattan experiences a humid subtropical climate with four distinct seasons, whereas Tulsa is located in Tornado Alley and experiences severe weather occurrences such as tornadoes and hailstorms. However, Tulsa also has a more consistent climate with warmer temperatures throughout the year.
Weather and climate
Type
Manhattan
Tulsa
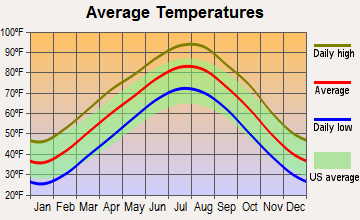
Temperature - Average
54.6°F
60.4°F
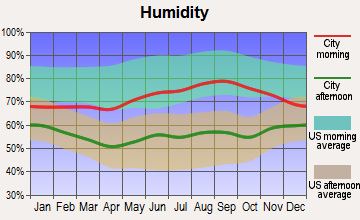
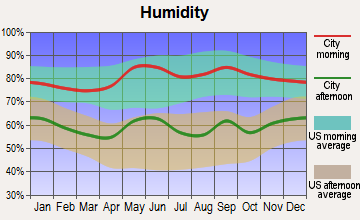
Humidity - Average morning or afternoon humidity
67.4%
73.8%
Humidity - Differences between morning and afternoon humidity
30%
33%
Humidity - Maximum monthly morning or afternoon humidity
77%
85%
Humidity - Minimum monthly morning or afternoon humidity
47%
52%
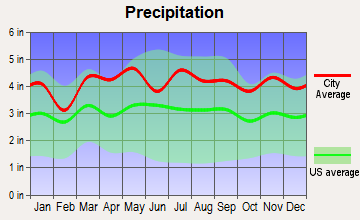
Precipitation - Yearly average
49.6 in
42.1 in
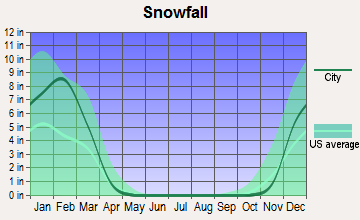
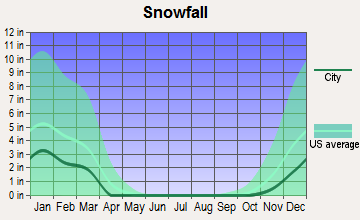
Snowfall - Yearly average
57.4 in
18.4 in
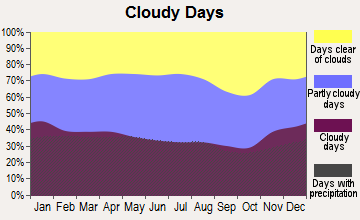
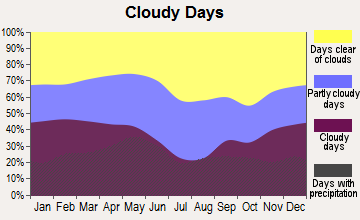
Clouds - Number of days clear of clouds
17.8%
21.1%
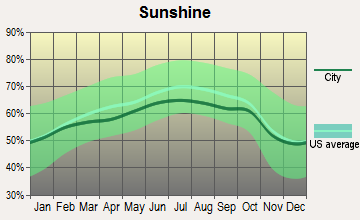
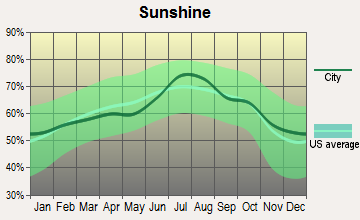
Sunshine amount - Average
60.2%
64.8%
Sunshine amount - Differences during a year
20%
24%
Sunshine amount - Maximum monthly
64%
74%
Sunshine amount - Minimum monthly
44%
50%
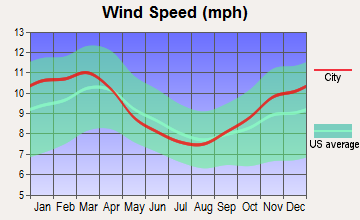
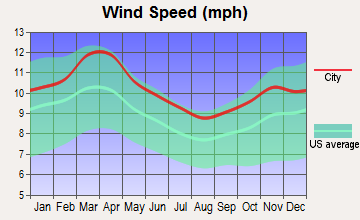
Wind speed - Average
6.7 mph
10.2 mph
Average climate in Manhattan, New York
Average climate in Tulsa, Oklahoma
Air pollution
Type
AQI
CO
NO2
OZONE
PB
PM10
PM25
SO2
Year
Manhattan
Tulsa
Manhattan
Tulsa
Manhattan
Tulsa
Manhattan
Tulsa
Manhattan
Tulsa
Manhattan
Manhattan
Tulsa
Manhattan
Tulsa
2018
94
88
0.29
0.24
17.3
N/A
23.9
28.6
N/A
0.004
N/A
N/A
7.9
11.6
0.5
0.4
2017
97
80
0.16
0.22
17.4
N/A
24.0
29.9
N/A
0.004
N/A
N/A
7.7
10.2
0.4
0.5
2016
94
86
0.28
0.24
18.1
N/A
24.2
29.1
N/A
0.005
N/A
N/A
7.7
9.5
0.6
0.5
2015
100
74
0.36
0.25
18.9
N/A
23.0
28.1
N/A
0.004
N/A
N/A
8.6
8.6
1.0
0.8
2014
95
74
0.40
0.16
19.1
N/A
22.3
29.2
N/A
0.005
N/A
N/A
8.3
9.2
1.1
0.3
2013
97
85
0.43
0.21
19.5
N/A
22.6
29.8
N/A
0.005
N/A
N/A
9.0
10.1
1.1
0.5
2012
99
103
0.46
0.21
18.6
N/A
23.4
32.4
N/A
0.007
N/A
N/A
9.3
11.7
1.7
0.7
2011
108
108
0.46
0.27
20.7
N/A
22.2
33.8
N/A
0.005
N/A
N/A
10.9
13.8
2.7
0.8
2010
113
83
0.45
0.26
19.3
N/A
23.3
30.1
N/A
0.004
N/A
N/A
10.4
12.2
2.7
0.7
2009
104
88
0.51
0.26
21.9
N/A
18.8
29.8
N/A
0.004
N/A
N/A
10.7
12.2
3.8
0.7
2008
110
71
0.49
N/A
23.0
N/A
19.8
26.7
0.013
0.007
N/A
N/A
12.3
N/A
4.6
N/A
2007
121
77
0.56
0.32
24.4
N/A
19.4
28.8
0.016
0.007
N/A
N/A
13.1
N/A
5.5
0.8
2006
116
95
0.64
N/A
24.6
N/A
18.9
32.9
0.018
N/A
N/A
N/A
12.9
N/A
6.5
N/A
2005
112
84
0.77
N/A
26.7
N/A
18.4
28.9
N/A
N/A
N/A
N/A
N/A
N/A
8.2
N/A
2004
108
71
0.77
N/A
26.7
N/A
17.3
27.5
0.030
N/A
N/A
N/A
N/A
N/A
8.0
N/A
2003
107
94
0.83
N/A
27.8
N/A
17.5
29.2
0.024
N/A
26.9
N/A
N/A
N/A
8.2
N/A
2002
122
85
0.78
0.83
27.9
7.8
18.7
27.7
0.008
N/A
25.9
N/A
N/A
N/A
7.3
N/A
2001
123
102
0.79
0.75
29.4
14.4
19.4
30.6
0.020
N/A
25.0
N/A
N/A
N/A
8.7
N/A
2000
115
101
0.90
0.69
30.2
15.3
15.0
28.9
0.022
N/A
22.2
N/A
N/A
N/A
8.4
N/A
Natural disasters
Type
Manhattan
Tulsa
Tornado activity compared to U.S. average
59.1%
277.6%
Earthquake activity compared to U.S. average
31.1%
901.9%
Natural disasters compared to U.S. average
18%
34%
Transportation
Manhattan is well-served by MTA public transit, including subways and buses. Tulsa’s public transportation is primarily bus-based, and many residents rely on personal vehicles for commuting.
Transport
Type
Manhattan
Tulsa
Amtrak stations
0
1
Amtrak stations nearby
3
1
FAA registered aircraft
2
808
FAA registered aircraft manufacturers and dealers
0
35
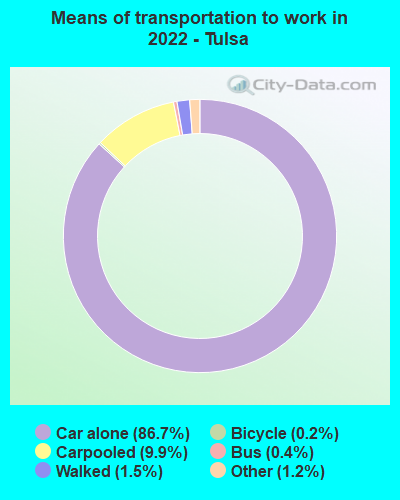
Means of transportation to work
Type
Manhattan
Tulsa
Bicycle
0.9%
0.1%
Bus
10.1%
0.1%
Carpooled
3.4%
9%
Car alone
7.6%
87.9%
Motorcycle
0.1%
0.1%
Railroad
1.1%
0%
Streetcar
0.1%
0%
Subway
43.6%
0%
Taxicab
4.7%
0.1%
Walked
21.9%
1.4%
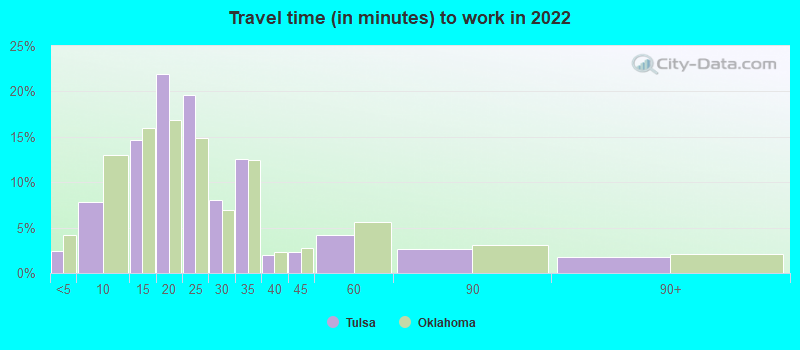
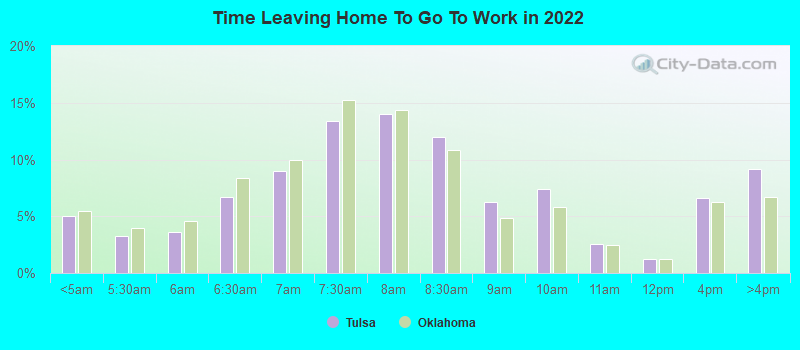
Average travel time to work
Type
Manhattan
Tulsa
Average
30.3 min
23.8 min
Real Estate
Manhattan's real-estate market is one of the most expensive in the world with housing options ranging from luxury condos to brownstones. Real-estate in Tulsa, on the other hand, is reasonably priced, making homeownership more attainable.
Neighborhoods
Manhattan is divided into iconic neighborhoods, each with its own unique culture, including Hell’s Kitchen, Greenwich Village, and Upper East Side. Tulsa's neighborhoods, like Brookside and Cherry Street, offer a mix of suburban and urban living.
Houses and residents
Type
Manhattan
Tulsa
Houses
798,144
194,402
Average household size (people)
2
2.3
Houses occupied
738,644 (92.5%)
173,943 (89.5%)
Houses occupied by owners
148,695 (20.1%)
89,307 (51.3%)
Houses occupied by renters
589,949 (79.9%)
84,636 (48.7%)
Median rent asked for vacant for-rent units
$1,690
$899.30
Median price asked for vacant for-sale houses and condos
$3,393,315
$163,212
Estimated median house or condo value
$940,900
$172,000
Median number of rooms in apartments
3.2
4.1
Median number of rooms in houses and condos
4
6.4
Renting percentage
77.2%
46.5%
Housing density (houses/condos per square mile)
34,757
1,064.4
Household income disparities
47.8%
48.1%
Housing units without a mortgage
1,104 (40.3%)
855 (1.7%)
Housing units with both a second mortgage and home equity loan
13 (0.5%)
2,464 (4.8%)
Housing units with a mortgage
1,636 (59.7%)
50,494 (98.3%)
Housing units with a home equity loan
140 (5.1%)
93 (0.2%)
Housing units with a second mortgage
140 (5.1%)
3,580 (7%)
Housing units lacking complete kitchen facilities
2%
2.9%
Housing units lacking complete plumbing facilities
Self-employed workers in own not incorporated business
69,517
13,964
State government workers
15,544
5,897
Unpaid family workers
1,861
284
Industries and Occupations
The dominant industries in Manhattan include finance, fashion, publishing, and entertainment, providing a diverse range of job opportunities. Tulsa's key industries are oil & gas, aerospace & defense, and healthcare, offering a unique occupational spectrum for its residents.
Manhattan's healthcare system is world-class, with globally ranked institutions like NYU Langone and Mount Sinai. Tulsa has solid healthcare facilities and some notable institutions but does not have the same level of global recognition.
Health (county statistics)
Type
Manhattan
Tulsa
General health status score of residents in this county from 1 (poor) to 5 (excellent)
Manhattan is home to an extensive infrastructure network, including prominent landmarks, world-class hospitals, and an expansive public transportation system. Tulsa also has good infrastructure but it's not as extensively developed or internationally recognized as Manhattan's.
Infrastructure
Type
Manhattan
Tulsa
TV stations
30
20
Culture and Food
Manhattan is globally acclaimed for its cultural presence. It's home to Broadway, museums, and a diverse food scene. By contrast, Tulsa enjoys a vibrant local culture, with a growing arts scene and traditional American cuisine being prominent.
Sports Teams
Manhattan is home to world-renowned sports teams like the New York Knicks and the Yankees. Tulsa boasts minor league teams and has a strong college sports culture, particularly around football.
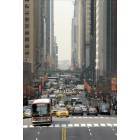


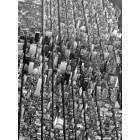
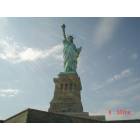


 Manhattan, NY
 Tulsa, OK