San Diego, CA vs Anaheim, CA - Advanced U.S. city comparison tool

San Diego, CA vs Anaheim, CA

The comparison between San Diego and Anaheim gives a comprehensive idea of what life could potentially be like in each city. Both situated in California, these settings offer a mix of similarities and differences that cater to various preferences. From the weather to infrastructure, and work opportunities to cultural diversity, there are many considerations for both residents and tourists. Factors like cost and quality of living, safety, education, and entertainment options contribute to the overall experience in these cities. This analysis will provide specific insights into these key aspects to aid in your decision, whether you're planning to relocate or visit.
 
 
Distance between San Diego, CA and Anaheim, CA : 84.7 miles

San Diego's population is larger by 299%. Its population has grown by 158,211 people (12.9%) since 2000. The population of Anaheim has grown by 17,926 people (5.5%) during that time.

Population
Type San Diego Anaheim
Population 1,381,611 345,940
Female / male percentage 48.8% / 51.2%
48.8%
51.2%
51.2% / 48.8%
51.2%
48.8%
Racial makeup - percentage
Ethnicity San DiegoAnaheim
White Non-Hispanic 41.9% 25.0%
Hispanic 29.0% 52.0%
Asian 16.9% 17.4%
Black 5.5% 2.4%
Two or more 5.3% 2.5%
Pacific Islander 0.5% 0.5%
American Indian 0.2% 0.2%
Racial makeup - absolute values
Ethnicity San DiegoAnaheim
White Non-Hispanic 579,373 86,435
Hispanic 400,337 179,761
Asian 233,618 60,234
Black 75,323 8,279
Two or more 73,108 8,502
Pacific Islander 6,302 1,567
American Indian 2,753 590

Crime and Safety

Comparatively, Anaheim has a higher crime rate than San Diego. Though both cities dedicate great resources to ensure public safety, San Diego is generally considered safer and ranks favorably for crime on national scales. Anaheim has been proactive in implementing community-focused policies to reduce crime, which is key for tourists and potential residents. Regardless, like any urban area, personal vigilance and awareness are important.

Crime by year per 100,000 residents
Type City-data.com crime indexRobberies per 100,000Murders per 100,000Rapes per 100,000Assaults per 100,000Burglaries per 100,000Theft per 100,000Auto theft per 100,000Arson per 100,000
Year San DiegoAnaheimSan DiegoAnaheimSan DiegoAnaheimSan DiegoAnaheimSan DiegoAnaheimSan DiegoAnaheimSan DiegoAnaheimSan DiegoAnaheimSan DiegoAnaheim
2020 197.8 244.1 84.0 117.1 3.9 4.5 33.7 37.8 247.3 193.2 231.2 349.2 1,116.0 1,675.7 344.5 494.2 15.4 13.9
2019 208.3 219.2 93.4 111.9 3.5 2.3 38.9 39.8 226.0 162.5 245.7 317.3 1,278.0 1,668.2 358.7 347.8 8.5 12.4
2018 212.9 231.8 100.2 114.7 2.4 2.0 42.1 40.0 228.4 179.3 261.2 396.9 1,286.6 1,669.1 360.7 387.0 13.0 7.6
2017 207.4 243.4 99.0 135.8 2.5 2.8 39.3 32.5 225.9 183.4 268.0 382.3 1,214.4 1,809.0 360.6 439.2 11.1 12.7
2016 223.5 240.8 98.1 110.3 3.5 2.0 40.5 34.8 235.1 194.9 335.6 415.6 1,276.5 1,913.4 413.1 391.5 16.9 9.3
2015 227.4 263.4 98.4 125.6 2.6 5.2 40.4 36.9 257.1 196.0 366.2 422.4 1,351.9 1,972.4 363.9 477.6 12.4 8.0
2014 210.5 216.9 96.3 120.5 2.3 4.0 27.1 22.8 255.2 170.1 373.7 375.0 1,219.5 1,619.8 365.8 367.5 15.3 6.6
2013 235.0 241.2 107.9 126.5 2.9 3.2 23.4 23.7 258.8 173.8 471.0 408.9 1,425.2 1,887.5 455.3 486.8 13.2 10.1
2012 241.6 256.7 113.3 127.7 3.5 4.4 22.7 23.8 273.5 215.4 440.9 465.9 1,433.6 2,039.0 493.8 418.0 13.7 7.8
2011 229.7 240.3 110.6 131.1 2.9 4.4 22.2 30.9 251.9 210.2 443.5 414.4 1,337.2 1,753.0 475.3 328.9 11.6 7.6
2010 244.5 230.2 125.1 146.3 2.2 2.1 22.9 26.2 279.3 170.7 488.5 474.0 1,375.0 1,745.4 488.7 300.4 11.9 14.0
2009 261.0 222.6 144.9 150.0 3.1 2.7 24.2 21.4 278.9 178.3 509.1 433.7 1,373.4 1,664.1 570.1 281.3 14.1 11.0
2008 315.3 244.0 158.8 171.7 4.3 3.3 29.6 24.9 282.9 193.3 608.9 480.6 1,725.7 1,687.8 839.6 327.8 14.9 13.2
2007 339.8 265.2 166.1 173.4 4.7 5.1 23.5 28.6 307.8 217.5 608.9 545.2 1,844.6 1,699.3 1,048.5 380.7 15.9 12.2
2006 347.3 275.0 170.8 174.4 5.4 3.0 27.5 32.0 300.8 245.8 611.4 563.3 1,904.3 1,576.2 1,052.9 494.0 14.6 19.4
2005 276.1 231.2 146.4 164.9 4.0 3.0 29.6 24.1 339.1 289.0 586.6 574.1 1,934.8 1,648.0 1,111.3 608.9 18.3 23.5
2004 271.0 234.5 128.8 146.6 4.8 3.0 29.1 30.3 365.9 275.1 570.1 568.7 1,964.2 1,900.1 1,012.2 579.7 14.9 9.2
2003 284.3 218.9 127.8 122.0 5.1 2.7 31.9 22.6 414.0 245.1 634.5 586.4 2,022.3 1,995.6 987.4 525.7 18.7 12.8

City-data.com crime index counts serious crimes and violent crime more heavily. It adjusts for the number of visitors and daily workers commuting into cities. (higher means more crime, U.S. average = 301.1)


Crime per year
Type City-data.com crime indexRobberiesMurdersRapesAssaultsBurglariesTheftAuto theftArson
Year San DiegoAnaheimSan DiegoAnaheimSan DiegoAnaheimSan DiegoAnaheimSan DiegoAnaheimSan DiegoAnaheimSan DiegoAnaheimSan DiegoAnaheimSan DiegoAnaheim
2019 208.3 219.2 1,346 396 50 8 561 141 3,258 575 3,543 1,123 18,426 5,904 5,172 1,231 122 44
2018 212.9 231.8 1,439 407 35 7 605 142 3,281 636 3,752 1,408 18,482 5,921 5,182 1,373 187 27
2017 207.4 243.4 1,410 480 35 10 559 115 3,217 648 3,817 1,351 17,294 6,393 5,135 1,552 158 45
2016 223.5 240.8 1,387 390 50 7 572 123 3,323 689 4,743 1,469 18,042 6,764 5,839 1,384 239 33
2015 227.4 263.4 1,378 439 37 18 566 129 3,601 685 5,129 1,476 18,933 6,893 5,096 1,669 174 28
2014 210.5 216.9 1,318 418 32 14 371 79 3,493 590 5,115 1,301 16,691 5,620 5,006 1,275 209 23
2013 235.0 241.2 1,456 437 39 11 316 82 3,492 600 6,355 1,412 19,230 6,518 6,143 1,681 178 35
2012 241.6 256.7 1,517 440 47 15 304 82 3,661 742 5,902 1,605 19,188 7,025 6,610 1,440 183 27
2011 229.7 240.3 1,456 446 38 15 293 105 3,317 715 5,840 1,410 17,610 5,964 6,259 1,119 153 26
2010 244.5 230.2 1,636 492 29 7 300 88 3,651 574 6,387 1,594 17,977 5,869 6,389 1,010 155 47
2009 261.0 222.6 1,905 504 41 9 318 72 3,667 599 6,693 1,457 18,057 5,591 7,496 945 186 37
2008 315.3 244.0 2,019 573 55 11 376 83 3,597 645 7,743 1,604 21,945 5,633 10,677 1,094 190 44
2007 339.8 265.2 2,095 581 59 17 296 96 3,882 729 7,679 1,827 23,264 5,695 13,224 1,276 200 41
2006 347.3 275.0 2,164 584 68 10 348 107 3,811 823 7,746 1,886 24,125 5,277 13,338 1,654 185 65
2005 276.1 231.2 1,862 554 51 10 376 81 4,314 971 7,462 1,929 24,613 5,537 14,138 2,046 233 79
2004 271.0 234.5 1,650 493 62 10 373 102 4,689 925 7,305 1,912 25,168 6,388 12,970 1,949 191 31
2003 284.3 218.9 1,626 410 65 9 406 76 5,269 824 8,076 1,971 25,739 6,708 12,567 1,767 238 43

City-data.com crime index counts serious crimes and violent crime more heavily. It adjusts for the number of visitors and daily workers commuting into cities. (higher means more crime, U.S. average = 301.1)

Sex Offenders

According to our data, there are 1,334 registered sex offenders living in San Diego and 371 registered sex offenders living in .
The ratio of residents to sex offenders in San Diego is 1,054 to 1; the ratio in Anaheim is 946 to 1.
The number of registered sex offenders compared to the number of residents in San Diego is near to than in Anaheim.

Cost of Living

Living in San Diego can be more expensive compared to Anaheim. The costs of housing, food, and general expenses are typically higher in San Diego, affecting overall affordability. Anaheim, though also having its share of costly areas, tends to be slightly more affordable overall, which could be a significant factor for those considering relocation.

Income Tax

California’s income tax is a progressive tax, meaning it has different tax rates for different income levels. Both San Diego and Anaheim fall under this state rule, with no additional city-level income taxes. The tax rates range from 1% to 13.3%, depending on the taxpayers’ income.

Property Tax

The cities of Anaheim and San Diego both have property taxes, which adhere to California’s state rules. The average property tax rate in San Diego is slightly lower than that of Anaheim. However, due to the typically higher home prices in San Diego, the amount paid can often be higher.

Sales Tax

Both Anaheim and San Diego have the same state sales tax rate of 7.25%. However, with additional local city taxes, the total sales tax of Anaheim is approximately 7.75%, and San Diego's is currently 7.75% as well. It's an important factor to consider as it directly impacts the overall cost of living in these cities.
Income
Type San Diego Anaheim
Estimated median household income $93,042 $81,747
Estimated per capita income $48,380 $32,827
Cost of living index (U.S. average is 100) 126.4 88.5

If you make $50,000 in Anaheim, you will have to make $71,412 in San Diego to maintain the same standard of living.

Geographical Conditions

San Diego has a coastal geography, with numerous beaches and hiking trails offering stunning views. Anaheim is more inland, with flat terrains and suburban settings, but it’s within a short drive to beaches and hiking opportunities. Both cities feature parks and public spaces.
Geographical information
Type San Diego Anaheim
Land area 324.3 sq. miles 48.9 sq. miles
Population density 4,259.7 people per sq. mile 7,068.3 people per sq. mile
Elevation 40 feet 160 feet
Relative area comparison
San Diego, CA Anaheim, CA
First ancestry reported - percentage
Ancestry San DiegoAnaheim
German 4.1% 1.6%
Irish 3.7% 1.1%
English 3.7% 1.3%
Italian 2.7% 0.9%
Polish 0.8% 0.4%
Norwegian 0.6% 0.3%
Swedish 0.6% 0.1%
Russian 0.6% 0.1%
Scottish 0.5% 0.2%
French 0.5% 0.1%
Portuguese 0.5% 0.1%
Ukrainian 0.4% 0.1%
Scotch-Irish 0.4% 0.1%
Dutch 0.3% 0.2%
Hungarian 0.2% 0.0%
Greek 0.2% 0.1%
Welsh 0.2% 0.1%
Population origin - absolute values
Ancestry San DiegoAnaheim
German 31,098 3,454
Irish 28,411 2,328
English 28,257 2,898
Italian 20,762 1,937
Polish 6,306 923
Russian 4,825 265
Swedish 4,750 265
Norwegian 4,195 670
French 4,053 318
Portuguese 3,750 202
Scottish 3,500 449
Scotch-Irish 3,212 196
Ukrainian 3,045 134
Dutch 2,478 513
Greek 1,789 218
Hungarian 1,643 104
Welsh 1,528 127
French Canadian 1,134 160
Danish 874 202
Lithuanian 787 154
Foreign born residents - absolute values
Type Count
Region San DiegoAnaheim
All 332,864 124,924
Africa 13,482 2,778
Asia 158,944 43,851
Europe 28,086 3,093
Latin America 124,428 70,408
North America 5,332 599
Oceania 2,592 442
Foreign born residents - percentage
Type Percentage
Region San DiegoAnaheim
All 24.1% 36.0%
Africa 1.0% 0.8%
Asia 11.5% 12.7%
Europe 2.0% 0.9%
Latin America 9.0% 20.3%
North America 0.4% 0.2%
Oceania 0.2% 0.1%

Education

Both cities feature reputable education systems. San Diego hosts several renowned universities and colleges like UC San Diego and San Diego State University. Anaheim is known for its strong public school system, and it's in close proximity to institutions like UC Irvine. Education in these cities is a significant factor for families considering relocation.
School enrollment
Type San Diego Anaheim
Nursery, preschool 17,408 (5.2%) 3,430 (3.8%)
Kindergarten 15,191 (4.5%) 3,822 (4.2%)
Grade 1 to 4 57,255 (17%) 17,579 (19.3%)
Grade 5 to 8 50,659 (15.1%) 16,042 (17.6%)
Grade 9 to 12 61,511 (18.3%) 19,089 (21%)
College undergrad 105,968 (31.5%) 24,842 (27.3%)
Graduate or professional 28,062 (8.4%) 6,199 (6.8%)
Students in private schools - absolute values
Type Count
Grade San DiegoAnaheim
Grades 1 to 8 (elementary and middle school) 12,248 2,111
Grades 9 to 12 (high school) 7,798 991
Undergraduate colleges 23,490 2,472
Students in private schools - percentage
Type Percentage
Grade San DiegoAnaheim
Grades 1 to 8 (elementary and middle school) 11.4% 6.3%
Grades 9 to 12 (high school) 12.7% 5.2%
Undergraduate colleges 22.2% 10.0%
Educational attainment
Type San Diego Anaheim
Less than high school 10.1% 22.6%
High school or equiv. 15.7% 21.6%
Less than 1 year of college 5.2% 7.2%
1 or more years of college 12.7% 11.5%
Associate degree 7.4% 7.7%
Bachelor's degree 28.5% 20.1%
Master's degree 13.1% 6.8%
Profess. school degree 3.4% 1.4%
Doctorate degree 3.8% 1.1%
Education level (25-year-olds and older)
Type San Diego Anaheim
Bachelor's degree or higher 48.8% 29.4%
Graduate or professional degree 20.3% 9.3%
High school or higher 89.9% 77.4%

Work and Economy

San Diego's economy is diverse with sectors like military defense, healthcare, biotech, and tourism playing key roles. Anaheim’s economy largely revolves around tourism, centered around Disneyland, along with a healthy manufacturing sector. Both cities have growing tech scenes and present various job opportunities depending their respective dominant industries.

Biggest Employers

In San Diego, the Navy, University of California San Diego, and Qualcomm represent some of the largest employers. For Anaheim, employers include Disneyland Resort, Anaheim Memorial Medical Center, and Kroger. These employers contribute significantly towards the city economies through regular job openings and robust operations.
Employment and residency - absolute values
Kind San DiegoAnaheim
Work and live in this city 450,898 41,005
Work and live in this county 704,831 139,799
Workers who work outside the city they live in 772,502 287,009
Workers who work outside the county they live in 9,400 24,260
Working at home 183,424 22,243
Not working at home 530,807 141,816
Daytime population change due to commuting 141,927 24,288
Employment and residency - percentage
Kind San DiegoAnaheim
Work and live in this city 77.7% 29.4%
Work and live in this county 98.7% 85.2%
Workers who work outside the city they live in 22.3% 70.6%
Workers who work outside the county they live in 1.3% 14.8%
Working at home 25.7% 13.6%
Not working at home 74.3% 86.4%
Daytime population change due to commuting 11.6% 7.4%
Geographical mobility: all
Type all
Mobility San DiegoAnaheim
Same house 1 year ago 83.2% 90.2%
Moved from abroad 0.9% 0.3%
Moved within same county 10.3% 6.4%
Moved from different state 3.1% 0.7%
Moved within same state 2.4% 2.4%
Geographical mobility: Asian
Type Asian
Mobility San DiegoAnaheim
Same house 1 year ago 84.1% 89.4%
Moved from abroad 1.1% 0.9%
Moved within same county 10.2% 5.2%
Moved from different state 2.2% 0.3%
Moved within same state 2.4% 4.2%
Geographical mobility: Black
Type Black
Mobility San DiegoAnaheim
Same house 1 year ago 84.6% 89.1%
Moved from abroad 0.7% 0.9%
Moved within same county 10.0% 4.3%
Moved from different state 3.3% 0.7%
Moved within same state 1.3% 5.6%
Geographical mobility: White
Type White
Mobility San DiegoAnaheim
Same house 1 year ago 80.8% 90.3%
Moved from abroad 1.1% 0.0%
Moved within same county 10.7% 6.1%
Moved from different state 4.1% 1.3%
Moved within same state 3.3% 2.3%
Building permits
Type Average valueCount
City San DiegoAnaheimSan DiegoAnaheim
1997 $183,500 $189,400 2,814 285
1998 $194,000 $181,200 2,819 421
1999 $199,900 $194,600 2,233 441
2000 $261,300 $247,900 2,014 114
2001 $254,400 $241,400 2,209 75
2002 $205,900 $218,200 2,588 151
2003 $190,500 $206,500 1,926 255
2004 $167,100 $209,900 1,301 86
2005 $175,800 $230,400 1,059 63
2006 $184,800 $187,400 815 81
2007 $196,200 $282,500 748 35
2008 $323,700 $344,400 641 27
2009 $289,000 $172,200 374 32
2010 $255,900 $210,500 557 59
2011 $349,000 $189,500 451 41
2012 $372,900 $242,100 535 125
2013 $366,800 $173,800 821 56
2014 $345,900 $201,600 712 51
2015 $329,400 $348,800 1,325 36
2016 $303,400 $272,700 823 129
2017 $341,000 $226,700 1,138 72
2018 $310,800 $214,800 774 121
2019 $351,600 $141,200 580 123
2020 $291,000 $108,000 445 86
2021 $305,000 $101,400 539 85

There were 539 building permits issued in San Diego in 2012 (88 more than in 2011) compared to 85 building permits issued in Anaheim in 2012 (44 more than in 2011).

In San Diego (San Diego County), 52.6% voted for Democrats and 45.0% for Republicans in 2012 Presidential Election. In Anaheim (Orange County), 45.8% voted for Democrats and 52.0% for Republicans.

Elections
Type DemocratsRepublicansOther
Year San DiegoAnaheimSan DiegoAnaheimSan DiegoAnaheim
2020 60.3% 53.6% 37.5% 44.6% 2.1% 1.8%
2016 56.3% 50.9% 36.6% 42.4% 7.1% 6.7%
2012 52.6% 45.8% 45.0% 52.0% 2.4% 2.3%
2008 54.2% 47.8% 44.0% 50.3% 1.8% 1.9%
2004 46.7% 39.3% 52.9% 60.2% 0.4% 0.5%
2000 45.8% 40.4% 49.8% 55.9% 4.5% 3.7%
1996 44.1% 37.9% 45.6% 51.7% 10.3% 10.5%
Breakdown of population affiliated with a religious congregation
Type AdherentsCongregations
Religion San DiegoAnaheimSan DiegoAnaheim
CATHOLIC CHURCH 25.9% 26.5% 6.7% 4.4%
SOUTHERN BAPTIST CONVENTION 1.1% 2.3% 12.0% 8.8%
MUSLIM ESTIMATE 0.7% 0.8% 1.1% 1.3%
SEVENTH DAY ADVENTIST CHURCH 0.5% 0.4% 2.0% 1.3%
EPISCOPAL CHURCH 0.4% 0.4% 2.0% 1.4%
EVANGELICAL LUTHERAN CHURCH IN AMERICA 0.4% 0.4% 2.0% 2.3%
LUTHERAN CHURCH 0.4% 0.6% 2.2% 2.0%
REFORMED CHURCH IN AMERICA 0.0% 0.3% 0.1% 0.2%

Weather

Both San Diego and Anaheim offer idyllic Southern California weather. Known for their almost constant sunshine and moderate temperatures, these cities are ideal for those who enjoy outdoor activities all year round. San Diego tends to have a cooler coastal climate with ocean breezes, while Anaheim is more inland and can experience higher summer temperatures.
Weather and climate
Type San Diego Anaheim
Temperature - Average 64.4°F 64.9°F
Humidity - Average morning or afternoon humidity 74% 69.6%
Humidity - Differences between morning and afternoon humidity 22% 25.9%
Humidity - Maximum monthly morning or afternoon humidity 80% 77.9%
Humidity - Minimum monthly morning or afternoon humidity 58% 52%
Precipitation - Yearly average 11 in 12 in
Snowfall - Yearly average 0 in 0 in
Clouds - Number of days clear of clouds 24.3% 26.6%
Sunshine amount - Average 74.8% 78.4%
Sunshine amount - Differences during a year 19% 22%
Sunshine amount - Maximum monthly 75% 84.9%
Sunshine amount - Minimum monthly 56% 63%
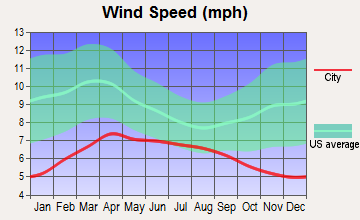
Wind speed - Average 6.9 mph 5.7 mph

Average climate in San Diego, California

Chicago, Illinois average temperatures Chicago, Illinois average precipitation Chicago, Illinois humidity Chicago, Illinois wind speed Chicago, Illinois snowfall Chicago, Illinois sunshine Chicago, Illinois clear and cloudy days
 

Average climate in Anaheim, California

Chicago, Illinois average temperatures Chicago, Illinois average precipitation Chicago, Illinois humidity Chicago, Illinois wind speed Chicago, Illinois snowfall Chicago, Illinois sunshine Chicago, Illinois clear and cloudy days
 

Air pollution
Type AQICONO2OZONEPBPM10PM25SO2
Year San DiegoAnaheimSan DiegoAnaheimSan DiegoAnaheimSan DiegoAnaheimSan DiegoAnaheimSan DiegoAnaheimSan DiegoAnaheimSan DiegoAnaheim
2018 101 139 0.53 0.36 11.2 13.7 32.6 26.8 0.007 0.007 N/A 27.5 10.5 12.1 0.1 0.7
2017 115 145 0.63 0.50 12.7 14.8 32.7 26.7 0.007 0.007 N/A 26.7 10.8 13.5 0.1 0.6
2016 105 132 0.46 0.57 13.0 14.5 30.4 26.3 0.006 0.007 N/A 24.1 11.4 12.9 0.1 0.3
2015 111 142 0.43 0.45 13.2 14.7 29.9 26.0 0.005 0.007 N/A 25.0 11.9 14.8 0.1 0.3
2014 105 138 0.44 0.40 11.6 15.0 31.1 26.7 0.007 0.008 N/A 26.7 11.1 16.2 0.1 0.5
2013 138 138 0.50 0.47 12.4 14.8 27.4 25.3 0.019 0.005 N/A 28.3 12.3 13.9 0.2 0.5
2012 110 142 0.53 0.46 12.7 14.5 28.0 25.0 0.019 0.005 N/A 27.0 13.6 14.7 0.2 0.2
2011 122 138 0.51 0.42 13.5 15.9 29.0 26.7 0.034 0.007 N/A 27.4 14.0 16.0 1.5 0.8
2010 109 130 0.52 0.44 14.0 16.7 29.3 25.8 0.019 0.009 N/A 23.5 13.9 14.9 1.0 0.6
2009 121 151 0.64 0.41 15.6 18.0 26.9 26.0 0.014 0.010 N/A 24.4 15.1 15.4 2.7 1.1
2008 127 156 0.71 0.38 16.1 20.3 28.4 26.7 N/A 0.010 67.3 30.2 N/A 18.9 2.6 1.1
2007 157 135 0.71 0.38 16.4 19.5 28.0 26.2 0.012 0.012 64.6 N/A N/A N/A 2.8 0.8
2006 123 128 0.81 0.43 18.9 19.1 27.1 26.3 0.056 0.008 64.8 N/A N/A N/A 3.4 1.3
2005 112 128 0.90 0.45 19.2 20.7 24.4 31.3 0.049 0.013 N/A N/A N/A N/A 3.7 1.3
2004 120 134 0.93 0.53 18.4 19.9 25.9 37.1 0.055 0.015 N/A N/A N/A N/A 4.6 1.6
2003 124 143 0.88 0.69 19.4 23.7 25.4 23.8 0.049 0.025 N/A N/A N/A N/A 3.8 1.1
2002 125 134 0.86 0.77 20.9 24.1 25.9 21.8 0.039 0.019 N/A N/A N/A N/A 3.6 2.1
2001 132 143 0.93 0.94 20.4 28.4 26.5 24.5 0.048 0.035 N/A N/A N/A N/A 3.4 1.7
2000 134 152 1.02 0.80 22.3 29.4 23.8 23.0 0.054 0.030 N/A N/A N/A N/A 3.6 1.9
Natural disasters
Type San Diego Anaheim
Tornado activity compared to U.S. average 6.7% 19.3%
Earthquake activity compared to U.S. average 5,835% 7,039.7%
Natural disasters compared to U.S. average 39% 32%

Transportation

For commuting and public transit, San Diego generally offers more options than Anaheim, with a comprehensive network of buses and trolleys. While Anaheim also has public transportation, it’s more often utilized by tourists traveling to and from Disneyland. Both cities are car-centric and are served by extensive freeway and highway systems.
Transport
Type San Diego Anaheim
Amtrak stations 1 1
Amtrak stations nearby 2 3
FAA registered aircraft 852 136
FAA registered aircraft manufacturers and dealers 33 3
Means of transportation to work
Type San Diego Anaheim
Bicycle 0.6% 1%
Bus 2% 0.9%
Carpooled 9.4% 10.8%
Car alone 81.7% 83.4%
Ferryboat 0.1% 0%
Motorcycle 0.3% 0.2%
Railroad 0.5% 0.2%
Subway 0.1% 0.3%
Walked 3.6% 1.6%
Means of transportation to work
Average travel time to work
Type San Diego Anaheim
Average 27.4 min 30.8 min
Other means 22.7 min 28.1 min
Public transportation 45.7 min 47.8 min
Travel time to work
Time leaving to work
Travel time to work
Time leaving to work
Private vehicle occupancy
Type San Diego Anaheim
Average 1.2 1.2
Drove alone 89.5% 85.3%
In 2 person carpool 7.6% 11.2%
In 3 person carpool 1.8% 1.8%
In 4 person carpool 0.4% 0.8%
In 5-6 person carpool 0.5% 0.9%
In 7+ person carpool 0.2% 0%

How many people usually rode to work in the car, truck or van.

Real Estate

Real estate in San Diego is typically more expensive than in Anaheim, with median home prices consistently higher in San Diego. Anaheim offers a range of housing options that might be more affordable for those considering relocation. San Diego’s higher home prices are sometimes balanced by higher salary averages in specific industries.

Neighborhoods

Each city boasts distinctive neighborhoods that offer diverse living experiences. San Diego presents neighborhood options like La Jolla, known for its upscale living, and hipster-friendly North Park. In Anaheim, the Platinum Triangle is popular with younger generations, while Anaheim Hills offers a more suburban feel for families.
Houses and residents
Type San Diego Anaheim
Houses 555,456 110,319
Average household size (people) 2.6 3.4
Median year apartment built 1980 1975
Median year house/condo built 1977 1970
Length of stay in the house since moving in 14.1 years 14.8 years
Houses occupied 521,000 (93.8%) 105,608 (95.7%)
Houses occupied by owners 251,507 (48.3%) 51,684 (48.9%)
Houses occupied by renters 269,493 (51.7%) 53,924 (51.1%)
Median rent asked for vacant for-rent units $2,096 $2,111
Median monthly housing costs $2,044 $1,910
Median price asked for vacant for-sale houses and condos $957,871 $1,256,069
Estimated median house or condo value $768,800 $688,400
Median numbers of rooms 4.6 4.7
Median number of rooms in apartments 3.7 3.6
Median number of rooms in houses and condos 5.9 6.1
Median house price - detached houses Over $1,000,000 $859,592
Median house price - in 2-unit structures Over $1,000,000 $742,035
Median house price - in 3-to-4-unit structures $529,375 $546,946
Median house price - in 5 or more unit structures $543,091 $553,561
Median house price - mobile homes $134,064 $114,904
Median house price - Townhouses or other attached units $696,014 $619,623
Median house price - All housing units $941,291 $782,600
Median house age 42 48
Renting percentage 51.7% 51.5%
Housing density (houses/condos per square mile) 1,712.6 2,254.1
House value disparities 23.6% 20.2%
Household income disparities 42.3% 43.6%
Median household income for houses/condes with a mortgage $138,584 $125,169
Median household income for apartments without a mortgage $97,588 $86,779
Housing units without a mortgage 2,803 (1.6%) 374 (1%)
Housing units with both a second mortgage and home equity loan 12,495 (6.9%) 2,222 (6%)
Housing units with a mortgage 177,643 (98.4%) 36,875 (99%)
Housing units with a home equity loan 694 (0.4%) 0 (0%)
Housing units with a second mortgage 16,654 (9.2%) 2,794 (7.5%)
House/condo owner moved in on average (years ago) 11 14
House/condo renter moved in on average (years ago) 1 4
Housing units lacking complete kitchen facilities 0.8% 4.5%
Housing units lacking complete plumbing facilities 0.3% 0.1%
Housing units in structures
Housing units in structures San DiegoAnaheim
One, detached 43.4% 42.7%
One, attached 9.9% 8.3%
Two 1.9% 2.3%
3 or 4 6.0% 7.6%
5 to 9 9.3% 6.8%
10 to 19 7.4% 5.5%
20 to 49 6.3% 6.8%
50 or more 14.6% 17.2%
Mobile homes 1.0% 2.6%
Boats, RVs, vans, etc. 0.0% 0.1%
Median real estate property taxes paid for housing units
Type San Diego Anaheim
With mortgages $5,987 (0.8%) $5,429 (0.8%)
With no mortgages $3,791 (0.5%) $2,922 (0.4%)
Marital status
Type San Diego Anaheim
Divorced 8.7% 7.5%
Never married 40.5% 37.7%
Now married 45.1% 47.6%
Separated 1.9% 2.1%
Widowed 3.9% 5.1%
Class of workers - percentage
Class of Workers San DiegoAnaheim
Employee of private company 66.4% 72.5%
Private not-for-profit wage and salary workers 9.8% 5.2%
Local government workers 6.4% 7.4%
Self-employed workers in own not incorporated business 5.8% 6.6%
State government workers 4.3% 3.0%
Self-employed in own incorporated business 3.9% 3.5%
Federal government workers 3.5% 1.8%
Unpaid family workers 0.1% 0.0%
Class of workers - absolute values
Class of Workers San DiegoAnaheim
Employee of private company 456,519 121,099
Federal government workers 23,728 2,956
Local government workers 43,803 12,291
Private not-for-profit wage and salary workers 67,149 8,645
Self-employed in own incorporated business 26,516 5,895
Self-employed workers in own not incorporated business 39,709 11,077
State government workers 29,438 5,046
Unpaid family workers 808 65

Industries and Occupations

San Diego has a diverse range of industries including biotech, tech, and healthcare. Many people work in occupations related to these industries. Anaheim is characterized by tourism, entertainment, and manufacturing, leading to occupations in these areas. Both cities offer a variety of job opportunities catering to different skill sets and interests.
Most common male industries
Industry San DiegoAnaheim
Professional, scientific, and technical services 17.2% 6.1%
Manufacturing 12.1% 13.0%
Retail trade 9.3% 8.8%
Construction 8.2% 13.6%
Health care and social assistance 7.7% 6.1%
Educational services 6.5% 4.1%
Accommodation and food services 6.3% 6.1%
Transportation and warehousing 5.5% 8.4%
Administrative and support and waste management services 4.5% 8.6%
Public administration 4.5% 2.6%
Finance and insurance 4.1% 4.0%
Other services, except public administration 3.2% 4.6%
Wholesale trade 2.5% 4.2%
Information 2.4% 2.6%
Arts, entertainment, and recreation 2.4% 3.7%
Real estate and rental and leasing 2.4% 2.4%
Utilities 0.8% 0.3%
Management of companies and enterprises 0.2% 0.0%
Agriculture, forestry, fishing and hunting 0.2% 0.8%
Mining, quarrying, and oil and gas extraction 0.0% 0.1%
Most common female industries
Industry San DiegoAnaheim
Health care and social assistance 20.4% 19.7%
Professional, scientific, and technical services 13.9% 6.5%
Educational services 12.5% 9.5%
Retail trade 9.9% 12.9%
Accommodation and food services 7.2% 9.1%
Manufacturing 6.4% 10.1%
Other services, except public administration 5.2% 6.5%
Finance and insurance 5.1% 5.0%
Public administration 4.9% 5.2%
Administrative and support and waste management services 3.6% 3.3%
Arts, entertainment, and recreation 2.1% 2.5%
Real estate and rental and leasing 2.0% 2.2%
Transportation and warehousing 1.9% 2.2%
Information 1.7% 0.8%
Wholesale trade 1.3% 2.1%
Construction 1.1% 1.6%
Utilities 0.4% 0.1%
Agriculture, forestry, fishing and hunting 0.3% 0.5%
Management of companies and enterprises 0.2% 0.0%
Mining, quarrying, and oil and gas extraction 0.0% 0.1%
Most common male occupations
Occupation San DiegoAnaheim
Management occupations 13.0% 9.4%
Computer and mathematical occupations 8.1% 2.7%
Sales and related occupations 7.9% 8.4%
Business and financial operations occupations 7.1% 4.9%
Architecture and engineering occupations 6.6% 4.6%
Office and administrative support occupations 6.2% 7.2%
Construction and extraction occupations 5.9% 10.2%
Food preparation and serving related occupations 4.9% 5.1%
Material moving occupations 4.3% 5.3%
Life, physical, and social science occupations 3.9% 1.6%
Educational instruction, and library occupations 3.9% 2.3%
Production occupations 3.9% 6.9%
Transportation occupations 3.5% 8.4%
Installation, maintenance, and repair occupations 3.5% 4.3%
Building and grounds cleaning and maintenance occupations 3.1% 6.7%
Arts, design, entertainment, sports, and media occupations 2.8% 2.2%
Health diagnosing and treating practitioners and other technical occupations 2.6% 1.3%
Firefighting and prevention, and other protective service workers including supervisors 1.9% 1.4%
Healthcare support occupations 1.5% 1.2%
Legal occupations 1.3% 0.3%
Most common female occupations
Occupation San DiegoAnaheim
Office and administrative support occupations 13.1% 19.8%
Management occupations 11.5% 6.9%
Sales and related occupations 9.9% 12.4%
Business and financial operations occupations 8.5% 6.9%
Educational instruction, and library occupations 8.3% 6.7%
Health diagnosing and treating practitioners and other technical occupations 7.3% 4.2%
Food preparation and serving related occupations 5.2% 6.0%
Healthcare support occupations 4.8% 6.8%
Personal care and service occupations 4.4% 5.6%
Life, physical, and social science occupations 3.5% 1.3%
Computer and mathematical occupations 3.3% 1.4%
Health technologists and technicians 3.2% 3.6%
Arts, design, entertainment, sports, and media occupations 2.5% 1.3%
Building and grounds cleaning and maintenance occupations 2.4% 4.2%
Production occupations 2.4% 5.4%
Legal occupations 2.2% 0.8%
Community and social service occupations 2.1% 2.2%
Architecture and engineering occupations 2.0% 0.9%
Material moving occupations 1.6% 2.0%
Food environment data per 10,000 residents
Food environment statistics San DiegoAnaheim
Number of convenience stores (no gas) 1.7 1.5
Number of convenience stores (with gas) 0.8 0.5
Number of full-service restaurants 7.6 8.2
Number of grocery stores 1.9 1.8
Food environment - absolute values
Food environment statistics San DiegoAnaheim
Number of convenience stores (no gas) 487 434
Number of convenience stores (with gas) 227 147
Number of full-service restaurants 2,238 2,438
Number of grocery stores 574 530
Number of supercenters and club stores 17 18
Obesity and diabetes
Food environment statistics rate San DiegoAnaheim
Adult diabetes rate 6.5% 6.3%
Adult obesity rate 22.2% 18.5%
Low-income preschool obesity rate 16.0% 16.4%

Health Care

Both cities provide robust health care systems. San Diego is renowned for its hospitals and biomedical research, featuring health institutions like UC San Diego Health and Scripps Health. Anaheim, too, has renowned healthcare facilities like the Anaheim Regional Medical Center. Both cities have ample clinics and health centers spread throughout the neighborhoods.
Health (county statistics)
Type San Diego Anaheim
General health status score of residents in this county from 1 (poor) to 5 (excellent) 3.6 3.6
Average weight of females (lbs) 153.7 lbs 150.7 lbs
Average weight of males (lbs) 189.9 lbs 187.6 lbs
Residents visited a dentist within the past year 73.5% 76%
Residents exercised in the past month 79% 79.4%
Adult residents drank alcohol in the past 30 days 82.1% 81.9%
Residents smoked 100+ cigarettes in their lives 41.3% 37.8%

Fatal vehicle accidents per 100,000 residents
Type Total count per 100,000Drunk per 100,000Fatal count per 100,000Pedestrian count per 100,000Person count per 100,000Vehicle count per 100,000
Year San DiegoAnaheimSan DiegoAnaheimSan DiegoAnaheimSan DiegoAnaheimSan DiegoAnaheimSan DiegoAnaheim
2021 8.0 7.2 0.0 0.0 8.6 7.8 4.6 2.9 14.3 16.2 11.9 11.3
2020 7.1 7.8 1.7 2.0 7.7 8.9 2.8 3.7 15.2 17.0 10.9 12.7
2019 6.0 5.1 0.8 2.0 6.3 5.1 3.5 1.7 11.1 13.6 8.4 9.6
2018 6.7 5.1 1.3 1.7 7.0 5.4 3.4 2.0 16.0 10.2 11.7 9.6
2017 5.0 8.8 1.1 1.1 5.4 9.6 2.3 3.1 9.6 20.7 8.0 16.4
2016 6.4 7.7 2.3 2.0 7.0 8.2 3.8 2.6 13.2 20.2 9.8 11.1
2015 6.6 5.4 2.1 1.1 7.0 5.4 2.6 1.7 13.0 13.1 9.4 10.6
2014 5.6 6.6 1.0 1.4 5.8 7.2 2.8 1.7 11.2 15.0 9.1 11.0
2013 6.0 4.9 1.7 1.2 6.1 5.8 2.7 3.2 13.4 8.7 10.5 7.2
2012 5.2 4.7 1.6 0.6 5.5 5.0 2.2 2.0 11.1 11.1 8.1 8.2
2011 4.8 4.7 1.3 1.5 4.9 5.3 2.3 2.3 9.0 10.8 7.2 8.5
2010 5.1 4.2 1.5 1.8 5.7 5.1 2.1 1.8 10.4 13.1 8.2 7.7
2009 5.7 7.4 2.1 2.1 5.9 7.7 2.1 4.1 14.9 17.2 9.1 11.2
2008 6.3 6.6 2.5 2.1 6.6 7.5 2.1 0.6 15.4 16.5 9.8 11.1
2007 6.6 9.1 3.1 3.3 7.3 9.4 2.4 2.4 17.3 29.2 9.7 16.4
2006 7.3 11.6 2.2 5.2 7.9 13.1 2.2 3.3 17.5 36.5 10.7 24.0
2005 8.0 9.4 3.5 3.6 8.8 10.6 1.9 4.3 23.2 25.5 13.9 16.7
2004 7.8 7.9 3.0 3.9 8.0 8.5 3.1 2.7 17.8 26.6 11.1 16.3
2003 7.7 7.9 3.5 2.4 8.1 9.1 3.3 3.0 19.5 29.3 11.2 14.5
2002 7.0 6.7 2.9 1.8 7.6 7.3 3.8 3.0 17.2 20.0 9.4 10.0
2001 6.4 5.1 2.2 1.5 6.6 5.8 2.3 2.4 18.4 16.0 9.1 10.6
2000 7.8 5.8 2.9 1.2 8.6 6.1 3.1 2.4 22.3 13.7 12.3 7.9
1999 9.3 5.7 3.3 2.0 9.7 5.7 3.6 2.7 27.5 13.6 13.3 8.3
1998 6.8 6.4 2.2 2.4 7.3 6.7 2.8 1.3 18.9 16.5 10.1 11.4
1997 6.3 8.9 1.8 2.7 6.9 9.2 2.6 3.1 19.3 26.3 9.9 15.0
1996 7.0 9.4 2.9 2.8 7.8 11.5 3.0 2.8 18.8 27.1 9.8 14.9
1995 8.2 6.7 2.3 1.8 9.1 7.7 3.6 3.2 23.1 22.5 11.9 11.2
1994 9.8 9.6 2.9 1.4 10.2 10.6 5.2 6.4 27.0 33.3 13.4 14.5
1993 10.8 11.8 3.5 5.0 11.2 11.8 4.2 6.1 29.2 31.5 16.3 16.5
1992 9.1 8.4 2.2 2.2 9.6 9.1 4.7 4.0 26.5 26.2 13.1 13.8
1991 11.9 8.9 3.2 5.9 12.6 10.7 7.3 3.0 37.0 28.8 16.6 14.0
1990 12.6 10.8 4.6 4.9 13.0 11.2 0.0 0.0 35.3 32.9 17.7 16.8
1989 16.2 11.8 6.1 5.7 17.0 12.2 0.0 0.0 43.8 39.4 22.0 18.3
1988 17.0 17.5 5.3 10.5 17.5 20.2 0.0 0.0 46.7 57.2 25.0 30.3
1987 16.0 16.2 6.0 4.8 16.9 17.0 0.0 0.0 43.6 48.3 23.0 28.9
1986 13.0 15.7 5.8 5.7 13.6 16.6 0.0 0.0 33.9 39.6 18.5 23.8
1985 14.7 16.9 6.3 9.1 15.1 18.1 0.0 0.0 36.1 48.6 20.1 27.6
1984 14.1 13.0 7.8 7.1 15.1 13.9 0.0 0.0 36.8 30.2 19.8 17.6
1983 12.7 12.4 6.1 9.8 13.0 13.3 0.0 0.0 30.0 31.3 18.0 19.7
1982 11.7 16.2 5.6 7.4 12.9 17.5 0.0 0.0 29.5 35.4 16.3 20.1
1981 15.0 16.1 8.7 7.1 16.2 17.0 0.0 0.0 38.7 37.0 23.0 21.4
1980 16.1 12.3 8.0 6.8 17.0 13.7 0.0 0.0 36.2 35.1 22.0 21.4
1979 17.0 18.2 8.2 7.9 18.1 21.0 0.0 0.0 38.0 41.6 23.3 28.5
1978 17.4 14.8 8.8 4.8 18.3 17.2 0.0 0.0 41.1 34.9 25.5 23.0
1977 15.1 18.2 8.4 8.8 17.5 19.6 0.0 0.0 37.7 40.3 21.5 26.0
1976 9.8 16.6 3.7 5.0 9.9 19.2 0.0 0.0 21.6 43.4 12.2 28.2
1975 10.0 17.1 3.8 5.2 10.2 19.7 0.0 0.0 22.1 44.6 12.5 29.0

Fatal vehicle accidents
Type Total countDrunkFatal countPedestrian countPerson countVehicle count
Year San DiegoAnaheimSan DiegoAnaheimSan DiegoAnaheimSan DiegoAnaheimSan DiegoAnaheimSan DiegoAnaheim
1975 79 33 30 10 80 38 0 0 174 86 98 56
1976 79 33 30 10 80 38 0 0 174 86 98 56
1977 124 37 69 18 144 40 0 0 310 82 177 53
1978 146 31 74 10 154 36 0 0 345 73 214 48
1979 146 39 70 17 155 45 0 0 326 89 200 61
1980 141 27 70 15 149 30 0 0 317 77 193 47
1981 135 36 78 16 146 38 0 0 348 83 207 48
1982 108 37 52 17 119 40 0 0 272 81 150 46
1983 120 29 58 23 123 31 0 0 284 73 170 46
1984 137 31 76 17 146 33 0 0 357 72 192 42
1985 146 41 63 22 150 44 0 0 358 118 200 67
1986 132 39 59 14 138 41 0 0 345 98 188 59
1987 166 41 62 12 176 43 0 0 453 122 239 73
1988 181 45 56 27 186 52 0 0 497 147 266 78
1989 176 31 66 15 185 32 0 0 476 103 239 48
1990 141 29 51 13 145 30 0 0 395 88 198 45
1991 134 24 36 16 142 29 82 8 418 78 187 38
1992 105 23 25 6 111 25 54 11 305 72 151 38
1993 124 33 40 14 129 33 48 17 337 88 188 46
1994 113 27 34 4 118 30 60 18 313 94 155 41
1995 96 19 27 5 106 22 42 9 269 64 139 32
1996 83 27 34 8 92 33 35 8 222 78 115 43
1997 75 26 22 8 82 27 31 9 231 77 118 44
1998 82 19 27 7 88 20 34 4 229 49 122 34
1999 115 17 41 6 120 17 45 8 341 41 165 25
2000 95 19 36 4 105 20 38 8 273 45 151 26
2001 79 17 27 5 82 19 29 8 227 53 113 35
2002 88 22 36 6 95 24 47 10 215 66 117 33
2003 97 26 44 8 102 30 42 10 246 97 142 48
2004 99 26 38 13 102 28 40 9 227 88 141 54
2005 103 31 45 12 113 35 25 14 298 84 178 55
2006 94 38 28 17 102 43 28 11 226 120 138 79
2007 85 30 40 11 95 31 31 8 225 96 126 54
2008 82 22 33 7 86 25 28 2 201 55 128 37
2009 74 25 28 7 77 26 27 14 195 58 119 38
2010 67 14 20 6 74 17 28 6 136 44 107 26
2011 63 16 17 5 65 18 30 8 120 37 96 29
2012 70 16 21 2 73 17 30 7 148 38 108 28
2013 82 17 23 4 83 20 36 11 182 30 143 25
2014 77 23 14 5 80 25 39 6 154 52 126 38
2015 91 19 29 4 97 19 36 6 181 46 131 37
2016 90 27 32 7 98 29 53 9 185 71 137 39
2017 71 31 16 4 76 34 32 11 135 73 113 58
2018 95 18 19 6 99 19 48 7 227 36 166 34
2019 85 18 11 7 89 18 49 6 158 48 119 34
2020 98 27 23 7 107 31 39 13 210 59 151 44
2021 110 25 0 0 119 27 63 10 198 56 164 39
Police full-time law enforcement employees
Year San DiegoAnaheim
2021 2,394 550
2020 2,424 556
2019 2,387 592
2018 2,332 597
2017 2,282 602
2016 2,522 562
2015 2,545 577
2014 2,520 550
2013 2,511 518
2012 2,481 506
2011 2,455 527
2010 2,516 548
2009 2,647 609
2008 2,775 606
2007 2,675 582
2006 2,701 579
2005 2,823 559
2004 2,765 586
2003 2,823 557
Police full-time law enforcement employees (per 1,000 residents)
Year San DiegoAnaheim
2021 1.7 1.5
2020 1.7 1.6
2019 1.7 1.7
2018 1.6 1.7
2017 1.6 1.7
2016 1.8 1.6
2015 1.8 1.7
2014 1.8 1.6
2013 1.9 1.5
2012 1.9 1.5
2011 1.9 1.5
2010 1.9 1.6
2009 2.0 1.8
2008 2.2 1.8
2007 2.1 1.7
2006 2.1 1.7
2005 2.2 1.7
2004 2.2 1.7
2003 2.2 1.7
Local government: full-time employees
Job San DiegoAnaheim
Airports 22 0
Financial administration 363 65
Firefighters 927 182
Fire - other 232 69
Judicial and legal 356 33
Local libraries 236 31
Other and unallocable 881 80
Other government administration 1,359 131
Parks and recreation 1,000 132
Police - other 521 146
Police protection - officers 1,841 361
Sewerage 576 20
Solid waste management 373 41
Streets and highways 389 70
Totals for government 10,062 1,738
Water supply 986 62
Local government: part-time employees
Job San DiegoAnaheim
Financial administration 5 9
Fire - other 70 17
Judicial and legal 23 0
Local libraries 415 111
Other and unallocable 31 33
Other government administration 59 37
Parks and recreation 659 700
Police - other 164 111
Police protection - officers 13 0
Sewerage 16 0
Solid waste management 2 27
Streets and highways 14 8
Totals for government 1,551 1,094
Water supply 80 2
Place of birth - Foreign born
Residents San DiegoAnaheim
All residents 24.1% 36.8%
American Indian / Alaska Native residents 24.9% 40.6%
Asian residents 58.4% 63.9%
Black or African American residents 13.4% 17.3%
Native Hawaiian / Pacific Islander residents 19.5% 31.8%
Other race residents 36.3% 44.0%
Two or more races residents 19.8% 32.7%
White residents 10.8% 15.8%
White alone, not Hispanic / Latino residents 9.6% 11.7%
Place of birth - Native, outside of US
Residents San DiegoAnaheim
All residents 2.4% 2.2%
American Indian / Alaska Native residents 1.5% 3.2%
Asian residents 2.7% 2.1%
Black or African American residents 3.4% 5.0%
Native Hawaiian / Pacific Islander residents 19.3% 19.1%
Other race residents 2.6% 1.4%
Two or more races residents 3.8% 2.4%
White residents 1.8% 1.1%
White alone, not Hispanic / Latino residents 1.4% 1.3%
Place of birth - Born in state of residence
Residents San DiegoAnaheim
All residents 47.5% 52.2%
American Indian / Alaska Native residents 53.4% 51.8%
Asian residents 31.2% 31.6%
Black or African American residents 47.0% 52.9%
Native Hawaiian / Pacific Islander residents 48.9% 44.3%
Other race residents 54.2% 52.0%
Two or more races residents 60.8% 59.6%
White residents 46.1% 64.9%
White alone, not Hispanic / Latino residents 44.1% 59.1%
Place of birth - Born in other state
Residents San DiegoAnaheim
All residents 26.0% 8.9%
American Indian / Alaska Native residents 20.2% 4.4%
Asian residents 7.7% 2.4%
Black or African American residents 36.2% 24.8%
Native Hawaiian / Pacific Islander residents 12.3% 4.8%
Other race residents 6.9% 2.5%
Two or more races residents 15.6% 5.3%
White residents 41.3% 18.2%
White alone, not Hispanic / Latino residents 44.8% 27.8%
English speakers (speaking English at home)
Type San Diego Anaheim
Born in the United States residents 91.8% 86.3%
Foreign born residents 14.1% 6.9%
Native, born elsewhere residents 59% 51.7%
Total residents 61.2% 40.6%
Mechanisms of homicide
Mechanism San DiegoAnaheim
Homicides from 2000 to 2006 813 569
Cut / Pierce 130 91
Firearm 478 348
Suffocation 41 23
Mechanisms of homicide per 1,000,000 residents
Mechanism San DiegoAnaheim
Homicides from 2000 to 2006 40.0 27.8
Cut / Pierce 6.4 4.4
Firearm 23.5 17.0
Suffocation 2.0 1.1
Mechanisms of suicide per 1,000,000 residents
Mechanism San DiegoAnaheim
Suicides from 2000 to 2006 103.8 79.3
Cut / Pierce 2.3 1.7
Drowning 2.1 1.2
Fall 6.3 3.2
Firearm 45.1 32.7
Poisoning 20.2 17.6
Suffocation 22.8 19.5

Infrastructure

Both cities have modern infrastructure, with San Diego offering a more expansive public transit system. Both cities are near major airports: San Diego International Airport and John Wayne Airport for Anaheim. The quality of roads, public utilities, and amenities is typically high in both cities.
Infrastructure
Type San Diego Anaheim
Hospitals 26 22
TV stations 13 6
Arenas or stadiums 4 2
Bank branches located here 255 46
Bank institutions located here 40 19
Main business address for public companies 92 7
Drinking water stations with no reported violations in the past 5 1
Drinking water stations with reported violations in the past 20 3

Schools

School facilities
Type San Diego Anaheim
Private elementary/middle schools 39 20
Private high schools 22 8
Public elementary/middle schools 221 53
Public high schools 71 13
Colleges/Universities 36 13
HMDA - Conventional home purchase loans - Applications denied
Year San DiegoAnaheim
1999 3,865 914
2000 2,257 679
2001 1,754 632
2002 2,118 735
2003 5,074 1,047
2004 7,646 1,456
2005 8,409 1,965
2006 7,551 1,999
2007 5,741 1,230
2008 2,876 599
2009 1,675 378

Culture and Food

In terms of culture and food, both cities have a lot to offer. San Diego has a strong Hispanic influence resulting in a wide variety of delicious Mexican cuisine. Anaheim, home to Disneyland, offers distinctive food experiences within the park along with multicultural cuisine city-wide. Both cities have a thriving craft beer scene.

Sports Teams

Sports fans have plenty to appreciate in both cities. San Diego hosts professional teams like the San Diego Padres (MLB) and the San Diego Gulls (AHL). Anaheim is home to the Anaheim Ducks (NHL) and the Los Angeles Angels (MLB). Both cities feature annual sporting events, attracting attendees and tourists alike.