### Overview
San Diego and Fresno are two diverse cities in California offering distinct living experiences based on a myriad of factors ranging from crime, weather to cost of living, among others. This comparison offers a comprehensive look into these factors from a lens of an individual seeking to relocate or a tourist just visiting. Both cities carry unique characteristics which appeal differently to different people.
Distance between
San Diego, CA and
Fresno, CA : 314.6 miles
San Diego's population is larger by 154%. Its population has grown by 158,211 people (12.9%) since 2000. The population of Fresno has grown by 116,858 people (27.3%) during that time.
San Diego has a lower crime rate than Fresno, contributing to a safer living or visiting environment. However, certain areas in both cities carry higher crime rates requiring caution. As a big city, San Diego experiences typical urban crime but its overall crime rate is considerably lower than that of Fresno. Relocating to or visiting San Diego therefore generally presents a safer environment.
City-data.com crime index counts serious crimes and violent crime more heavily. It adjusts for the number of visitors and daily workers commuting into cities. (higher means more crime, U.S. average = 301.1)
City-data.com crime index counts serious crimes and violent crime more heavily. It adjusts for the number of visitors and daily workers commuting into cities. (higher means more crime, U.S. average = 301.1)
Sex Offenders
According to our data, there are 1,334 registered sex offenders living in San Diego and 1,482 registered sex offenders living in . The ratio of residents to sex offenders in San Diego is 1,054 to 1; the ratio in Fresno is 352 to 1. The number of registered sex offenders compared to the number of residents is a lot smaller in San Diego than in Fresno.
Cost of Living
The cost of living in San Diego is significantly higher than in Fresno. Housing, in particular, is much more expensive, contributing to the higher overall cost of living. Relocating to San Diego might require a more robust financial plan compared to Fresno.
Income Tax
As for income tax, both cities are based in California and hence follow the same state laws. The state has a progressive income tax that increases with one's income level.
Property Tax
Property taxes are slightly higher in San Diego to reflect the higher property values. However, each individual property tax bill will depend on the specific assessed value of the property.
Sales Tax
Both cities have the same state sales tax as they are in the same state, California. However, San Diego has a higher total sales tax rate of 7.75% compared to Fresno's total sales tax rate of 7.975%.
Income
Type
San Diego
Fresno
Estimated median household income
$93,042
$61,250
Estimated per capita income
$48,380
$28,499
Cost of living index (U.S. average is 100)
126.4
96.3
If you make $50,000 in Fresno, you will have to make $65,628 in San Diego to maintain the same standard of living.
Geographical Conditions
San Diego is located on the Pacific coast and is known for its beaches and surfing culture. Fresno lies in the Central Valley, close to the Sierra Nevada mountains, offering picturesque landscapes and outdoor recreational activities.
Both cities offer good educational opportunities. San Diego hosts several renowned universities such as the University of California, San Diego and San Diego State University. Fresno, on the other hand, has Fresno State University, among other higher education institutions. Both cities have numerous public and private primary and secondary schools.
San Diego's economy is more diversified with a focus on healthcare, research, and technology while Fresno's economy largely depends on agriculture with the surrounding regions being incredibly fertile. Job availability and wages will thus depend much on one's sector of interest.
Biggest Employers
In San Diego, the largest employers are the U.S. Navy, University of California, and Qualcomm. Fresno’s major employers are Community Medical Centers, Saint Agnes Medical Center, and the City of Fresno.
There were 539 building permits issued in San Diego in 2012 (88 more than in 2011) compared to 1,911 building permits issued in Fresno in 2012 (1205 more than in 2011).
In San Diego (San Diego County), 52.6% voted for Democrats and 45.0% for Republicans in 2012 Presidential Election. In Fresno (Fresno County), 49.8% voted for Democrats and 48.0% for Republicans.
Elections
Type
Democrats
Republicans
Other
Year
San Diego
Fresno
San Diego
Fresno
San Diego
Fresno
2020
60.3%
53.0%
37.5%
45.2%
2.1%
1.8%
2016
56.3%
49.2%
36.6%
43.2%
7.1%
7.5%
2012
52.6%
49.8%
45.0%
48.0%
2.4%
2.2%
2008
54.2%
50.2%
44.0%
48.1%
1.8%
1.8%
2004
46.7%
42.0%
52.9%
57.8%
0.4%
0.3%
2000
45.8%
43.2%
49.8%
53.3%
4.5%
3.5%
1996
44.1%
45.3%
45.6%
47.4%
10.3%
7.3%
Breakdown of population affiliated with a religious congregation
Type
Adherents
Congregations
Religion
San Diego
Fresno
San Diego
Fresno
CATHOLIC CHURCH
25.9%
31.0%
6.7%
6.1%
SOUTHERN BAPTIST CONVENTION
1.1%
1.6%
12.0%
8.1%
MUSLIM ESTIMATE
0.7%
0.3%
1.1%
0.6%
SEVENTH DAY ADVENTIST CHURCH
0.5%
0.7%
2.0%
2.6%
EPISCOPAL CHURCH
0.4%
0.0%
2.0%
0.1%
EVANGELICAL LUTHERAN CHURCH IN AMERICA
0.4%
0.5%
2.0%
2.0%
LUTHERAN CHURCH
0.4%
0.1%
2.2%
0.7%
AMERICAN BAPTIST CHURCHES IN THE USA
0.1%
0.6%
1.5%
2.4%
Weather
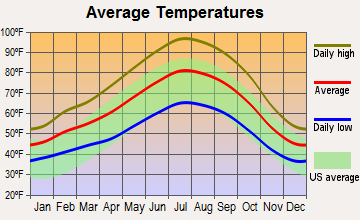
San Diego enjoys moderate, pleasant weather year-round, rarely experiencing temperatures below 50°F or above 85°F. On the other hand, Fresno experiences a more inland climate, with very hot summers and mild to cool winters. For individuals who gravitate towards warmer climates, Fresno can be attractive.
Weather and climate
Type
San Diego
Fresno
Temperature - Average
64.4°F
63°F
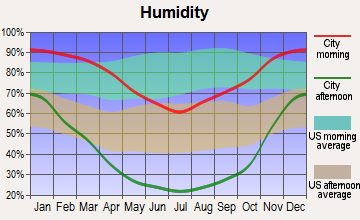
Humidity - Average morning or afternoon humidity
74%
60.9%
Humidity - Differences between morning and afternoon humidity
22%
67%
Humidity - Maximum monthly morning or afternoon humidity
80%
88%
Humidity - Minimum monthly morning or afternoon humidity
58%
21%
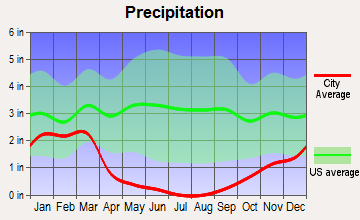
Precipitation - Yearly average
11 in
11.6 in
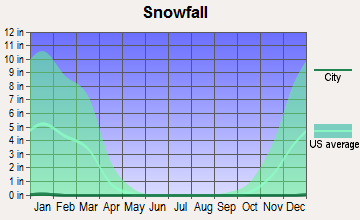
Snowfall - Yearly average
0 in
0 in
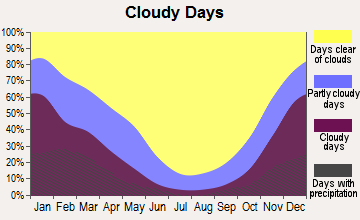
Clouds - Number of days clear of clouds
24.3%
32.4%
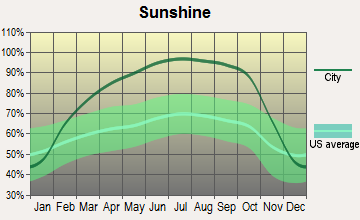
Sunshine amount - Average
74.8%
82.8%
Sunshine amount - Differences during a year
19%
52%
Sunshine amount - Maximum monthly
75%
96%
Sunshine amount - Minimum monthly
56%
44%
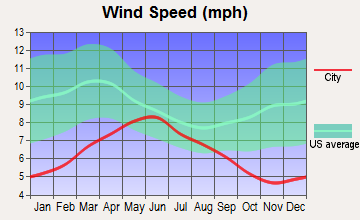
Wind speed - Average
6.9 mph
6.5 mph
Average climate in San Diego, California
Average climate in Fresno, California
Air pollution
Type
AQI
CO
NO2
OZONE
PB
PM10
PM25
SO2
Year
San Diego
Fresno
San Diego
Fresno
San Diego
Fresno
San Diego
Fresno
San Diego
Fresno
San Diego
Fresno
San Diego
Fresno
San Diego
Fresno
2018
101
128
0.53
0.35
11.2
9.7
32.6
31.7
0.007
N/A
N/A
39.7
10.5
14.8
0.1
0.6
2017
115
132
0.63
0.35
12.7
9.2
32.7
33.2
0.007
N/A
N/A
38.3
10.8
14.3
0.1
0.6
2016
105
128
0.46
0.35
13.0
8.4
30.4
31.4
0.006
N/A
N/A
34.7
11.4
13.5
0.1
0.5
2015
111
134
0.43
0.32
13.2
8.7
29.9
31.1
0.005
N/A
N/A
34.2
11.9
13.9
0.1
0.5
2014
105
139
0.44
0.33
11.6
10.1
31.1
32.4
0.007
0.004
N/A
39.3
11.1
16.4
0.1
0.5
2013
138
136
0.50
0.37
12.4
11.1
27.4
31.0
0.019
0.005
N/A
43.3
12.3
19.1
0.2
0.6
2012
110
140
0.53
0.36
12.7
9.7
28.0
31.9
0.019
0.004
N/A
36.1
13.6
14.2
0.2
0.6
2011
122
139
0.51
0.34
13.5
8.7
29.0
33.5
0.034
N/A
N/A
30.2
14.0
21.1
1.5
0.8
2010
109
121
0.52
0.27
14.0
6.9
29.3
31.1
0.019
N/A
N/A
N/A
13.9
N/A
1.0
0.7
2009
121
107
0.64
0.31
15.6
7.3
26.9
29.6
0.014
N/A
N/A
N/A
15.1
N/A
2.7
1.6
2008
127
130
0.71
0.33
16.1
9.3
28.4
31.1
N/A
N/A
67.3
N/A
N/A
22.2
2.6
1.0
2007
157
146
0.71
0.34
16.4
10.0
28.0
28.4
0.012
N/A
64.6
N/A
N/A
26.0
2.8
0.7
2006
123
104
0.81
0.36
18.9
11.3
27.1
29.7
0.056
0.006
64.8
N/A
N/A
N/A
3.4
N/A
2005
112
101
0.90
0.33
19.2
10.7
24.4
28.1
0.049
N/A
N/A
N/A
N/A
N/A
3.7
N/A
2004
120
103
0.93
0.34
18.4
11.5
25.9
30.8
0.055
N/A
N/A
N/A
N/A
N/A
4.6
N/A
2003
124
115
0.88
0.44
19.4
15.0
25.4
31.2
0.049
N/A
N/A
N/A
N/A
N/A
3.8
1.2
2002
125
139
0.86
0.43
20.9
15.2
25.9
44.8
0.039
N/A
N/A
N/A
N/A
N/A
3.6
N/A
2001
132
143
0.93
0.42
20.4
15.1
26.5
47.3
0.048
N/A
N/A
N/A
N/A
N/A
3.4
N/A
2000
134
136
1.02
0.51
22.3
15.4
23.8
41.0
0.054
N/A
N/A
N/A
N/A
N/A
3.6
N/A
Natural disasters
Type
San Diego
Fresno
Tornado activity compared to U.S. average
6.7%
9.9%
Earthquake activity compared to U.S. average
5,835%
8,613%
Natural disasters compared to U.S. average
39%
12%
Transportation
Compared to Fresno, San Diego has a more developed public transit system with bus, light-rail, and trolley services. Major freeways connect both of these cities but commuting can be more hectic in San Diego due to its size and population.
Transport
Type
San Diego
Fresno
Amtrak stations
1
1
Amtrak stations nearby
2
2
FAA registered aircraft
852
408
FAA registered aircraft manufacturers and dealers
33
36
Means of transportation to work
Type
San Diego
Fresno
Bicycle
0.6%
0.8%
Bus
2%
1.3%
Carpooled
9.4%
10.7%
Car alone
81.7%
84.4%
Ferryboat
0.1%
0%
Motorcycle
0.3%
0.2%
Railroad
0.5%
0%
Walked
3.6%
1.4%
Average travel time to work
Type
San Diego
Fresno
Average
27.4 min
23.7 min
Other means
22.7 min
21.5 min
Public transportation
45.7 min
45.3 min
Private vehicle occupancy
Type
San Diego
Fresno
Average
1.2
1.2
Drove alone
89.5%
88.3%
In 2 person carpool
7.6%
8.5%
In 3 person carpool
1.8%
1.8%
In 4 person carpool
0.4%
0.8%
In 5-6 person carpool
0.5%
0.5%
In 7+ person carpool
0.2%
0.1%
How many people usually rode to work in the car, truck or van.
Real Estate
San Diego's real estate is much more expensive than Fresno, especially near the coast. Fresno offers comparatively affordable housing options, making it more appealing to people with limited budgets.
Neighborhoods
Each city boasts of diverse neighborhoods offering a mix of urban and suburban lifestyles. San Diego tends to offer more upscale options with neighborhoods like La Jolla and Carmel Valley, whereas Fresno offers more affordable, suburban living with neighborhoods like Woodward Park.
Houses and residents
Type
San Diego
Fresno
Houses
555,456
188,756
Average household size (people)
2.6
3.1
Median year apartment built
1980
1977
Median year house/condo built
1977
1983
Length of stay in the house since moving in
14.1 years
12.6 years
Houses occupied
521,000 (93.8%)
181,841 (96.3%)
Houses occupied by owners
251,507 (48.3%)
91,233 (50.2%)
Houses occupied by renters
269,493 (51.7%)
90,608 (49.8%)
Median rent asked for vacant for-rent units
$2,096
$958.34
Median monthly housing costs
$2,044
$1,209
Median price asked for vacant for-sale houses and condos
$957,871
$285,919
Estimated median house or condo value
$768,800
$321,300
Median numbers of rooms
4.6
5
Median number of rooms in apartments
3.7
4
Median number of rooms in houses and condos
5.9
5.9
Median house price - detached houses
Over $1,000,000
$375,492
Median house price - in 2-unit structures
Over $1,000,000
$184,112
Median house price - in 3-to-4-unit structures
$529,375
$196,355
Median house price - in 5 or more unit structures
$543,091
$287,684
Median house price - mobile homes
$134,064
$100,122
Median house price - Townhouses or other attached units
$696,014
$260,277
Median house price - All housing units
$941,291
$358,028
Median house age
42
42
Renting percentage
51.7%
50.9%
Housing density (houses/condos per square mile)
1,712.6
1,808.6
House value disparities
23.6%
29.4%
Household income disparities
42.3%
46.4%
Median household income for houses/condes with a mortgage
$138,584
$97,354
Median household income for apartments without a mortgage
$97,588
$73,445
Housing units without a mortgage
2,803 (1.6%)
1,037 (1.7%)
Housing units with both a second mortgage and home equity loan
12,495 (6.9%)
2,880 (4.8%)
Housing units with a mortgage
177,643 (98.4%)
59,354 (98.3%)
Housing units with a home equity loan
694 (0.4%)
68 (0.1%)
Housing units with a second mortgage
16,654 (9.2%)
4,120 (6.8%)
House/condo owner moved in on average (years ago)
11
10
House/condo renter moved in on average (years ago)
1
3
Housing units lacking complete kitchen facilities
0.8%
1.5%
Housing units lacking complete plumbing facilities
0.3%
0.4%
Housing units in structures
Housing units in structures
San Diego
Fresno
One, detached
43.4%
59.0%
One, attached
9.9%
3.2%
Two
1.9%
3.0%
3 or 4
6.0%
7.8%
5 to 9
9.3%
9.6%
10 to 19
7.4%
3.6%
20 to 49
6.3%
3.4%
50 or more
14.6%
7.5%
Mobile homes
1.0%
2.6%
Boats, RVs, vans, etc.
0.0%
0.1%
Median real estate property taxes paid for housing units
Self-employed workers in own not incorporated business
39,709
14,428
State government workers
29,438
9,836
Unpaid family workers
808
890
Industries and Occupations
The dominant industries in San Diego are healthcare, defense, and tourism while Fresno is largely agrarian. Many occupations in Fresno revolve around farming and food production, whereas there are more opportunities for employment in various sectors in San Diego.
Both cities have state-of-the-art healthcare facilities. San Diego is home to renowned institutions such as UC San Diego Health, Scripps Health, and Rady Children's Hospital. Fresno offers high-quality care at Community Medical Centers and Saint Agnes Medical Center.
San Diego benefits from closer proximity to other major cities and has a more developed infrastructure, including public transit, highways, and an international airport. Fresno, while not as connected, does boast a quieter, less congested living experience that some might prefer.
Infrastructure
Type
San Diego
Fresno
Hospitals
26
32
TV stations
13
4
Arenas or stadiums
4
2
Bank branches located here
255
98
Bank institutions located here
40
25
Main business address for public companies
92
1
Drinking water stations with no reported violations in the past
5
5
Drinking water stations with reported violations in the past
HMDA - Conventional home purchase loans - Applications denied
Year
San Diego
Fresno
1999
3,865
717
2000
2,257
484
2001
1,754
462
2002
2,118
569
2003
5,074
1,510
2004
7,646
2,462
2005
8,409
3,394
2006
7,551
3,441
2007
5,741
2,138
2008
2,876
760
2009
1,675
354
Culture and Food
San Diego boasts a multicultural scene with a variety of food and entertainment options influenced by Mexican culture due to proximity to the border. Fresno, being an agricultural hub, offers fresh local produce and is famous for its raisins and wine.
Sports Teams
San Diego is home to major league sports teams like the San Diego Padres (MLB). Fresno, while not having any major league teams, has a strong local sports culture with the Fresno Grizzlies (Minor League Baseball) and Fresno FC (USL Championship soccer team).


 San Diego, CA
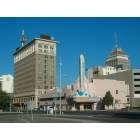
 Fresno, CA