Comparing San Francisco to Santa Rosa provides an interesting view of urban life versus a more suburban environment. Both cities offer unique qualities with respect to their crime/safety rates, weather conditions, cost of living, education systems, work and economy benefits, infrastructure, and more. San Francisco, known for its diverse culture and tech-driven economy, stands in contrast to Santa Rosa's laid-back lifestyle and focus on wine industries.
Distance between
San Francisco, CA and
Santa Rosa, CA : 49.8 miles
San Francisco's population is larger by 361%. Its population has grown by 38,468 people (5.0%) since 2000. The population of Santa Rosa has grown by 29,343 people (19.9%) during that time.
San Francisco has a higher crime rate than Santa Rosa, notably in property crime. Visitors and residents alike are advised to be vigilant, particularly in areas known for high crime. On the other hand, Santa Rosa, while not immune to crime, reports lower crime rates, contributing to a generally safer living environment.
City-data.com crime index counts serious crimes and violent crime more heavily. It adjusts for the number of visitors and daily workers commuting into cities. (higher means more crime, U.S. average = 301.1)
City-data.com crime index counts serious crimes and violent crime more heavily. It adjusts for the number of visitors and daily workers commuting into cities. (higher means more crime, U.S. average = 301.1)
Sex Offenders
According to our data, there are 829 registered sex offenders living in San Francisco and 307 registered sex offenders living in . The ratio of residents to sex offenders in San Francisco is 1,051 to 1; the ratio in Santa Rosa is 570 to 1. The number of registered sex offenders compared to the number of residents is a smaller in San Francisco than in Santa Rosa.
Cost of Living
San Francisco is one of the most expensive cities in the US with high housing, grocery, and transportation costs. Santa Rosa, while not cheap, is significantly more affordable, making it a more viable option for individuals or families considering relocation on a budget.
Income Tax
Both cities are subject to the same graduated state income tax, which ranges from 1% to 13.3% based on income level. Neither city imposes a separate city income tax.
Property Tax
Property tax rates in California are set at the county level. Both San Francisco County and Sonoma County (where Santa Rosa is located) have rates around 1% of assessed property value, though actual tax bills can vary due to differing local levies.
Sales Tax
As part of California, both cities have the same state sales tax rate of 7.25%. In San Francisco, the total sales tax rate is 8.5%, while in Santa Rosa, it's 9.25%, due to additional local taxes.
Income
Type
San Francisco
Santa Rosa
Estimated median household income
$121,826
$86,459
Estimated per capita income
$80,383
$43,653
Cost of living index (U.S. average is 100)
141.1
117.7
If you make $50,000 in Santa Rosa, you will have to make $59,941 in San Francisco to maintain the same standard of living.
Geographical Conditions
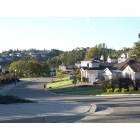
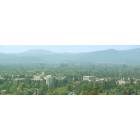
San Francisco is located on a peninsula, bordered on three sides by water, and features numerous hills and parks. Santa Rosa, the largest city in wine-country, features flat land and rolling hills, with numerous vineyards, parks, and outdoor recreational opportunities.
Both cities boast strong education systems. San Francisco houses various higher learning institutions, including the University of California, San Francisco. Santa Rosa, while smaller, takes pride in Santa Rosa Junior College, known for its strong vocational and liberal arts programs.
San Francisco is a hub for tech and finance, hosting headquarters of many global corporations. Santa Rosa has a more mixed economy, with healthcare, retail and wineries playing substantial roles.
Biggest Employers
San Francisco's biggest employers include the City and County of San Francisco, Salesforce, and Well Fargo. In Santa Rosa, major employers are Kaiser Permanente, Sutter Santa Rosa Regional Hospital, and the County of Sonoma.
There were 33 building permits issued in San Francisco in 2012 (2 more than in 2011) compared to 420 building permits issued in Santa Rosa in 2012 (235 more than in 2011).
In San Francisco (San Francisco County), 83.5% voted for Democrats and 13.0% for Republicans in 2012 Presidential Election. In Santa Rosa (Sonoma County), 71.0% voted for Democrats and 25.3% for Republicans.
Elections
Type
Democrats
Republicans
Other
Year
San Francisco
Santa Rosa
San Francisco
Santa Rosa
San Francisco
Santa Rosa
2020
85.3%
74.5%
12.7%
23.0%
2.0%
2.4%
2016
84.6%
68.9%
9.2%
22.1%
6.2%
9.0%
2012
83.5%
71.0%
13.0%
25.3%
3.4%
3.7%
2008
84.4%
73.7%
13.7%
24.1%
2.0%
2.2%
2004
83.0%
67.2%
15.2%
30.9%
1.8%
1.9%
2000
75.7%
59.7%
16.1%
32.3%
8.1%
8.0%
1996
72.2%
55.6%
15.7%
29.5%
12.1%
14.9%
Breakdown of population affiliated with a religious congregation
Type
Adherents
Congregations
Religion
San Francisco
Santa Rosa
San Francisco
Santa Rosa
CATHOLIC CHURCH
15.0%
22.3%
9.6%
7.3%
EPISCOPAL CHURCH
0.8%
0.4%
3.5%
2.5%
MUSLIM ESTIMATE
0.8%
0.5%
1.2%
0.6%
SOUTHERN BAPTIST CONVENTION
0.7%
1.0%
8.4%
6.0%
AMERICAN BAPTIST CHURCHES IN THE USA
0.6%
0.0%
2.5%
0.3%
EVANGELICAL LUTHERAN CHURCH IN AMERICA
0.2%
0.5%
1.7%
1.6%
LUTHERAN CHURCH
0.2%
0.5%
1.5%
2.5%
SEVENTH DAY ADVENTIST CHURCH
0.2%
0.5%
1.9%
3.2%
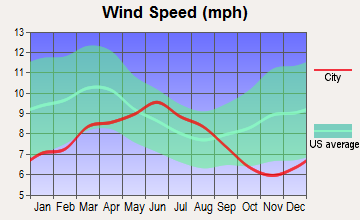
Weather
San Francisco is known for its mild, foggy climate, with temperatures rarely exceeding 80 degrees even at the peak of summer. In contrast, Santa Rosa experiences a greater range of temperatures, with hotter summers and occasionally colder winters, but still benefits from the overall agreeable California climate.
Weather and climate
Type
San Francisco
Santa Rosa
Temperature - Average
58.3°F
59°F
Humidity - Average morning or afternoon humidity
84.3%
76.8%
Humidity - Differences between morning and afternoon humidity
29%
37.8%
Humidity - Maximum monthly morning or afternoon humidity
91%
87.1%
Humidity - Minimum monthly morning or afternoon humidity
62%
49.3%
Precipitation - Yearly average
22.2 in
31.5 in
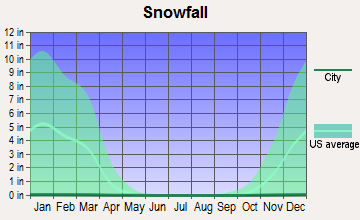
Snowfall - Yearly average
0 in
0 in
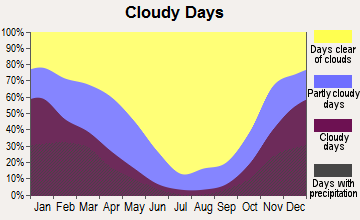
Clouds - Number of days clear of clouds
26.8%
29.6%
Sunshine amount - Average
73%
76.8%
Sunshine amount - Differences during a year
22%
29%
Sunshine amount - Maximum monthly
77%
81.1%
Sunshine amount - Minimum monthly
55%
52.1%
Wind speed - Average
11.4 mph
9.7 mph
Average climate in San Francisco, California
Average climate in Santa Rosa, California
Air pollution
Type
AQI
CO
NO2
OZONE
PB
PM10
PM25
SO2
Year
San Francisco
Santa Rosa
San Francisco
Santa Rosa
San Francisco
Santa Rosa
San Francisco
Santa Rosa
San Francisco
Santa Rosa
San Francisco
Santa Rosa
San Francisco
2018
104
76
0.35
0.37
11.3
4.5
23.4
20.3
0.012
N/A
16.9
N/A
11.9
8.6
0.4
N/A
2017
96
94
0.40
0.41
11.4
5.0
22.5
20.9
0.008
N/A
15.6
N/A
9.9
8.5
0.6
N/A
2016
68
63
0.39
0.36
10.6
4.6
22.4
20.0
0.005
N/A
13.2
N/A
7.9
5.2
0.8
N/A
2015
85
78
0.41
0.39
12.1
5.2
22.5
19.7
0.004
N/A
15.2
N/A
7.9
7.0
0.8
N/A
2014
85
70
0.38
0.35
12.1
4.9
21.8
20.1
0.005
N/A
13.4
N/A
7.7
8.2
0.6
N/A
2013
88
76
0.40
0.45
13.9
9.1
20.4
18.2
0.004
N/A
N/A
N/A
10.2
8.9
0.5
N/A
2012
75
66
0.40
0.42
12.8
8.5
22.7
18.2
0.003
N/A
N/A
N/A
8.2
8.4
1.1
N/A
2011
86
74
0.24
0.43
14.1
9.1
21.3
18.0
0.003
N/A
N/A
N/A
9.5
8.6
1.7
N/A
2010
84
79
0.21
0.34
13.4
8.2
22.0
18.5
0.004
N/A
N/A
N/A
10.6
7.2
1.0
N/A
2009
95
75
0.30
0.36
15.1
9.2
20.4
19.2
0.005
N/A
N/A
N/A
12.8
9.1
1.1
N/A
2008
94
91
0.43
0.33
15.6
10.5
21.7
21.0
0.007
N/A
N/A
N/A
11.7
13.6
0.9
N/A
2007
84
81
0.45
0.36
15.6
10.6
20.5
19.2
0.007
N/A
N/A
N/A
8.9
13.3
1.2
N/A
2006
86
54
0.52
0.41
16.1
11.4
21.5
19.6
N/A
N/A
N/A
N/A
8.7
N/A
1.6
N/A
2005
89
47
0.39
0.42
14.8
11.2
20.5
18.5
N/A
N/A
N/A
N/A
8.8
N/A
1.3
N/A
2004
93
51
0.44
0.40
16.1
10.9
20.9
17.2
0.004
N/A
N/A
N/A
11.2
N/A
2.5
N/A
2003
65
61
0.64
0.46
18.4
12.4
19.7
18.5
N/A
N/A
N/A
N/A
N/A
N/A
1.7
N/A
2002
62
58
0.69
0.52
18.6
13.1
19.6
19.3
0.008
N/A
N/A
N/A
N/A
N/A
1.4
N/A
2001
64
54
0.72
0.55
19.2
13.3
19.0
19.4
0.008
N/A
N/A
N/A
N/A
N/A
1.4
N/A
2000
60
47
0.71
0.64
20.3
13.0
17.1
17.3
0.017
N/A
N/A
N/A
N/A
N/A
2.0
N/A
Natural disasters
Type
San Francisco
Santa Rosa
Tornado activity compared to U.S. average
7.7%
7.3%
Earthquake activity compared to U.S. average
7,468.1%
7,493%
Natural disasters compared to U.S. average
6%
23%
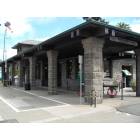
Transportation
San Francisco's public transit system, including BART, MUNI and various ferries, is comprehensive but crowded. Santa Rosa offers the Santa Rosa CityBus system, and being less populated, commuting is often less stressful.
Transport
Type
San Francisco
Santa Rosa
Amtrak stations
4
1
Amtrak stations nearby
3
3
FAA registered aircraft
453
298
FAA registered aircraft manufacturers and dealers
9
10
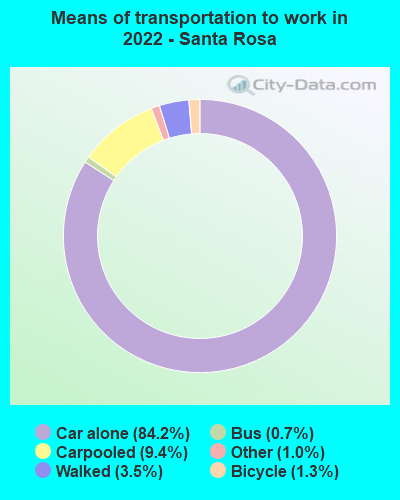
Means of transportation to work
Type
San Francisco
Santa Rosa
Bicycle
2.7%
1.6%
Bus
11.4%
0.9%
Carpooled
9.1%
9.7%
Car alone
53.9%
82.2%
Ferryboat
0.4%
0%
Motorcycle
0.9%
0.2%
Railroad
0.7%
0.1%
Streetcar
7.9%
0%
Subway
1.6%
0.1%
Taxicab
0.4%
0.1%
Walked
8.3%
3.6%
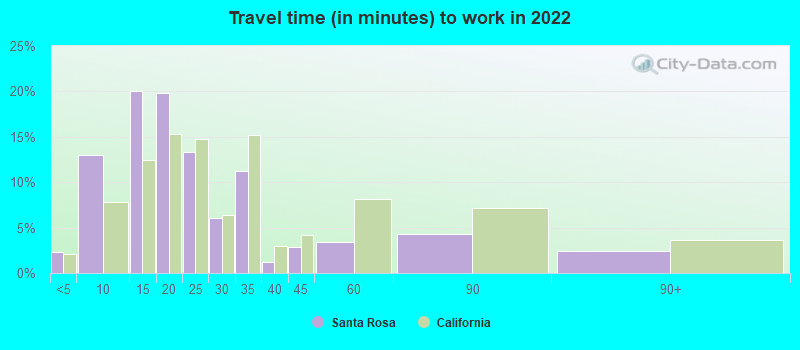
Average travel time to work
Type
San Francisco
Santa Rosa
Average
38 min
25.2 min
Other means
28.3 min
23.5 min
Public transportation
39.7 min
51.5 min
Private vehicle occupancy
Type
San Francisco
Santa Rosa
Average
1.2
1.2
Drove alone
85.5%
87.8%
In 2 person carpool
10.1%
8.3%
In 3 person carpool
3.2%
2.9%
In 4 person carpool
0.9%
0.7%
In 5-6 person carpool
0.2%
0.2%
In 7+ person carpool
0.1%
0.1%
How many people usually rode to work in the car, truck or van.
Real Estate
Real estate in San Francisco is notoriously expensive, with high demand and low supply driving prices up. Santa Rosa's real estate market, while still expensive compared to national averages, is more accessible.
Neighborhoods
San Francisco neighborhoods are diverse and each offers a unique character, from the bustle of the Financial District to the quiet charm of Nob Hill. Santa Rosa is more homogeneously suburban in nature, although it does offer a diverse mix of upscale and more affordable neighborhoods.
Houses and residents
Type
San Francisco
Santa Rosa
Houses
412,269
71,553
Average household size (people)
2.3
2.6
Median year apartment built
1953
1981
Median year house/condo built
1942
1980
Length of stay in the house since moving in
16.3 years
13.7 years
Houses occupied
350,796 (85.1%)
68,686 (96%)
Houses occupied by owners
140,809 (40.1%)
37,315 (54.3%)
Houses occupied by renters
209,987 (59.9%)
31,371 (45.7%)
Median rent asked for vacant for-rent units
$3,809
$3,255
Median monthly housing costs
$2,337
$1,973
Median price asked for vacant for-sale houses and condos
$1,670,841
$446,783
Estimated median house or condo value
Over $1,000,000
$638,500
Median numbers of rooms
3.9
5
Median number of rooms in apartments
3.2
4
Median number of rooms in houses and condos
5.6
5.8
Median house price - detached houses
Over $1,000,000
$738,188
Median house price - in 2-unit structures
Over $1,000,000
$728,261
Median house price - in 3-to-4-unit structures
Over $1,000,000
$428,231
Median house price - in 5 or more unit structures
Over $1,000,000
$565,629
Median house price - mobile homes
$517,939
$169,855
Median house price - Townhouses or other attached units
Over $1,000,000
$585,764
Median house price - All housing units
Over $1,000,000
$680,692
Median house age
76
41
Renting percentage
64.2%
45.9%
Housing density (houses/condos per square mile)
8,829.1
1,783.2
House value disparities
18.7%
22.8%
Household income disparities
41.7%
41.9%
Median household income for houses/condes with a mortgage
$210,544
$125,914
Median household income for apartments without a mortgage
$99,969
$83,816
Housing units without a mortgage
1,778 (1.9%)
348 (1.3%)
Housing units with both a second mortgage and home equity loan
7,687 (8.3%)
1,954 (7.4%)
Housing units with a mortgage
91,236 (98.1%)
25,990 (98.7%)
Housing units with a home equity loan
471 (0.5%)
83 (0.3%)
Housing units with a second mortgage
9,395 (10.1%)
2,882 (10.9%)
House/condo owner moved in on average (years ago)
14
11
House/condo renter moved in on average (years ago)
4
3
Housing units lacking complete kitchen facilities
4.7%
2.5%
Housing units lacking complete plumbing facilities
2.7%
0.9%
Housing units in structures
Housing units in structures
San Francisco
Santa Rosa
One, detached
19.1%
58.2%
One, attached
12.1%
11.6%
Two
9.0%
2.8%
3 or 4
11.4%
4.4%
5 to 9
9.0%
4.4%
10 to 19
9.3%
4.5%
20 to 49
11.3%
3.3%
50 or more
18.7%
7.1%
Mobile homes
0.1%
3.4%
Boats, RVs, vans, etc.
0.0%
0.4%
Median real estate property taxes paid for housing units
Self-employed workers in own not incorporated business
30,288
7,129
State government workers
22,691
2,157
Unpaid family workers
399
676
Industries and Occupations
In San Francisco, Information Technology, Healthcare, and Finance dominate, while in Santa Rosa, the Wine, Health Care, and Retail industries are major employers.
San Francisco has robust infrastructure supporting its large population, with numerous public transportation options and networks of roads and highways. Santa Rosa's infrastructure is smaller and less dense, reflecting its smaller population and more spread-out geography.
Infrastructure
Type
San Francisco
Santa Rosa
Hospitals
16
15
TV stations
18
4
Bank branches located here
281
58
Bank institutions located here
52
20
Main business address for public companies
68
2
Drinking water stations with no reported violations in the past
5
20
Drinking water stations with reported violations in the past
HMDA - Conventional home purchase loans - Applications denied
Year
San Francisco
Santa Rosa
1999
1,402
474
2000
1,000
312
2001
733
229
2002
870
250
2003
1,576
478
2004
2,147
691
2005
2,344
885
2006
2,511
735
2007
2,117
472
2008
1,575
252
2009
952
165
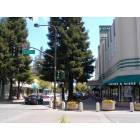
Culture and Food
San Francisco is globally famed for its diverse food scene and rich cultural life, including myriad festivals, events, and museums. Santa Rosa still offers a rich culture, with a focus on local art, wine, and farm-to-table dining.
Sports Teams
San Francisco is home to several professional sports teams, such as the San Francisco 49ers and Giants. Santa Rosa does not have any professional teams but offers sports venues for local amateur and school-league competitions.


 San Francisco, CA
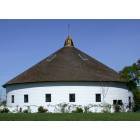
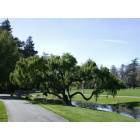
 Santa Rosa, CA