San Jose, the heart of Silicon Valley, and Oxnard, a city known for its pleasant coastal vibe, offer unique living experiences. Factors such as safety, cost of living, work, and geographical conditions vary greatly between these two Californian cities. Here's a comprehensive comparison to provide insight into both city's pros and cons, whether you're considering relocating or simply planning a visit.
Distance between
San Jose, CA and
Oxnard, CA : 262.7 miles
San Jose's population is larger by 387%. Its population has grown by 88,546 people (9.9%) since 2000. The population of Oxnard has grown by 31,521 people (18.5%) during that time.
San Jose typically reports higher crime rates than Oxnard, influenced by its larger city status and vast population. Following the general rule of 'the bigger the city, the more crime', San Jose requires a heightened awareness around personal safety. In contrast, Oxnard, while not crime-free, generally experiences a lower crime rate, making it a safer city overall.
City-data.com crime index counts serious crimes and violent crime more heavily. It adjusts for the number of visitors and daily workers commuting into cities. (higher means more crime, U.S. average = 301.1)
City-data.com crime index counts serious crimes and violent crime more heavily. It adjusts for the number of visitors and daily workers commuting into cities. (higher means more crime, U.S. average = 301.1)
Sex Offenders
According to our data, there are 1,806 registered sex offenders living in San Jose and 241 registered sex offenders living in . The ratio of residents to sex offenders in San Jose is 568 to 1; the ratio in Oxnard is 863 to 1. The number of registered sex offenders compared to the number of residents is larger in San Jose than in Oxnard.
Cost of Living
The cost of living in San Jose is significantly higher than in Oxnard. Everything from housing to groceries tends to be more expensive in this tech hub. Oxnard, while not cheap compared to the national average, provides a more affordable option than San Jose.
Income Tax
Both cities, being in California, follow the state's progressive income tax system. The rate ranges from 1% on the first $8,932 of taxable income to 13.3% on income over $1 million.
Property Tax
Property taxes are similar in both cities as they follow the California state average of 0.793%.
Sales Tax
Sales tax in San Jose is 9.25%, a touch higher than Oxnard's rate of 7.75%. This difference might not be significant for tourists but can add up for residents, particularly those making larger purchases.
Income
Type
San Jose
Oxnard
Estimated median household income
$126,377
$88,268
Estimated per capita income
$57,357
$27,431
Cost of living index (U.S. average is 100)
127.4
92.9
If you make $50,000 in Oxnard, you will have to make $68,568 in San Jose to maintain the same standard of living.
Geographical Conditions
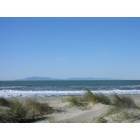
San Jose sits in the Santa Clara Valley, surrounded by rolling hills and close to the Pacific Ocean and San Francisco Bay, offering diverse outdoor activities. Oxnard is a coastal city, with beautiful beaches and access to the Channel Islands, making it a great place for water sports and beach activities.
San Jose, home to high-ranking universities like San Jose State University, offers robust opportunities in education. Moreover, its close proximity to Stanford University and other renowned institutions furthers its educational prowess. Oxnard's education system, on the other hand, is more average, with access to several community colleges and universities within driving distance.
San Jose sits at the center of the tech universe, with a thriving economy supported by tech giants like Apple, Google, and Adobe. The job market and salaries here outpace those in Oxnard. In contrast, Oxnard's economy relies heavily on agriculture, manufacturing, and defense, providing a different array of job opportunities.
Biggest Employers
In San Jose, tech giants like Apple, Google, and Adobe are among the biggest employers. Whereas in Oxnard, the largest employers include St. John's Regional Medical Center, Oxnard Union High School District, and the Navy.
There were 299 building permits issued in San Jose in 2012 (216 more than in 2011) compared to 52 building permits issued in Oxnard in 2012 (4 less than in 2011).
In San Jose (Santa Clara County), 70.0% voted for Democrats and 27.1% for Republicans in 2012 Presidential Election. In Oxnard (Ventura County), 52.2% voted for Democrats and 45.2% for Republicans.
Elections
Type
Democrats
Republicans
Other
Year
San Jose
Oxnard
San Jose
Oxnard
San Jose
Oxnard
2020
72.7%
59.6%
25.2%
38.5%
2.1%
1.9%
2016
72.7%
54.6%
20.6%
37.2%
6.7%
8.2%
2012
70.0%
52.2%
27.1%
45.2%
2.9%
2.7%
2008
69.6%
55.2%
28.6%
42.9%
1.8%
1.9%
2004
64.3%
47.8%
34.8%
51.5%
0.9%
0.8%
2000
60.7%
47.2%
34.4%
48.3%
4.9%
4.5%
1996
56.9%
44.1%
32.2%
43.5%
11.0%
12.4%
Breakdown of population affiliated with a religious congregation
Type
Adherents
Congregations
Religion
San Jose
Oxnard
San Jose
Oxnard
CATHOLIC CHURCH
25.1%
28.2%
6.0%
4.1%
MUSLIM ESTIMATE
1.1%
0.4%
1.8%
0.6%
SOUTHERN BAPTIST CONVENTION
0.9%
0.6%
7.7%
5.0%
EPISCOPAL CHURCH
0.5%
0.3%
2.3%
1.9%
SEVENTH DAY ADVENTIST CHURCH
0.4%
0.4%
2.6%
2.1%
EVANGELICAL LUTHERAN CHURCH IN AMERICA
0.3%
0.9%
2.3%
2.3%
LUTHERAN CHURCH
0.2%
0.5%
1.4%
2.5%
Weather
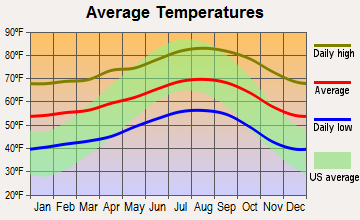
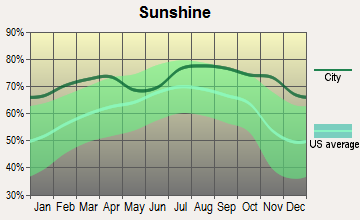
Both cities enjoy classic Californian weather. San Jose experiences a Mediterranean climate with warm, dry summers and wet winters. The city is often sunny, with an average of 300 sun-filled days per year. Oxnard also boasts a Mediterranean climate, albeit with more temperate year-round conditions, given its coastal location.
Weather and climate
Type
San Jose
Oxnard
Temperature - Average
60.9°F
61.5°F
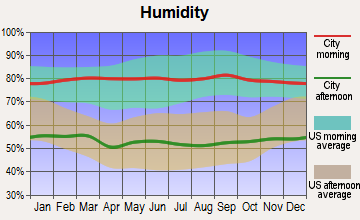
Humidity - Average morning or afternoon humidity
77.3%
70.9%
Humidity - Differences between morning and afternoon humidity
35.5%
23.2%
Humidity - Maximum monthly morning or afternoon humidity
87%
78.4%
Humidity - Minimum monthly morning or afternoon humidity
51.6%
55.2%
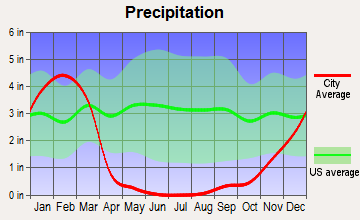
Precipitation - Yearly average
16.1 in
17.5 in
Snowfall - Yearly average
0 in
0 in
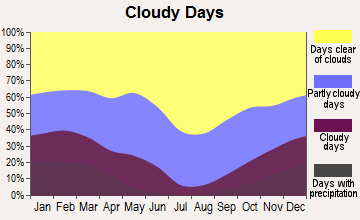
Clouds - Number of days clear of clouds
27.4%
27.2%
Sunshine amount - Average
73.8%
78.4%
Sunshine amount - Differences during a year
23%
21.9%
Sunshine amount - Maximum monthly
77.4%
84.9%
Sunshine amount - Minimum monthly
54.4%
63%
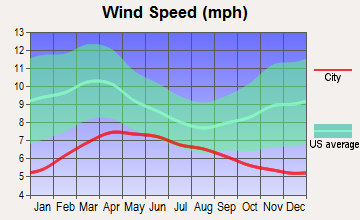
Wind speed - Average
10.3 mph
4.9 mph
Average climate in San Jose, California
Average climate in Oxnard, California
Air pollution
Type
AQI
CO
NO2
OZONE
PB
PM10
PM25
SO2
Year
San Jose
Oxnard
San Jose
Oxnard
San Jose
Oxnard
San Jose
Oxnard
San Jose
Oxnard
San Jose
Oxnard
San Jose
2018
94
87
0.49
N/A
14.5
5.3
22.2
27.8
0.006
N/A
27.1
N/A
12.5
8.6
0.2
N/A
2017
91
125
0.50
N/A
14.6
5.2
23.5
29.4
0.004
N/A
29.3
N/A
10.2
9.7
0.2
N/A
2016
69
78
0.47
N/A
13.7
5.2
22.4
27.7
0.003
N/A
24.5
N/A
8.8
8.4
0.2
N/A
2015
84
82
0.52
N/A
15.4
5.9
22.3
27.5
0.004
N/A
25.6
N/A
9.2
9.4
0.3
N/A
2014
83
86
0.40
N/A
13.9
6.0
21.5
27.1
0.004
N/A
27.3
N/A
8.2
9.3
0.2
N/A
2013
90
90
0.41
N/A
15.2
6.4
20.8
27.4
0.005
N/A
27.0
N/A
12.4
9.5
0.3
N/A
2012
74
95
0.35
N/A
13.3
7.0
21.8
27.1
0.003
N/A
N/A
N/A
10.1
8.7
0.3
N/A
2011
83
79
0.37
N/A
14.8
7.0
20.6
28.7
0.003
N/A
N/A
N/A
12.3
N/A
0.3
N/A
2010
88
74
0.35
N/A
14.4
6.9
20.4
28.4
0.004
N/A
N/A
N/A
9.0
N/A
0.4
N/A
2009
89
84
0.40
N/A
14.7
7.8
18.2
27.6
0.004
N/A
N/A
N/A
9.3
N/A
0.3
N/A
2008
100
86
0.45
N/A
16.7
8.1
20.6
28.0
N/A
N/A
N/A
N/A
12.6
N/A
N/A
N/A
2007
92
90
0.44
N/A
16.6
9.6
20.0
26.7
0.009
N/A
N/A
N/A
11.1
N/A
N/A
N/A
2006
100
88
0.46
N/A
18.0
9.6
21.8
26.2
N/A
N/A
N/A
N/A
11.1
N/A
N/A
N/A
2005
95
92
0.68
N/A
18.6
10.4
20.0
26.1
N/A
N/A
N/A
N/A
11.6
N/A
N/A
N/A
2004
98
100
0.63
N/A
18.5
10.3
20.4
26.5
N/A
N/A
N/A
N/A
9.9
N/A
N/A
N/A
2003
87
108
0.73
0.43
20.6
10.5
19.1
26.6
N/A
N/A
N/A
N/A
N/A
N/A
N/A
N/A
2002
78
109
0.65
0.26
19.5
9.6
18.0
27.2
0.006
N/A
N/A
N/A
N/A
N/A
N/A
N/A
2001
75
114
0.61
0.23
18.5
10.9
16.8
26.6
0.008
N/A
N/A
N/A
N/A
N/A
N/A
N/A
2000
65
105
0.66
0.27
18.9
12.5
15.6
23.9
0.009
N/A
N/A
N/A
N/A
N/A
N/A
N/A
Natural disasters
Type
San Jose
Oxnard
Tornado activity compared to U.S. average
9%
7.2%
Earthquake activity compared to U.S. average
7,785.3%
6,722.6%
Natural disasters compared to U.S. average
19%
36%
Transportation
San Jose has a well-developed public transportation system with widespread VTA transportation, including buses and light rail. The city is also served by Caltrain, facilitating commutes to neighboring cities. Slide into Oxnard, and you'll find bus services run by Gold Coast Transit, while rail services are provided by Metrolink and Amtrak for commutes to Los Angeles and Ventura County.
Transport
Type
San Jose
Oxnard
Amtrak stations
1
1
Amtrak stations nearby
3
3
FAA registered aircraft
553
100
FAA registered aircraft manufacturers and dealers
13
7
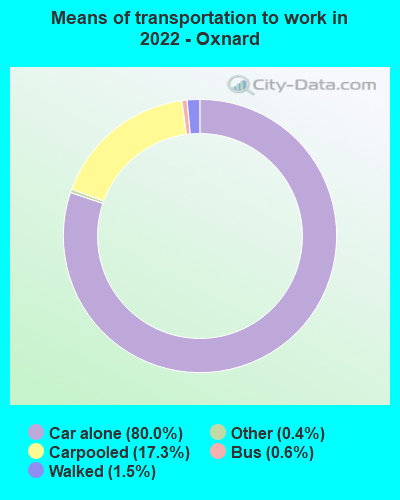
Means of transportation to work
Type
San Jose
Oxnard
Bicycle
1%
0.3%
Bus
1.1%
0.6%
Carpooled
11.4%
12.9%
Car alone
80.5%
83.8%
Motorcycle
0.2%
0.1%
Railroad
0.2%
0.1%
Subway
0.2%
0%
Walked
3.3%
1.7%
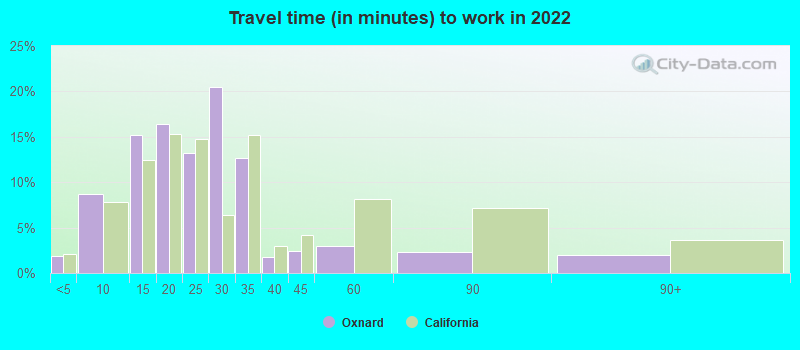
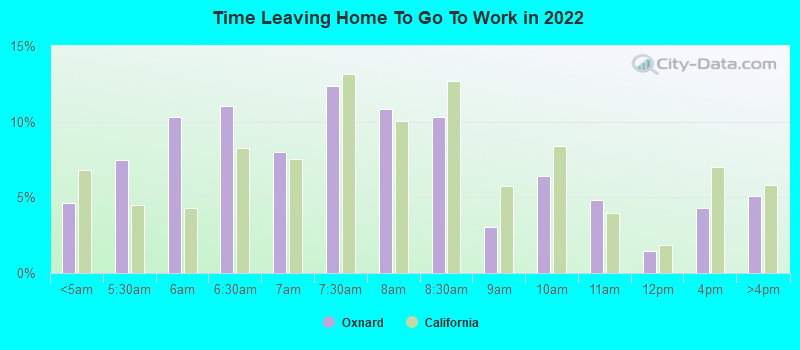
Average travel time to work
Type
San Jose
Oxnard
Average
29.2 min
24.3 min
Other means
27.9 min
23.3 min
Public transportation
48.5 min
44.5 min
Private vehicle occupancy
Type
San Jose
Oxnard
Average
1.2
1.3
Drove alone
87.3%
79.7%
In 2 person carpool
8.9%
16.6%
In 3 person carpool
1.9%
2%
In 4 person carpool
1.1%
1.4%
In 5-6 person carpool
0.6%
0.3%
In 7+ person carpool
0.2%
0%
How many people usually rode to work in the car, truck or van.
Real Estate
San Jose's real estate is expensive and competitive, reflecting its tech hub status. Property prices are way above the national average. In contrast, Oxnard's property market is much more affordable. The city offers a mix of housing styles at various price points.
Neighborhoods
San Jose's neighborhoods range from upscale areas like Willow Glen and Rose Garden to suburb-like districts such as Blossom Valley. Each area contributes to the city's multicultural vibe. Oxnard has a variety of neighborhoods too, from beachfront communities like Silver Strand to more suburban locales like RiverPark.
Houses and residents
Type
San Jose
Oxnard
Houses
340,561
53,778
Average household size (people)
3.1
4
Median year apartment built
1979
1976
Median year house/condo built
1973
1978
Length of stay in the house since moving in
15.6 years
16.7 years
Houses occupied
322,881 (94.8%)
50,611 (94.1%)
Houses occupied by owners
179,797 (55.7%)
28,798 (56.9%)
Houses occupied by renters
143,084 (44.3%)
21,813 (43.1%)
Median rent asked for vacant for-rent units
$3,214
$2,319
Median monthly housing costs
$2,463
$1,776
Median price asked for vacant for-sale houses and condos
$1,197,016
$504,898
Estimated median house or condo value
Over $1,000,000
$569,700
Median numbers of rooms
4.9
5.1
Median number of rooms in apartments
3.6
4
Median number of rooms in houses and condos
6
6
Median house price - detached houses
Over $1,000,000
$630,609
Median house price - in 2-unit structures
$753,788
$186,823
Median house price - in 3-to-4-unit structures
$680,453
$312,007
Median house price - in 5 or more unit structures
$688,625
$381,886
Median house price - mobile homes
$240,963
$168,766
Median house price - occupied boats, rvs, vans etc.
$55,872
$10,415
Median house price - Townhouses or other attached units
$892,629
$471,060
Median house price - All housing units
Over $1,000,000
$563,725
Median house age
45
44
Renting percentage
41.5%
44.3%
Housing density (houses/condos per square mile)
1,947.6
2,124.4
House value disparities
21.2%
23%
Household income disparities
38.3%
38.3%
Median household income for houses/condes with a mortgage
$197,583
$113,007
Median household income for apartments without a mortgage
$103,711
$93,319
Housing units without a mortgage
2,632 (2.1%)
341 (1.7%)
Housing units with both a second mortgage and home equity loan
13,499 (10.6%)
1,053 (5.3%)
Housing units with a mortgage
124,224 (97.9%)
19,481 (98.3%)
Housing units with a home equity loan
346 (0.3%)
0 (0%)
Housing units with a second mortgage
16,249 (12.8%)
1,193 (6%)
House/condo owner moved in on average (years ago)
14
14
House/condo renter moved in on average (years ago)
3
4
Housing units lacking complete kitchen facilities
1.2%
1.2%
Housing units lacking complete plumbing facilities
0.6%
0.6%
Housing units in structures
Housing units in structures
San Jose
Oxnard
One, detached
50.9%
53.4%
One, attached
11.5%
11.2%
Two
1.1%
1.0%
3 or 4
5.0%
5.8%
5 to 9
5.1%
5.8%
10 to 19
4.5%
8.0%
20 to 49
4.5%
4.2%
50 or more
14.2%
5.5%
Mobile homes
3.1%
5.1%
Boats, RVs, vans, etc.
0.1%
0.1%
Median real estate property taxes paid for housing units
Self-employed workers in own not incorporated business
28,517
3,104
State government workers
10,222
2,796
Unpaid family workers
472
0
Industries and Occupations
The predominant industry in San Jose is technology, offering diverse opportunities in software development, IT, and other tech-related professions. In Oxnard, the largest sectors are agriculture, healthcare, and education.
San Jose features large, high-ranking healthcare institutions like Stanford Health Care and Kaiser Permanente. Oxnard's healthcare facilities such as St. John's Regional Medical Center may not rank as highly nationwide but offer comprehensive healthcare services for the local community.
San Jose boasts extensive city infrastructure, including top-tier hospitals, sprawling shopping centers, and a robust public transport network. Oxnard's infrastructure is smaller and less developed but suits its coastal town charm, featuring marinas, local shopping centers, and beachfront amenities.
Infrastructure
Type
San Jose
Oxnard
Hospitals
20
6
TV stations
9
4
Bank branches located here
145
25
Bank institutions located here
25
14
Main business address for public companies
74
1
Drinking water stations with no reported violations in the past
21
1
Drinking water stations with reported violations in the past
HMDA - Conventional home purchase loans - Applications denied
Year
San Jose
Oxnard
1999
3,839
308
2000
2,577
337
2001
1,953
322
2002
1,908
400
2003
3,578
739
2004
5,489
823
2005
6,994
1,172
2006
6,324
1,171
2007
4,298
900
2008
2,419
527
2009
1,631
210
Culture and Food
San Jose offers a rich cultural scene with numerous museums, theatres, and a vibrant culinary scene influenced by its diverse population. Oxnard, known for its annual Strawberry Festival, has a more relaxed and beach-oriented culture. While its dining scene may not be as diverse, it boasts excellent seafood and Mexican cuisine options.
Sports Teams
San Jose is home to the San Jose Sharks (NHL), Earthquakes (MLS), and minor league affiliates for MLB's Giants and A's. Oxnard doesn't have major league teams but is a training destination for the NFL's Dallas Cowboys during the summer.


 San Jose, CA
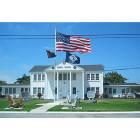
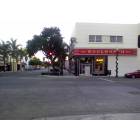
 Oxnard, CA