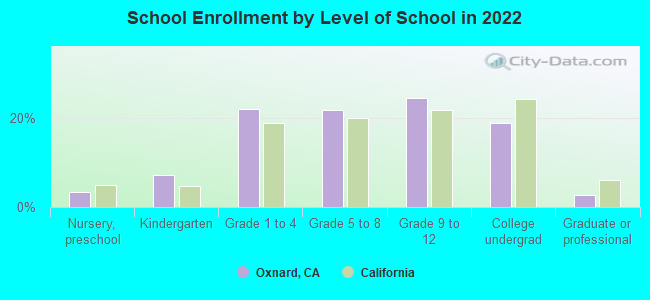
Oxnard, California
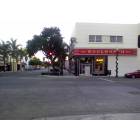
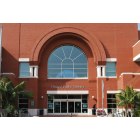
Oxnard: Oxnard, CA, Downtown, Woolworth Building
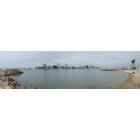
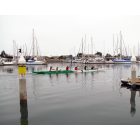
Oxnard: Oxnard Harbor on Tall Ship Day
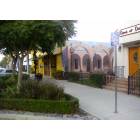
Oxnard: Oxnard, CA, Downtown, Mural at Thomas Cafe
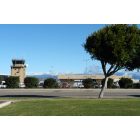
Oxnard: Oxnard airport

Oxnard: Carnegie Art Musium
Oxnard: Oxnard Public Library
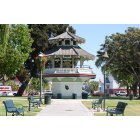
Oxnard: Plaza Park at 5th and C
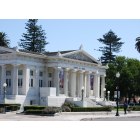
Oxnard: Carnegie Art Musium

Oxnard: Plaza Park at 5th and C
Oxnard: Rowing in Channel Islands Harbor
Oxnard: SeaBee College Pt. Hueneme
- see
14
more - add
your
Submit your own pictures of this city and show them to the world
- OSM Map
- General Map
- Google Map
- MSN Map
Population change since 2000: +17.6%
 |
| Males: 100,912 | |
| Females: 99,503 |
| Median resident age: | 34.7 years |
| California median age: | 37.9 years |
Zip codes: 93001, 93003, 93030, 93033, 93041, 93043.
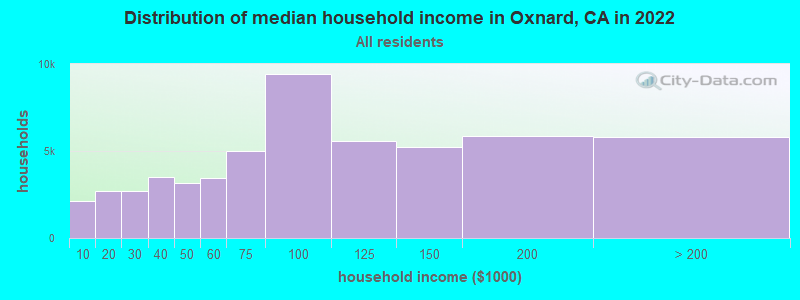
Oxnard Zip Code Map| Oxnard: | $84,941 |
| CA: | $91,551 |
Estimated per capita income in 2022: $30,307 (it was $15,288 in 2000)
Oxnard city income, earnings, and wages data
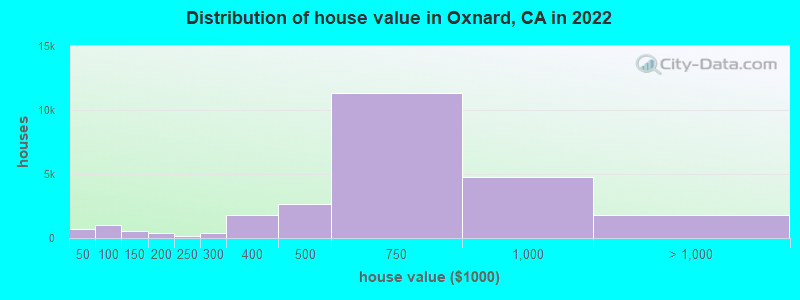
Estimated median house or condo value in 2022: $651,900 (it was $183,200 in 2000)
| Oxnard: | $651,900 |
| CA: | $715,900 |
Mean prices in 2022: all housing units: $660,475; detached houses: $726,118; townhouses or other attached units: $564,466; in 2-unit structures: $489,430; in 3-to-4-unit structures: $489,004; in 5-or-more-unit structures: $484,986; mobile homes: $190,545; occupied boats, rvs, vans, etc.: $5,583
Median gross rent in 2022: $1,945.
(9.0% for White Non-Hispanic residents, 6.3% for Black residents, 13.9% for Hispanic or Latino residents, 21.7% for American Indian residents, 0.3% for Native Hawaiian and other Pacific Islander residents, 11.8% for other race residents, 14.1% for two or more races residents)
Detailed information about poverty and poor residents in Oxnard, CA


Compare current foreclosures in Oxnard, CA:
| Photo | Address | Area | Beds / Baths | Price | Details |
|---|---|---|---|---|---|

|
#1
Islander Walk
Oxnard, CA 93035
|
1,283 sq. feet
|
2 baths 2 beds |
show details | |

|
#2
Kern St
Oxnard, CA 93033
|
1,233 sq. feet
|
2 baths 4 beds |
show details | |

|
#3
Lookout Dr
Oxnard, CA 93035
|
1,950 sq. feet
|
2 baths 4 beds |
show details | |

|
#4
Canal St
Oxnard, CA 93035
|
2,504 sq. feet
|
3 baths 3 beds |
show details | |

|
#5
Callas Dr
Oxnard, CA 93035
|
2,469 sq. feet
|
3 baths 5 beds |
show details | |

|
#6
Kumquat Pl
Oxnard, CA 93036
|
1,860 sq. feet
|
2 baths 5 beds |
show details | |

|
#7
Ribera Dr
Oxnard, CA 93030
|
2,419 sq. feet
|
3 baths 4 beds |
show details | |

|
#8
N Hayes Ave
Oxnard, CA 93030
|
1,044 sq. feet
|
1 baths 3 beds |
show details | |

|
#9
Entrada Dr
Oxnard, CA 93036
|
1,807 sq. feet
|
2 baths 4 beds |
show details | |

|
#10
Green River St
Oxnard, CA 93036
|
1,556 sq. feet
|
2 baths 4 beds |
show details |
| Photo | Address | Area | Beds / Baths | Price | Details |
|---|---|---|---|---|---|

|
#11
Sanford St
Oxnard, CA 93033
|
1,170 sq. feet
|
2 baths 3 beds |
show details | |

|
#12
W Robert Ave
Oxnard, CA 93030
|
1,838 sq. feet
|
2 baths 4 beds |
show details | |

|
#13
Redwood St
Oxnard, CA 93033
|
1,252 sq. feet
|
2 baths 3 beds |
show details | |

|
#14
Juneberry Pl
Oxnard, CA 93036
|
1,240 sq. feet
|
2 baths 3 beds |
show details | |

|
#15
Upper Bay Dr
Oxnard, CA 93036
|
2,333 sq. feet
|
2 baths 4 beds |
show details | |

|
#16
S B St
Oxnard, CA 93033
|
1,614 sq. feet
|
2 baths 3 beds |
show details | |

|
#17
Berkshire St
Oxnard, CA 93033
|
1,418 sq. feet
|
2 baths 3 beds |
show details | |

|
#18
S G St # 321
Oxnard, CA 93030
|
1,008 sq. feet
|
1 baths 3 beds |
show details | |

|
#19
Jackson St
Oxnard, CA 93033
|
1,170 sq. feet
|
1 baths 3 beds |
show details | |

|
#20
Tradewinds Dr
Oxnard, CA 93035
|
1,734 sq. feet
|
2 baths 2 beds |
show details |
| Photo | Address | Area | Beds / Baths | Price | Details |
|---|---|---|---|---|---|

|
#21
E Hemlock St
Oxnard, CA 93033
|
1,888 sq. feet
|
3 baths 3 beds |
show details | |

|
#22
W Channel Islands Blvd
Oxnard, CA 93033
|
1,128 sq. feet
|
2 baths 3 beds |
show details | |

|
#23
Snow Ave
Oxnard, CA 93036
|
2,013 sq. feet
|
3 baths 3 beds |
show details | |

|
#24
Berkshire Pl
Oxnard, CA 93033
|
1,762 sq. feet
|
2 baths 4 beds |
show details | |

|
#25
San Simeon Dr
Oxnard, CA 93033
|
2,268 sq. feet
|
3 baths 6 beds |
show details | |

|
#26
Mendocino Pl
Oxnard, CA 93033
|
1,134 sq. feet
|
2 baths 3 beds |
show details | |

|
#27
Kern St
Oxnard, CA 93033
|
2,078 sq. feet
|
4 baths 10 beds |
show details | |

|
#28
Tangerine Pl
Oxnard, CA 93033
|
1,288 sq. feet
|
2 baths 3 beds |
show details | |

|
#29
Rhonda St
Oxnard, CA 93036
|
1,639 sq. feet
|
2 baths 3 beds |
show details | |

|
#30
Salem Ave
Oxnard, CA 93036
|
1,152 sq. feet
|
2 baths 4 beds |
show details |
| Photo | Address | Area | Beds / Baths | Price | Details |
|---|---|---|---|---|---|

|
#31
Gisler Ave
Oxnard, CA 93033
|
1,575 sq. feet
|
2 baths 4 beds |
show details | |

|
#32
Hill St
Oxnard, CA 93035
|
2,594 sq. feet
|
2 baths 4 beds |
show details | |

|
#33
Napoleon Ave
Oxnard, CA 93033
|
1,615 sq. feet
|
2 baths 4 beds |
show details | |

|
#34
Junto Ln
Oxnard, CA 93036
|
2,932 sq. feet
|
2 baths 3 beds |
show details | |

|
#35
Cesar Chavez Dr
Oxnard, CA 93030
|
2,399 sq. feet
|
3 baths 4 beds |
show details | |

|
#36
Fathom Dr
Oxnard, CA 93035
|
1,178 sq. feet
|
2 baths 3 beds |
show details | |

|
#37
Mandalay Beach Rd
Oxnard, CA 93035
|
2,914 sq. feet
|
2 baths 3 beds |
show details | |

|
#38
Julian St
Oxnard, CA 93030
|
1,023 sq. feet
|
1 baths 3 beds |
show details | |

|
#39
Entrada Dr
Oxnard, CA 93036
|
1,807 sq. feet
|
2 baths 4 beds |
show details | |

|
#40
Curran St
Oxnard, CA 93033
|
1,232 sq. feet
|
2 baths 3 beds |
show details |
| Photo | Address | Area | Beds / Baths | Price | Details |
|---|---|---|---|---|---|

|
#41
Avila Pl
Oxnard, CA 93036
|
1,400 sq. feet
|
2 baths 3 beds |
show details | |

|
#42
Pavin Dr
Oxnard, CA 93036
|
3,149 sq. feet
|
3 baths 5 beds |
show details | |

|
#43
N Ventura Rd
Oxnard, CA 93036
|
1,375 sq. feet
|
2 baths 3 beds |
show details | |

|
#44
S E St
Oxnard, CA 93033
|
1,373 sq. feet
|
2 baths 3 beds |
show details | |

|
#45
S J St
Oxnard, CA 93033
|
1,252 sq. feet
|
2 baths 3 beds |
show details | |

|
#46
W Elm St
Oxnard, CA 93033
|
1,272 sq. feet
|
2 baths 3 beds |
show details | |

|
#47
Encino Pl
Oxnard, CA 93033
|
1,612 sq. feet
|
2 baths 3 beds |
show details | |

|
#48
Jurymast Dr
Oxnard, CA 93030
|
2,184 sq. feet
|
2 baths 4 beds |
show details | |

|
#49
W Vineyard Ave
Oxnard, CA 93036
|
1,013 sq. feet
|
2 baths 2 beds |
show details | |

|
Check over 1 million property listings on Foreclosure.com!
|
browse all offers | |||


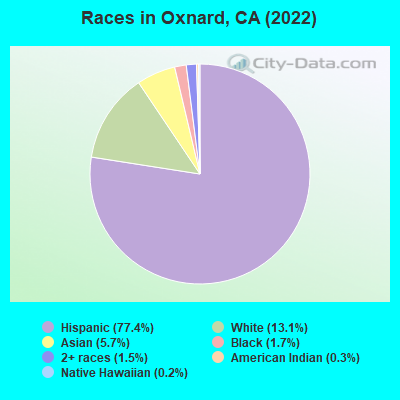
- 155,13377.4%Hispanic
- 26,18413.1%White alone
- 11,3475.7%Asian alone
- 3,4221.7%Black alone
- 3,0851.5%Two or more races
- 6370.3%American Indian alone
- 4540.2%Native Hawaiian and Other
Pacific Islander alone - 1750.09%Other race alone
According to our research of California and other state lists, there were 241 registered sex offenders living in Oxnard, California as of April 27, 2024.
The ratio of all residents to sex offenders in Oxnard is 863 to 1.
The ratio of registered sex offenders to all residents in this city is near the state average.
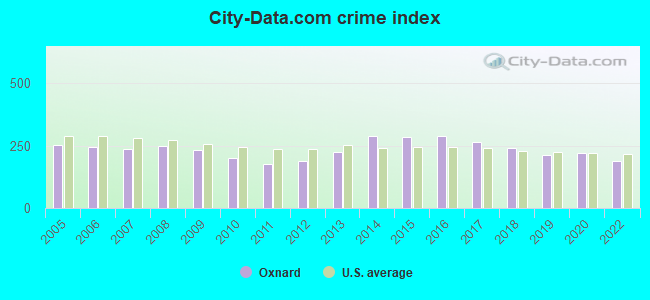
The City-Data.com crime index weighs serious crimes and violent crimes more heavily. Higher means more crime, U.S. average is 246.1. It adjusts for the number of visitors and daily workers commuting into cities.
- means the value is smaller than the state average.- means the value is about the same as the state average.
- means the value is bigger than the state average.
- means the value is much bigger than the state average.
Crime rate in Oxnard detailed stats: murders, rapes, robberies, assaults, burglaries, thefts, arson
Full-time law enforcement employees in 2021, including police officers: 317 (227 officers - 197 male; 30 female).
| Officers per 1,000 residents here: | 1.09 |
| California average: | 2.30 |
 Recent articles from our blog. Our writers, many of them Ph.D. graduates or candidates, create easy-to-read articles on a wide variety of topics.

 | Relocating to Ventura , work in east Oxnard (11 replies) |
| Apartment rentals in Oxnard (4 replies) |
| Help - should we move to Oxnard or Camarillo? (6 replies) |
| Can you tell me about Oxnard, Port Hueneme area (5 replies) |
| Oxnard - A City With Amazing Potential (39 replies) |
| Going up to Oxnard on Tuesday. Any advice? (15 replies) |
Latest news from Oxnard, CA collected exclusively by city-data.com from local newspapers, TV, and radio stations
Ancestries: American (6.3%).
Current Local Time: PST time zone
Elevation: 52 feet
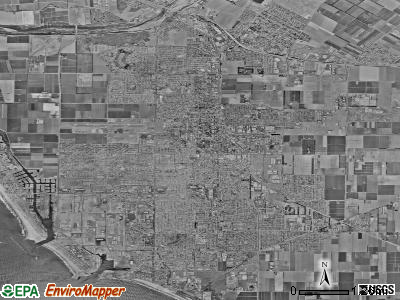
Land area: 25.3 square miles.
Population density: 7,917 people per square mile (high).
67,249 residents are foreign born (28.0% Latin America, 4.4% Asia).
| This city: | 33.6% |
| California: | 26.5% |
Median real estate property taxes paid for housing units with mortgages in 2022: $4,658 (0.7%)
Median real estate property taxes paid for housing units with no mortgage in 2022: $2,695 (0.5%)
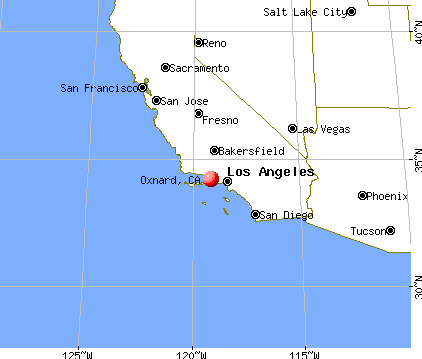
Nearest city with pop. 200,000+: Los Angeles, CA  (46.7 miles , pop. 3,694,820).
Nearest cities:
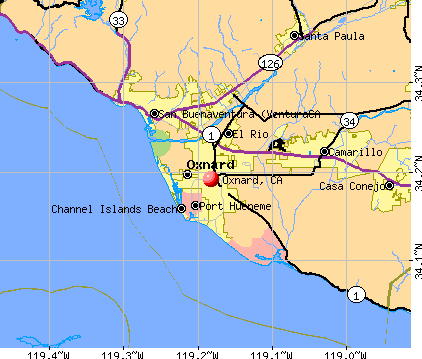
), ), )Latitude: 34.19 N, Longitude: 119.18 W
Daytime population change due to commuting: -23,898 (-11.9%)
Workers who live and work in this city: 40,673 (41.8%)
Area code: 805
Oxnard, California accommodation & food services, waste management - Economy and Business Data
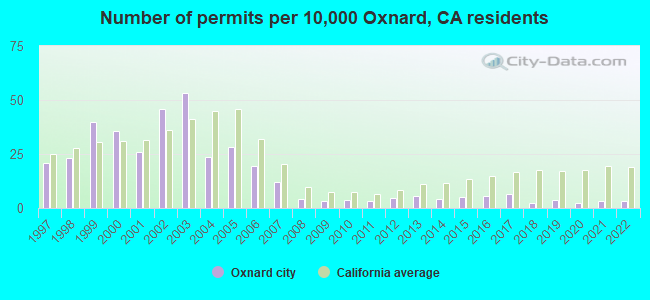
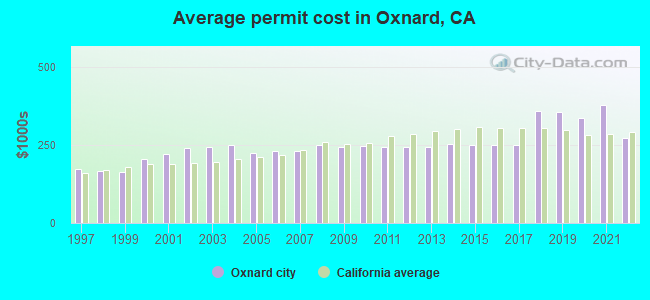
Single-family new house construction building permits:
- 2022: 58 buildings, average cost: $270,100
- 2021: 52 buildings, average cost: $377,300
- 2020: 36 buildings, average cost: $336,100
- 2019: 63 buildings, average cost: $355,800
- 2018: 39 buildings, average cost: $358,200
- 2017: 108 buildings, average cost: $249,700
- 2016: 96 buildings, average cost: $249,800
- 2015: 89 buildings, average cost: $249,400
- 2014: 71 buildings, average cost: $251,200
- 2013: 94 buildings, average cost: $244,400
- 2012: 77 buildings, average cost: $244,400
- 2011: 56 buildings, average cost: $244,400
- 2010: 61 buildings, average cost: $244,600
- 2009: 59 buildings, average cost: $243,500
- 2008: 74 buildings, average cost: $247,700
- 2007: 205 buildings, average cost: $228,700
- 2006: 328 buildings, average cost: $229,600
- 2005: 482 buildings, average cost: $223,400
- 2004: 399 buildings, average cost: $247,600
- 2003: 905 buildings, average cost: $243,900
- 2002: 777 buildings, average cost: $240,400
- 2001: 439 buildings, average cost: $219,000
- 2000: 608 buildings, average cost: $202,500
- 1999: 679 buildings, average cost: $163,600
- 1998: 395 buildings, average cost: $165,400
- 1997: 355 buildings, average cost: $171,700
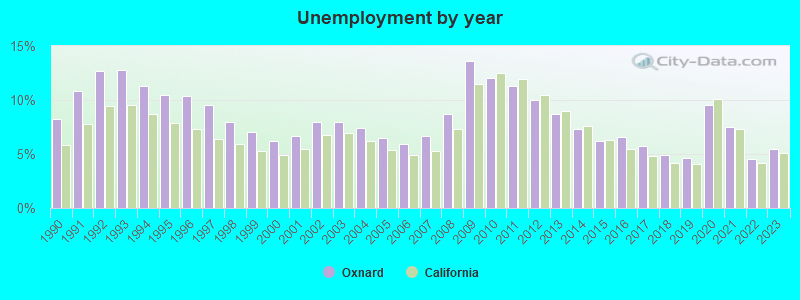
| Here: | 5.5% |
| California: | 5.1% |
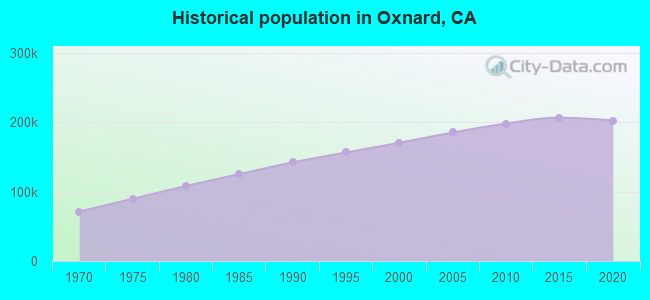
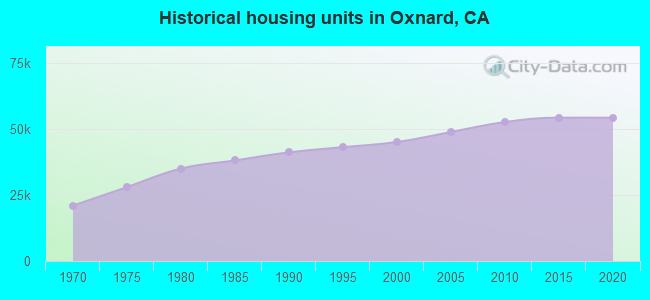
Population change in the 1990s: +27,662 (+19.4%).
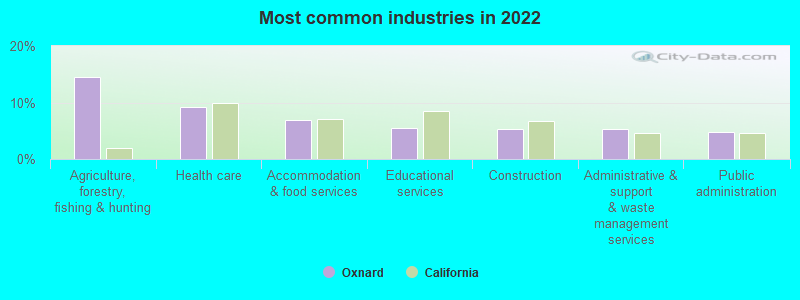
- Agriculture, forestry, fishing & hunting (14.5%)
- Health care (9.2%)
- Accommodation & food services (7.0%)
- Educational services (5.5%)
- Construction (5.3%)
- Administrative & support & waste management services (5.3%)
- Public administration (4.8%)
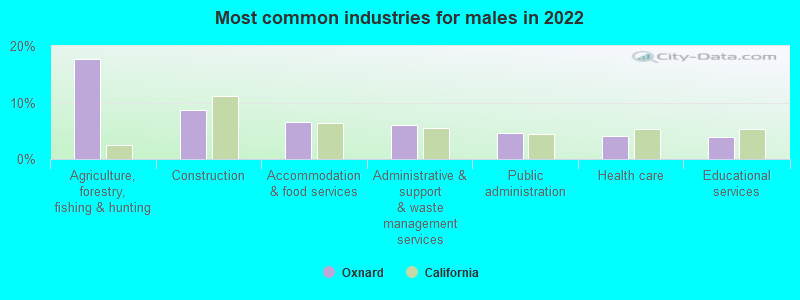
- Agriculture, forestry, fishing & hunting (17.6%)
- Construction (8.7%)
- Accommodation & food services (6.6%)
- Administrative & support & waste management services (6.0%)
- Public administration (4.6%)
- Health care (4.1%)
- Educational services (4.0%)
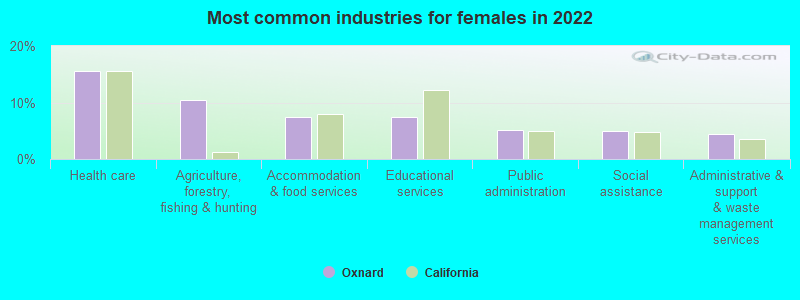
- Health care (15.7%)
- Agriculture, forestry, fishing & hunting (10.4%)
- Accommodation & food services (7.5%)
- Educational services (7.4%)
- Public administration (5.2%)
- Social assistance (5.0%)
- Administrative & support & waste management services (4.5%)
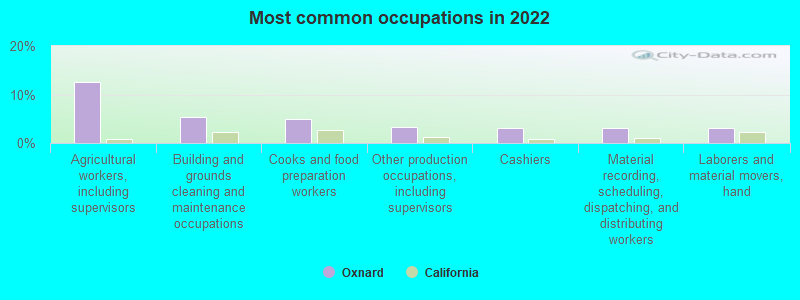
- Agricultural workers, including supervisors (12.6%)
- Building and grounds cleaning and maintenance occupations (5.4%)
- Cooks and food preparation workers (5.0%)
- Other production occupations, including supervisors (3.3%)
- Cashiers (3.1%)
- Material recording, scheduling, dispatching, and distributing workers (3.0%)
- Laborers and material movers, hand (3.0%)
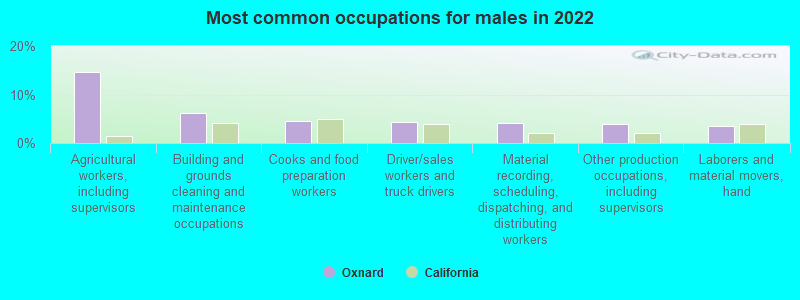
- Agricultural workers, including supervisors (14.6%)
- Building and grounds cleaning and maintenance occupations (6.2%)
- Cooks and food preparation workers (4.6%)
- Driver/sales workers and truck drivers (4.4%)
- Material recording, scheduling, dispatching, and distributing workers (4.1%)
- Other production occupations, including supervisors (3.9%)
- Laborers and material movers, hand (3.6%)
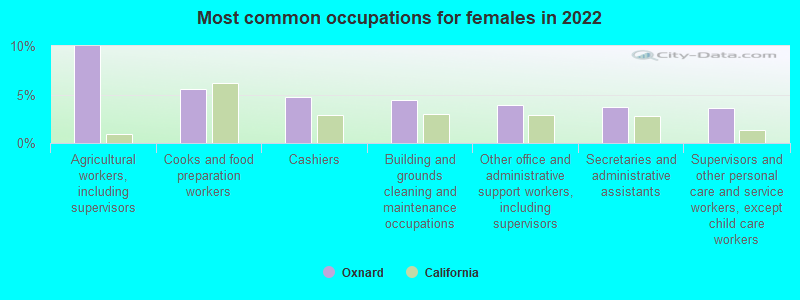
- Agricultural workers, including supervisors (10.0%)
- Cooks and food preparation workers (5.5%)
- Cashiers (4.8%)
- Building and grounds cleaning and maintenance occupations (4.4%)
- Other office and administrative support workers, including supervisors (3.9%)
- Secretaries and administrative assistants (3.8%)
- Supervisors and other personal care and service workers, except child care workers (3.6%)
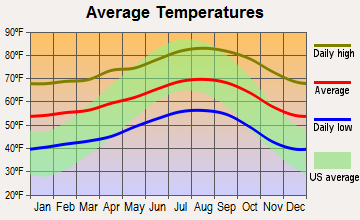
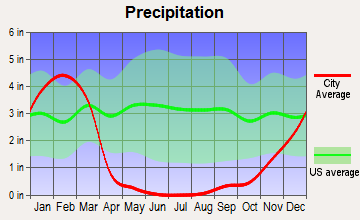
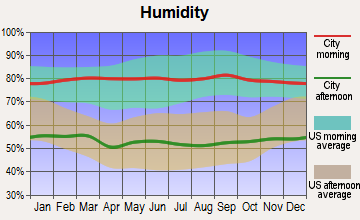
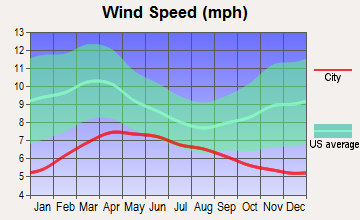
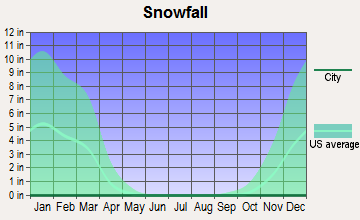
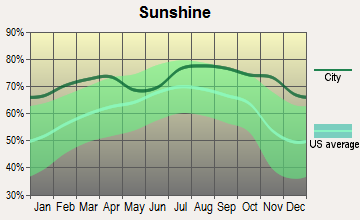
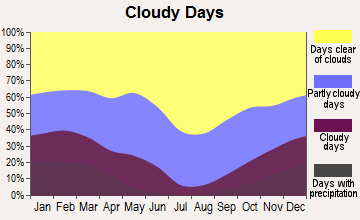
Average climate in Oxnard, California
Based on data reported by over 4,000 weather stations
|
|

(lower is better)
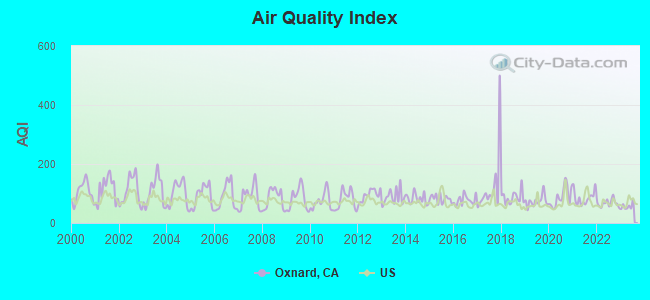
Air Quality Index (AQI) level in 2023 was 56.6. This is better than average.
| City: | 56.6 |
| U.S.: | 72.6 |
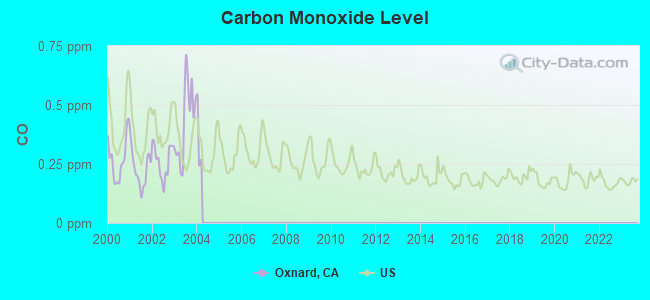
Carbon Monoxide (CO) [ppm] level in 2003 was 0.432. This is significantly worse than average. Closest monitor was 4.8 miles away from the city center.
| City: | 0.432 |
| U.S.: | 0.251 |
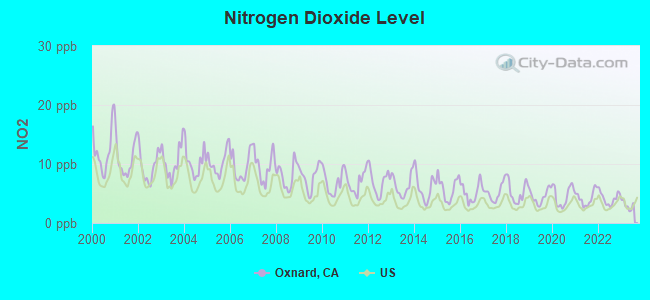
Nitrogen Dioxide (NO2) [ppb] level in 2023 was 2.99. This is significantly better than average. Closest monitor was 3.3 miles away from the city center.
| City: | 2.99 |
| U.S.: | 5.11 |
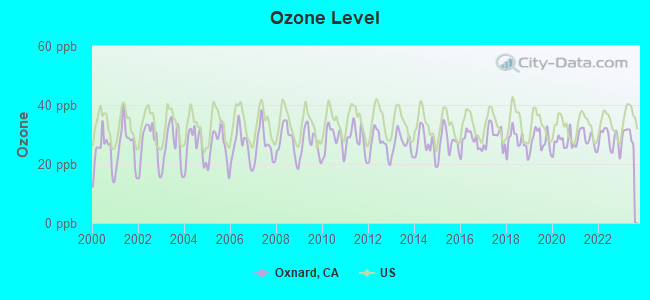
Ozone [ppb] level in 2023 was 29.8. This is about average. Closest monitor was 3.3 miles away from the city center.
| City: | 29.8 |
| U.S.: | 33.3 |
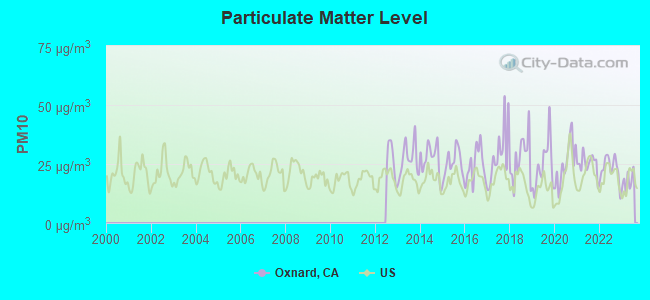
Particulate Matter (PM10) [µg/m3] level in 2023 was 17.8. This is about average. Closest monitor was 4.8 miles away from the city center.
| City: | 17.8 |
| U.S.: | 19.2 |
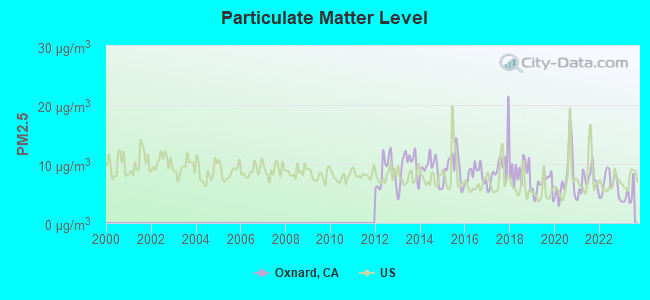
Particulate Matter (PM2.5) [µg/m3] level in 2023 was 4.73. This is significantly better than average. Closest monitor was 4.8 miles away from the city center.
| City: | 4.73 |
| U.S.: | 8.11 |
Earthquake activity:
Oxnard-area historical earthquake activity is significantly above California state average. It is 6623% greater than the overall U.S. average.On 7/21/1952 at 11:52:14, a magnitude 7.7 (7.7 UK, Class: Major, Intensity: VIII - XII) earthquake occurred 56.9 miles away from the city center, causing $50,000,000 total damage
On 11/4/1927 at 13:51:53, a magnitude 7.5 (7.5 UK) earthquake occurred 116.6 miles away from the city center
On 6/28/1992 at 11:57:34, a magnitude 7.6 (6.2 MB, 7.6 MS, 7.3 MW, Depth: 0.7 mi) earthquake occurred 151.6 miles away from Oxnard center, causing 3 deaths (1 shaking deaths, 2 other deaths) and 400 injuries, causing $100,000,000 total damage and $40,000,000 insured losses
On 10/16/1999 at 09:46:44, a magnitude 7.4 (6.3 MB, 7.4 MS, 7.2 MW, 7.3 ML) earthquake occurred 158.5 miles away from the city center
On 1/17/1994 at 12:30:55, a magnitude 6.8 (6.4 MB, 6.8 MS, 6.7 MW, Depth: 11.4 mi, Class: Strong, Intensity: VII - IX) earthquake occurred 34.8 miles away from Oxnard center, causing 60 deaths (60 shaking deaths) and 7000 injuries
On 4/18/1906 at 13:12:21, a magnitude 7.9 (7.9 UK) earthquake occurred 338.9 miles away from the city center, causing $524,000,000 total damage
Magnitude types: body-wave magnitude (MB), local magnitude (ML), surface-wave magnitude (MS), moment magnitude (MW)
Natural disasters:
The number of natural disasters in Ventura County (36) is a lot greater than the US average (15).Major Disasters (Presidential) Declared: 24
Emergencies Declared: 2
Causes of natural disasters: Fires: 17, Floods: 16, Storms: 10, Landslides: 5, Mudslides: 4, Winter Storms: 4, Freezes: 2, Heavy Rains: 2, Earthquake: 1, Hurricane: 1, Snow: 1, Tornado: 1, Wind: 1, Other: 1 (Note: some incidents may be assigned to more than one category).
Main business address for: CalAmp Corp. (RADIO & TV BROADCASTING & COMMUNICATIONS EQUIPMENT).
Hospitals in Oxnard:
- JOANNE COMMUNITY HOME (1701 JOANNE WY)
- MITCHELL HOME - L STREET (1024 L ST)
- PACIFIC SHORES HOSPITAL (2130 N VENTURA RD)
- PROCARE HOSPICE (1700 NORTH LOMBARD STREET, SUITE 210)
- ST JOHNS REGIONAL MEDICAL CENTER (Voluntary non-profit - Private, 1600 N ROSE AVE)
- ST THOMAS AQUINAS HOME (765 E YUCCA ST)
Nursing Homes in Oxnard:
- GLENWOOD CARE CENTER (1300 NORTH C ST)
- MAYWOOD ACRES HEALTHCARE (2641 SOUTH C ST)
- OXNARD MANOR HEALTHCARE CENTER (1400 W GONZALES RD)
- SHORELINE CARE CENTER (5225 SOUTH J ST)
Dialysis Facilities in Oxnard:
- DAVITA-OXNARD DIALYSIS CENTER (1900 OUTLET CENTER DR.)
- FMC-DIALYSIS SERVICES OF CHANNEL ISLANDS (2679 S. SAVIERS ROAD, SUITE B)
- FMC-OXNARD (1801 HOLSER WALK, SUITE 310)
Home Health Centers in Oxnard:
Airports and heliports located in Oxnard:
- Oxnard Airport (OXR) (Runways: 1, Air Taxi Ops: 5,506, Itinerant Ops: 23,846, Local Ops: 29,457, Military Ops: 686)
- Point Mugu Nas (Naval Base Ventura Co) Airport (NTD) (Runways: 2)
- Rotor-Aids Maintenance Hangar Heliport (CL73)
- St John's Regional Medical Center Heliport (2CL6)
Amtrak station:
OXNARD (201 E. 4TH ST.) . Services: ticket office, fully wheelchair accessible, enclosed waiting area, public restrooms, public payphones, snack bar, free short-term parking, free long-term parking, call for car rental service, call for taxi service, intercity bus service, public transit connection.Colleges/Universities in Oxnard:
- Oxnard College (Full-time enrollment: 3,879; Location: 4000 S Rose Ave; Public; Website: www.oxnardcollege.edu)
- ITT Technical Institute-Oxnard (Full-time enrollment: 339; Location: 2051 Solar Dr Suite 150; Private, for-profit; Website: www.itt-tech.edu)
- Pacific Coast Trade School (Full-time enrollment: 238; Location: 1690 Universe Cir; Private, for-profit; Website: pctschool.com/)
- CET-Oxnard (Full-time enrollment: 153; Location: 761 South C St; Private, not-for-profit; Website: cetweb.org)
- Modern Beauty Academy (Full-time enrollment: 50; Location: 699 South C St; Private, for-profit; Website: www.modernbeautyacademy.org)
Other colleges/universities with over 2000 students near Oxnard:
- Ventura College (about 7 miles; Ventura, CA; Full-time enrollment: 8,460)
- California State University-Channel Islands (about 9 miles; Camarillo, CA; FT enrollment: 4,163)
- California Lutheran University (about 18 miles; Thousand Oaks, CA; FT enrollment: 4,103)
- Moorpark College (about 22 miles; Moorpark, CA; FT enrollment: 9,338)
- Pepperdine University (about 30 miles; Malibu, CA; FT enrollment: 6,722)
- Santa Barbara City College (about 34 miles; Santa Barbara, CA; FT enrollment: 12,568)
- Los Angeles Pierce College (about 35 miles; Woodland Hills, CA; FT enrollment: 10,996)
Public high schools in Oxnard:
- OXNARD HIGH (Students: 2,169, Location: 3400 W. GONZALES RD., Grades: 9-12)
- CHANNEL ISLANDS HIGH (Students: 1,806, Location: 1400 RAIDERS WAY, Grades: 9-12)
- RIO MESA HIGH (Students: 1,543, Location: 545 CENTRAL AVE., Grades: 9-12)
- HUENEME HIGH (Students: 1,472, Location: 500 W. BARD RD., Grades: 9-12)
- PROVIDENCE (Students: 87, Location: 4333 VINEYARD AVE., Grades: KG-12)
- PACIFICA HIGH (Location: 600 E. GONZALES RD., Grades: 9-12)
- CONDOR HIGH (Location: 309 S. K ST, Grades: 9-12)
- VISTA REAL CHARTER HIGH (Location: 401 S. A ST., STE. 3, Grades: 9-12, Charter school)
Private high schools in Oxnard:
Biggest public elementary/middle schools in Oxnard:
- CHARLES BLACKSTOCK JUNIOR HIGH (Students: 1,198, Location: 701 E. BARD RD., Grades: 6-8)
- E. O. GREEN JUNIOR HIGH (Students: 932, Location: 3739 S. C ST., Grades: 6-8)
- ROSE AVENUE ELEMENTARY (Students: 751, Location: 220 S. DRISKILL ST., Grades: KG-5)
- OCEAN VIEW JUNIOR HIGH (Students: 714, Location: 4300 OLDS RD., Grades: 6-8)
- RIO DEL VALLE MIDDLE (Students: 675, Location: 3100 ROSE AVE., Grades: 6-8)
- DRIFFILL ELEMENTARY (Students: 621, Location: 910 S. E ST., Grades: KG-8)
- NORMAN R. BREKKE ELEMENTARY (Students: 613, Location: 1400 MLK DR., Grades: KG-5)
- RIO VISTA MIDDLE (Students: 612, Location: 3050 THAMES RIVER DR., Grades: 6-8)
- CHRISTA MCAULIFFE ELEMENTARY (Students: 577, Location: 3300 W. VIA MARINA AVE., Grades: KG-5)
- EMILIE RITCHEN ELEMENTARY (Students: 573, Location: 2200 CABRILLO WAY, Grades: KG-5)
Private elementary/middle schools in Oxnard:
- OUR LADY OF GUADALUPE SCHOOL (Students: 285, Location: 530 N JUANITA AVE, Grades: PK-8)
- SANTA CLARA ELEMENTARY SCHOOL (Students: 222, Location: 324 S E ST, Grades: KG-8)
- ST ANTHONY SCHOOL (Students: 191, Location: 2421 S C ST, Grades: PK-8)
- ST JOHNS LUTHERAN SCHOOL (Students: 161, Location: 1500 N C ST, Grades: KG-8)
- PEPPERMINT JUNCTION (Students: 131, Location: 2150 E GONZALES RD, Grades: PK-4)
- LINDA VISTA ADVENTIST ELEMENTARY SCHOOL (Students: 73, Location: 5050 PERRY WAY, Grades: KG-8)
- NEW HARVEST CHRISTIAN SCHOOLS (Students: 51, Location: 723 S D ST, Grades: KG-7)
Points of interest:
Notable locations in Oxnard: River Ridge Golf Course (A), Mandalay Generating Station (B), Saint Johns Regional Medical Center Health Sciences Library (C), Roger Jones Community Center (D), El Rio Chamber of Commerce (E), Oxnard Public Library (F), Oxnard City Hall (G), Oxnard Chamber of Commerce (H), Gullwing Childrens Museum (I), Colonia Multi-Service Center (J), Oxnard Community Center (K), Oxnard Fire Department Station 1 (L), Gold Coast Ambulance (M), Oxnard Fire Department Station 4 (N), Oxnard Fire Department Station 3 (O), Oxnard Fire Department Station 2 (P), Oxnard Fire Department Station 5 (Q), Oxnard Fire Department Station 6 (R). Display/hide their locations on the map
Shopping Centers: Wagon Wheel Plaza Shopping Center (1), Vineyard Plaza Shopping Center (2), Rose Shopping Center (3), Esplanade Mall Shopping Center (4), College Park Shopping Center (5), Centerpoint Mall Shopping Center (6), Carriage Square Shopping Center (7), Channel Island Shopping Center (8), Pleasant Valley Shopping Center (9). Display/hide their locations on the map
Main business address in Oxnard: CalAmp Corp. (A). Display/hide its location on the map
Churches in Oxnard include: Church for the Nations (A), All Saints Episcopal Church (B), Buddhist Church of Oxnard (C), First Baptist Church (D), First Church of Christ Scientist (E), First Presbyterian Church (F), Foursquare Gospel Church (G), Oxnard Community Christian Church (H), Calvary Chapel Oxnard (I). Display/hide their locations on the map
Cemeteries: Japanese Cemetery (1), Santa Clara Cemetery (2), Masonic Cemetery (3). Display/hide their locations on the map
Lake: McGrath Lake (A). Display/hide its location on the map
Parks in Oxnard include: Brittell Park (1), Eastwood Memorial Park (2), Johnson Creek Park (3), Pleasant Valley Park (4), Southwinds Park (5), Cabrillo Park (6), Fremont Park (7), Marina West Park (8), Oxnard Shores Park (9). Display/hide their locations on the map
Beach: Ormond Beach (A). Display/hide its location on the map
Tourist attractions: Carnegie Art Museum (424 South Centre Street) (1), Botanica Y Regalos (Cultural Attractions- Events- & Facilities; 342 South 5th Street) (2), Botanica La Candelaria (Botanical Gardens; 2216 Saviers Rd) (3). Display/hide their approximate locations on the map
Hotels: Best Western Oxnard Inn (1156 South Oxnard Boulevard) (1), Ambassador Motel (1631 South Oxnard Bl) (2). Display/hide their approximate locations on the map
Birthplace of: Fernando Vargas - Boxer, Jeffrey Combs - Film actor, Dave Carter - Singer-songwriter, Madlib - Rapper, Aaron Small - 2005 Major League Baseball player (New York Yankees, born: Nov 23, 1971), Armando Xavier Ochoa - Titular Bishop of Sitifis, Blaine Saipaia - 2005 NFL player (St. Louis Rams, born: Aug 25, 1978), Brandon Knight (baseball) - Baseball player, Bruce Schwab - Sailor, Javier García Calderón - Boxer.
Drinking water stations with addresses in Oxnard and their reported violations in the past:
PINE MOUNTAIN INN WATER SYSTEM (Address: 93993 HWY 30 , Population served: 25, Groundwater):Past monitoring violations:
- One routine major monitoring violation
Drinking water stations with addresses in Oxnard that have no violations reported:
- VULCAN MATERIALS COMPANY - CAL MAT (Population served: 26, Primary Water Source Type: Groundwater)
| This city: | 4.0 people |
| California: | 2.9 people |
| This city: | 80.3% |
| Whole state: | 68.7% |
| This city: | 7.5% |
| Whole state: | 7.2% |
Likely homosexual households (counted as self-reported same-sex unmarried-partner households)
- Lesbian couples: 0.4% of all households
- Gay men: 0.4% of all households
People in group quarters in Oxnard in 2010:
- 465 people in nursing facilities/skilled-nursing facilities
- 368 people in group homes intended for adults
- 204 people in other noninstitutional facilities
- 143 people in workers' group living quarters and job corps centers
- 114 people in residential treatment centers for adults
- 103 people in emergency and transitional shelters (with sleeping facilities) for people experiencing homelessness
- 21 people in local jails and other municipal confinement facilities
- 10 people in group homes for juveniles (non-correctional)
- 6 people in residential treatment centers for juveniles (non-correctional)
People in group quarters in Oxnard in 2000:
- 622 people in other noninstitutional group quarters
- 475 people in nursing homes
- 438 people in other group homes
- 343 people in homes for the mentally retarded
- 340 people in agriculture workers' dormitories on farms
- 153 people in homes for the mentally ill
- 63 people in homes or halfway houses for drug/alcohol abuse
- 59 people in religious group quarters
- 44 people in other workers' dormitories
- 32 people in other nonhousehold living situations
- 28 people in residential treatment centers for emotionally disturbed children
Banks with most branches in Oxnard (2011 data):
- Wells Fargo Bank, National Association: Oxnard South Ventura Branch, Oxnard Branch, Oxnard Pb Branch, Centerpoint Mall Branch, Oxnard Rose. Info updated 2011/04/05: Bank assets: $1,161,490.0 mil, Deposits: $905,653.0 mil, headquarters in Sioux Falls, SD, positive income, 6395 total offices, Holding Company: Wells Fargo & Company
- JPMorgan Chase Bank, National Association: Oxnard - Rose Crossing, 350 Esplanade Drive Branch, Oxnard Branch. Info updated 2011/11/10: Bank assets: $1,811,678.0 mil, Deposits: $1,190,738.0 mil, headquarters in Columbus, OH, positive income, International Specialization, 5577 total offices, Holding Company: Jpmorgan Chase & Co.
- Bank of America, National Association: Oxnard Main Branch, South Oxnard Branch, Fremont Square Branch. Info updated 2009/11/18: Bank assets: $1,451,969.3 mil, Deposits: $1,077,176.8 mil, headquarters in Charlotte, NC, positive income, 5782 total offices, Holding Company: Bank Of America Corporation
- U.S. Bank National Association: North Rose Avenue Vons, Oxnard Vons Branch, Oxnard Main. Info updated 2012/01/30: Bank assets: $330,470.8 mil, Deposits: $236,091.5 mil, headquarters in Cincinnati, OH, positive income, 3121 total offices, Holding Company: U.S. Bancorp
- Rabobank, National Association: Downtown Oxnard Branch at 155 South A Street, branch established on 1985/09/14; Esplanade Branch at 300 East Esplanade Drive, Suite 101, branch established on 1995/08/14. Info updated 2011/01/27: Bank assets: $11,745.0 mil, Deposits: $8,446.0 mil, headquarters in Roseville, CA, positive income, Agricultural Specialization, 124 total offices, Holding Company: Cooperatieve Centrale Raiffeisen-Boerenleenbank B.A., "rabobank Nederland
- Santa Barbara Bank & Trust, National Association: Oxnard Branch at 400 East Esplanade Drive, branch established on 2005/11/14. Info updated 2011/06/09: Bank assets: $5,847.9 mil, Deposits: $4,684.3 mil, headquarters in Santa Barbara, CA, positive income, Commercial Lending Specialization, 48 total offices, Holding Company: Sb Acquisition Company, Llc
- County Commerce Bank: Gonzales Branch at 2400 E. Gonzales Road, branch established on 2005/09/21. Info updated 2008/01/09: Bank assets: $185.5 mil, Deposits: $160.6 mil, headquarters in Ventura, CA, positive income, Commercial Lending Specialization, 3 total offices
- Royal Business Bank: Ventura County Business Bank Branch at 366 W. Esplanade Drive, branch established on 2003/04/02. Info updated 2011/09/28: Bank assets: $502.4 mil, Deposits: $427.6 mil, headquarters in Los Angeles, CA, positive income, Commercial Lending Specialization, 9 total offices, Holding Company: Rbb Bancorp
- Citibank, National Association: Oxnard Branch at 2900 South Saviers Road, branch established on 1945/01/01. Info updated 2012/01/10: Bank assets: $1,288,658.0 mil, Deposits: $882,541.0 mil, headquarters in Sioux Falls, SD, positive income, International Specialization, 1048 total offices, Holding Company: Citigroup Inc.
- 5 other banks with 5 local branches
For population 15 years and over in Oxnard:
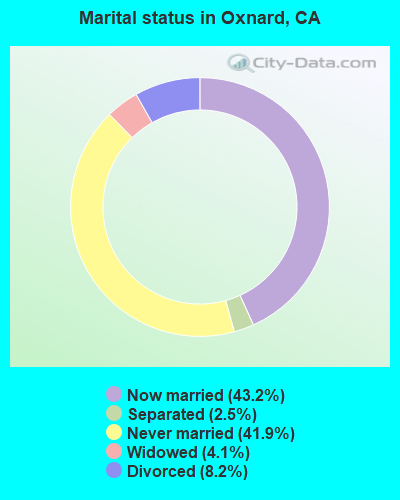
- Never married: 41.9%
- Now married: 43.2%
- Separated: 2.5%
- Widowed: 4.1%
- Divorced: 8.2%
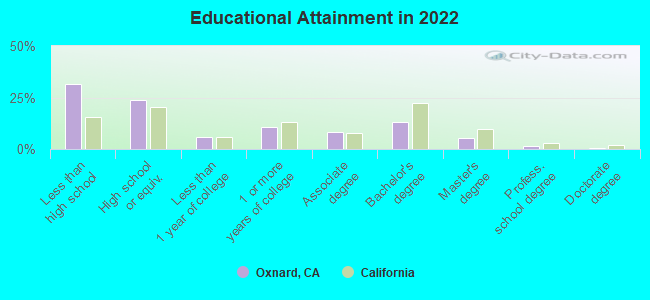
For population 25 years and over in Oxnard:
- High school or higher: 68.5%
- Bachelor's degree or higher: 20.4%
- Graduate or professional degree: 7.1%
- Unemployed: 7.5%
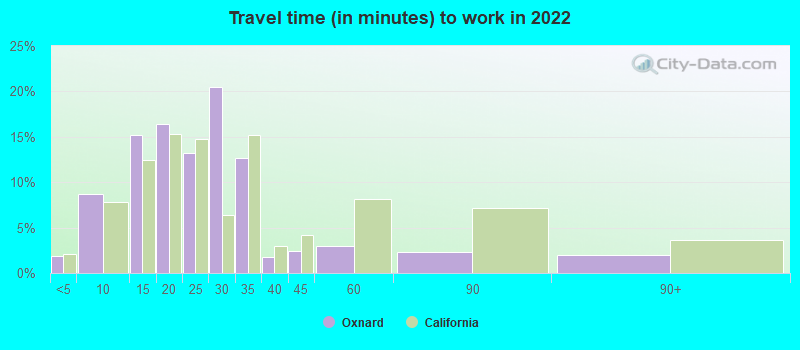
- Mean travel time to work (commute): 23.3 minutes
| Here: | 22.3 |
| California average: | 15.5 |
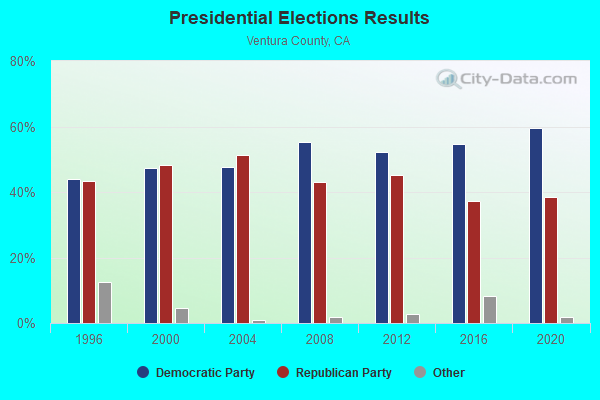
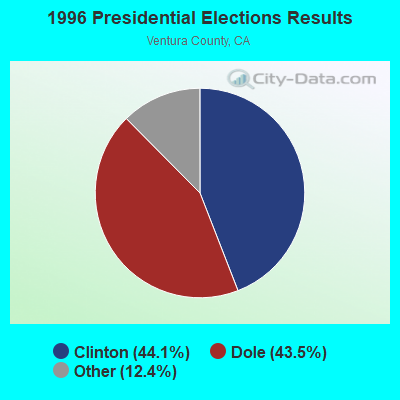
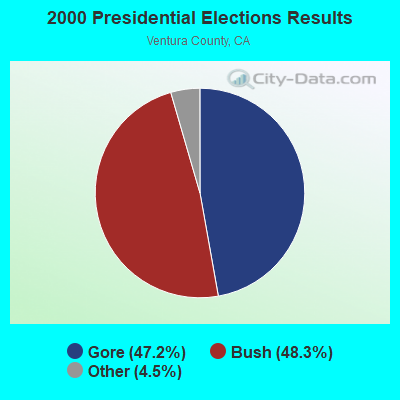
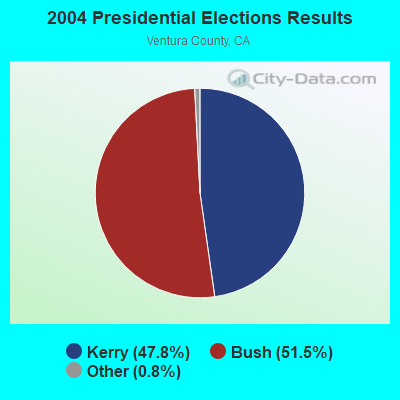
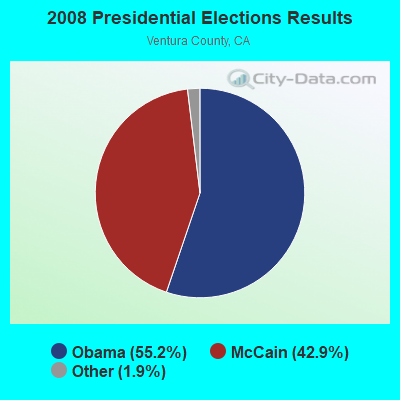
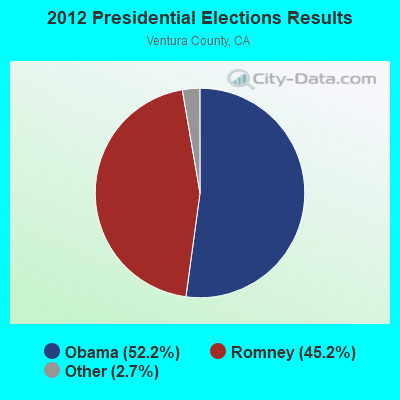
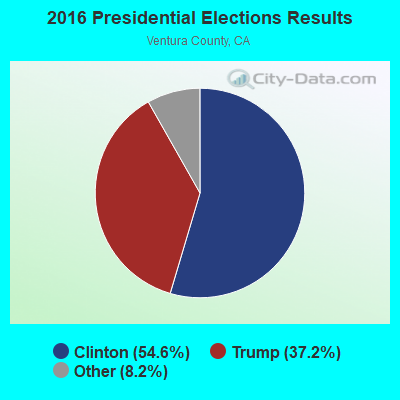
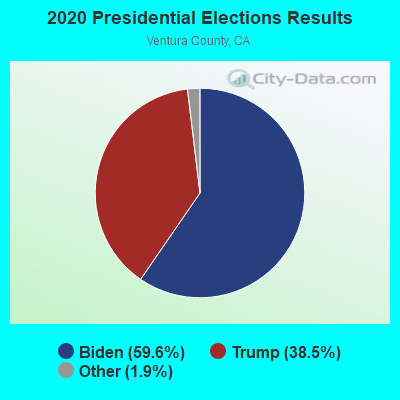
Graphs represent county-level data. Detailed 2008 Election Results
Neighborhoods in Oxnard:
(Oxnard, California Neighborhood Map)- Bartolo Square North neighborhood
- Bartolo Square South neighborhood
- Blackstock North neighborhood
- Blackstock South neighborhood
- Bryce Canyon North neighborhood
- Bryce Canyon South neighborhood
- Cabrillo neighborhood
- Cal-Gisler neighborhood
- Carriage Square neighborhood
- Central Community neighborhood
- Channel Islands neighborhood
- College Estates neighborhood
- College Park neighborhood
- Cypress neighborhood
- Del Norte Community neighborhood
- Diamond Bar neighborhood
- Downtown Oxnard (Downtown) neighborhood
- East Village neighborhood
- El Rio neighborhood
- El Rio West neighborhood
- Five Points Northeast neighborhood
- Fremont North neighborhood
- Fremont South neighborhood
- Golf Course neighborhood
- Hill Street neighborhood
- Hobson Park East neighborhood
- Hobson Park West neighborhood
- Hollywood By The Sea neighborhood
- Kamala Park neighborhood
- La Colonia Barrio (La Colonia) neighborhood
- Lemonwood/Eastmont neighborhood
- Mar Vista neighborhood
- Marina West neighborhood
- Northeast Community neighborhood
- Northwest Community neighborhood
- Nyeland Acres neighborhood
- Orchard neighborhood
- Ormond Beach neighborhood
- Oxnard Airport neighborhood
- Oxnard Dunes neighborhood
- Oxnard Pacific neighborhood
- Oxnard Shores neighborhood
- Pleasant Valley Estate neighborhood
- Pleasant Valley Village neighborhood
- Redwood neighborhood
- Rio Lindo neighborhood
- RiverPark neighborhood
- Rose Park neighborhood
- Sea Air neighborhood
- Sea View Estates neighborhood
- Sierra Linda neighborhood
- Silver Strand (Silver Strand Beach) neighborhood
- South Bank neighborhood
- South Central Community neighborhood
- South Winds neighborhood
- Southeast Community neighborhood
- Southwest Community neighborhood
- Strickland neighborhood
- Teal Club neighborhood
- Terrace Estates neighborhood
- Tierra Vista neighborhood
- Town Center neighborhood
- Via Marina neighborhood
- Villa Capri neighborhood
- West Village neighborhood
- Wilson neighborhood
- Windsor North River Ridge neighborhood
Religion statistics for Oxnard, CA (based on Ventura County data)
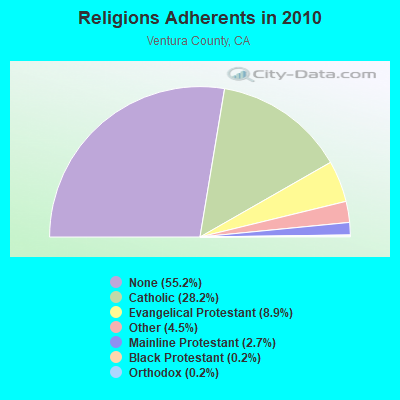
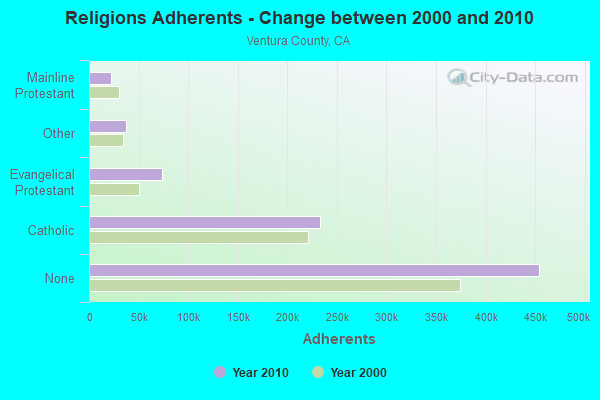
| Religion | Adherents | Congregations |
|---|---|---|
| Catholic | 232,571 | 20 |
| Evangelical Protestant | 73,341 | 268 |
| Other | 37,398 | 118 |
| Mainline Protestant | 22,006 | 65 |
| Black Protestant | 1,986 | 4 |
| Orthodox | 1,680 | 7 |
| None | 454,336 | - |
Food Environment Statistics:
| This county: | 1.97 / 10,000 pop. |
| California: | 2.14 / 10,000 pop. |
| This county: | 0.05 / 10,000 pop. |
| California: | 0.04 / 10,000 pop. |
| Ventura County: | 0.57 / 10,000 pop. |
| State: | 0.62 / 10,000 pop. |
| This county: | 1.69 / 10,000 pop. |
| California: | 1.49 / 10,000 pop. |
| Ventura County: | 7.28 / 10,000 pop. |
| State: | 7.42 / 10,000 pop. |
| Ventura County: | 7.4% |
| California: | 7.3% |
| Ventura County: | 23.1% |
| State: | 21.3% |
| This county: | 19.0% |
| California: | 17.9% |
Health and Nutrition:
| Oxnard: | 47.1% |
| California: | 49.4% |
| This city: | 47.4% |
| California: | 48.0% |
| This city: | 27.9 |
| State: | 28.1 |
| This city: | 22.9% |
| State: | 20.2% |
| Oxnard: | 10.3% |
| State: | 11.2% |
| Oxnard: | 6.7 |
| California: | 6.8 |
| Here: | 30.9% |
| California: | 31.5% |
| Oxnard: | 55.1% |
| State: | 56.4% |
| Here: | 81.7% |
| California: | 80.9% |
More about Health and Nutrition of Oxnard, CA Residents
| Local government employment and payroll (March 2022) | |||||
| Function | Full-time employees | Monthly full-time payroll | Average yearly full-time wage | Part-time employees | Monthly part-time payroll |
|---|---|---|---|---|---|
| Police Protection - Officers | 461 | $5,786,112 | $150,615 | 0 | $0 |
| Police - Other | 182 | $1,177,630 | $77,646 | 14 | $24,923 |
| Solid Waste Management | 141 | $1,177,272 | $100,193 | 22 | $74,619 |
| Firefighters | 126 | $1,589,782 | $151,408 | 0 | $0 |
| Financial Administration | 99 | $885,922 | $107,384 | 5 | $14,590 |
| Other and Unallocable | 92 | $754,721 | $98,442 | 2 | $5,825 |
| Parks and Recreation | 83 | $544,611 | $78,739 | 206 | $245,677 |
| Sewerage | 69 | $573,631 | $99,762 | 2 | $5,404 |
| Housing and Community Development (Local) | 60 | $504,051 | $100,810 | 1 | $111 |
| Water Supply | 59 | $464,296 | $94,433 | 0 | $0 |
| Streets and Highways | 58 | $492,137 | $101,821 | 1 | $1,021 |
| Other Government Administration | 23 | $195,723 | $102,116 | 0 | $0 |
| Local Libraries | 23 | $140,298 | $73,199 | 2 | $1,481 |
| Judicial and Legal | 12 | $153,111 | $153,111 | 0 | $0 |
| Welfare | 12 | $137,053 | $137,053 | 1 | $2,089 |
| Fire - Other | 11 | $107,206 | $116,952 | 1 | $141 |
| Totals for Government | 1,511 | $14,683,556 | $116,613 | 257 | $375,883 |
Oxnard government finances - Expenditure in 2021 (per resident):
- Construction - Regular Highways: $15,667,000 ($78.17)
Housing and Community Development: $2,676,000 ($13.35)
Parks and Recreation: $1,898,000 ($9.47)
General - Other: $1,846,000 ($9.21)
Police Protection: $1,491,000 ($7.44)
- Current Operations - Police Protection: $77,038,000 ($384.39)
General - Other: $60,664,000 ($302.69)
Housing and Community Development: $45,497,000 ($227.01)
Water Utilities: $44,261,000 ($220.85)
Local Fire Protection: $36,736,000 ($183.30)
Parks and Recreation: $29,172,000 ($145.56)
Sewerage: $22,536,000 ($112.45)
Central Staff Services: $18,950,000 ($94.55)
Health - Other: $13,138,000 ($65.55)
Regular Highways: $6,733,000 ($33.60)
Protective Inspection and Regulation - Other: $5,346,000 ($26.67)
Transit Utilities: $4,361,000 ($21.76)
Libraries: $3,831,000 ($19.12)
- General - Interest on Debt: $25,881,000 ($129.14)
- Water Utilities - Interest on Debt: $6,389,000 ($31.88)
Oxnard government finances - Revenue in 2021 (per resident):
- Charges - Other: $105,341,000 ($525.61)
Sewerage: $48,022,000 ($239.61)
Housing and Community Development: $30,915,000 ($154.25)
Parks and Recreation: $6,551,000 ($32.69)
Regular Highways: $751,000 ($3.75)
- Federal Intergovernmental - Other: $15,328,000 ($76.48)
Housing and Community Development: $3,277,000 ($16.35)
- Local Intergovernmental - Housing and Community Development: $72,000 ($0.36)
- Miscellaneous - General Revenue - Other: $14,352,000 ($71.61)
Special Assessments: $11,976,000 ($59.76)
Fines and Forfeits: $1,924,000 ($9.60)
Interest Earnings: $1,803,000 ($9.00)
Donations From Private Sources: $16,000 ($0.08)
Sale of Property: $8,000 ($0.04)
- Revenue - Water Utilities: $62,228,000 ($310.50)
- State Intergovernmental - Other: $13,391,000 ($66.82)
Highways: $8,354,000 ($41.68)
General Local Government Support: $324,000 ($1.62)
- Tax - Property: $81,201,000 ($405.16)
General Sales and Gross Receipts: $37,961,000 ($189.41)
Other: $29,963,000 ($149.50)
Other License: $6,743,000 ($33.65)
Occupation and Business License - Other: $5,965,000 ($29.76)
Public Utilities Sales: $4,287,000 ($21.39)
Other Selective Sales: $4,267,000 ($21.29)
Documentary and Stock Transfer: $911,000 ($4.55)
Oxnard government finances - Debt in 2021 (per resident):
- Long Term Debt - Beginning Outstanding - Unspecified Public Purpose: $796,579,000 ($3974.65)
Outstanding Unspecified Public Purpose: $703,662,000 ($3511.02)
Retired Unspecified Public Purpose: $53,013,000 ($264.52)
Issue, Unspecified Public Purpose: $-39,905,000 ($-199.11)
Oxnard government finances - Cash and Securities in 2021 (per resident):
- Bond Funds - Cash and Securities: $32,098,000 ($160.16)
- Other Funds - Cash and Securities: $214,970,000 ($1072.62)
- Sinking Funds - Cash and Securities: $6,760,000 ($33.73)
4.96% of this county's 2021 resident taxpayers lived in other counties in 2020 ($110,211 average adjusted gross income)
| Here: | 4.96% |
| California average: | 5.19% |
0.03% of residents moved from foreign countries ($345 average AGI)
Ventura County: 0.03% California average: 0.03%
Top counties from which taxpayers relocated into this county between 2020 and 2021:
| from Los Angeles County, CA | |
| from Santa Barbara County, CA | |
| from Orange County, CA |
5.51% of this county's 2020 resident taxpayers moved to other counties in 2021 ($95,405 average adjusted gross income)
| Here: | 5.51% |
| California average: | 6.14% |
0.02% of residents moved to foreign countries ($247 average AGI)
Ventura County: 0.02% California average: 0.02%
Top counties to which taxpayers relocated from this county between 2020 and 2021:
| to Los Angeles County, CA | |
| to San Diego County, CA | |
| to Santa Barbara County, CA |
| Businesses in Oxnard, CA | ||||
| Name | Count | Name | Count | |
|---|---|---|---|---|
| 24 Hour Fitness | 1 | LA Fitness | 1 | |
| 7-Eleven | 6 | La-Z-Boy | 1 | |
| 99 Cents Only Stores | 1 | Lane Furniture | 1 | |
| AT&T | 1 | Little Caesars Pizza | 3 | |
| Ace Hardware | 1 | Marriott | 2 | |
| Albertsons | 1 | Marshalls | 1 | |
| Audi | 1 | MasterBrand Cabinets | 5 | |
| AutoZone | 2 | McDonald's | 7 | |
| Baja Fresh Mexican Grill | 1 | Men's Wearhouse | 1 | |
| Bally Total Fitness | 1 | Motherhood Maternity | 1 | |
| Baskin-Robbins | 2 | New Balance | 2 | |
| Bath & Body Works | 1 | Nike | 13 | |
| Bed Bath & Beyond | 1 | Nissan | 1 | |
| Best Western | 1 | Nordstrom | 1 | |
| Blockbuster | 1 | Office Depot | 1 | |
| Budget Car Rental | 1 | OfficeMax | 1 | |
| Burger King | 3 | Old Navy | 1 | |
| CVS | 2 | Olive Garden | 1 | |
| Carl\s Jr. | 2 | Outback | 1 | |
| Casual Male XL | 1 | Outback Steakhouse | 1 | |
| Catherines | 1 | Panda Express | 2 | |
| Chick-Fil-A | 1 | Papa John's Pizza | 2 | |
| Circle K | 7 | Payless | 3 | |
| Cold Stone Creamery | 1 | PetSmart | 1 | |
| Costco | 1 | Pizza Hut | 2 | |
| Curves | 1 | Popeyes | 2 | |
| DHL | 3 | Quiznos | 3 | |
| Dairy Queen | 1 | RadioShack | 2 | |
| Decora Cabinetry | 2 | Red Lobster | 1 | |
| Dennys | 1 | Rite Aid | 2 | |
| Discount Tire | 1 | Sam's Club | 1 | |
| Domino's Pizza | 3 | Sprint Nextel | 3 | |
| El Pollo Loco | 3 | Staples | 1 | |
| FedEx | 12 | Starbucks | 7 | |
| Firestone Complete Auto Care | 1 | T-Mobile | 6 | |
| Ford | 1 | T.G.I. Driday's | 1 | |
| GNC | 4 | T.J.Maxx | 1 | |
| GameStop | 2 | Taco Bell | 3 | |
| H&R Block | 6 | Target | 1 | |
| Hilton | 2 | The Room Place | 1 | |
| Home Depot | 1 | Toyota | 1 | |
| HomeTown Buffet | 1 | Toys"R"Us | 1 | |
| Honda | 1 | U-Haul | 3 | |
| IHOP | 2 | UPS | 13 | |
| Jack In The Box | 4 | Verizon Wireless | 2 | |
| Jamba Juice | 1 | Vons | 3 | |
| Jones New York | 1 | Walgreens | 4 | |
| Just Tires | 1 | Walmart | 1 | |
| KFC | 2 | Wendy's | 2 | |
| Kroger | 2 | Wet Seal | 1 | |
Strongest AM radio stations in Oxnard:
- KVTA (1520 AM; 10 kW; PORT HUENEME, CA; Owner: GOLD COAST BROADCASTING LLC)
- KUNX (1590 AM; 5 kW; VENTURA, CA; Owner: GOLD COAST BROADCASTING LLC)
- KOXR (910 AM; 5 kW; OXNARD, CA; Owner: LAZER BROADCASTING CORPORATION)
- KACD (850 AM; 25 kW; THOUSAND OAKS, CA; Owner: CITICASTERS LICENSES, L.P.)
- KSPN (710 AM; 50 kW; LOS ANGELES, CA; Owner: KABC-AM RADIO, INC.)
- KVEN (1450 AM; 1 kW; VENTURA, CA; Owner: CUMULUS LICENSING CORP.)
- KLAC (570 AM; 50 kW; LOS ANGELES, CA; Owner: AMFM RADIO LICENSES, L.L.C.)
- KNX (1070 AM; 50 kW; LOS ANGELES, CA; Owner: INFINITY BROADCASTING OPERATIONS, INC.)
- KFWB (980 AM; 50 kW; LOS ANGELES, CA; Owner: INFINITY BROADCASTING OPERATIONS, INC.)
- KFI (640 AM; 50 kW; LOS ANGELES, CA; Owner: CAPSTAR TX LIMITED PARTNERSHIP)
- KIRN (670 AM; 35 kW; SIMI VALLEY, CA; Owner: LOTUS OXNARD CORP.)
- KSUR (1260 AM; 25 kW; BEVERLY HILLS, CA)
- KBLA (1580 AM; 50 kW; SANTA MONICA, CA)
Strongest FM radio stations in Oxnard:
- KSSC (107.1 FM; VENTURA, CA; Owner: ENTRAVISION HOLDINGS, LLC)
- KDAR (98.3 FM; OXNARD, CA; Owner: ATEP RADIO, INC.)
- KCZN (96.7 FM; SANTA PAULA, CA; Owner: LAZER BROADCASTING CORPORATION)
- KMLA (103.7 FM; EL RIO, CA; Owner: GOLD COAST RADIO, L.L.C.)
- K272DI (102.3 FM; FILLMORE, CA; Owner: SANTA MONICA COMMUNITY COLLEGE DIST.)
- KBBY-FM (95.1 FM; VENTURA, CA; Owner: CUMULUS LICENSING CORP.)
- KCAQ (104.7 FM; OXNARD, CA; Owner: GOLD COAST BROADCASTING LLC)
- KCRU (89.1 FM; OXNARD, CA; Owner: SANTA MONICA COMMUNITY COLLEGE DISTRICT)
- KOCP (95.9 FM; CAMARILLO, CA; Owner: GOLD COAST BROADCASTING LLC)
- KFYV (105.5 FM; OJAI, CA; Owner: GOLD COAST BROADCASTING LLC)
- K271AC (102.1 FM; OJAI, CA; Owner: SANTA MONICA COMMUNITY COLLEGE DIST.)
- KHAY (100.7 FM; VENTURA, CA; Owner: CUMULUS LICENSING CORP.)
- KLFH (89.5 FM; OJAI, CA; Owner: SHEPHERD COMMUNICATIONS, INC.)
- KMRO (90.3 FM; CAMARILLO, CA; Owner: THE ASSOCIATION FOR COMMUNITY EDUCATION, INC.)
- KCPB (91.1 FM; THOUSAND OAKS, CA; Owner: UNIVERSITY OF SOUTHERN CALIFORNIA)
- K254AH (98.7 FM; ISLA VISTA, CA; Owner: PACIFICA FOUNDATION, INC.)
- K210CH (89.9 FM; OAK VIEW, CA; Owner: LIFE ON THE WAY COMMUNICATIONS, INC.)
- KXLM (102.9 FM; OXNARD, CA; Owner: KEXT BROADCASTERS, INC.)
- K293AG (106.5 FM; TAFT, CA; Owner: CENTRO CRISTIANO DE FE, INC.)
- KKBT (100.3 FM; LOS ANGELES, CA; Owner: RADIO ONE LICENSES, LLC)
TV broadcast stations around Oxnard:
- KTRO-LP (Channel 50; LANCASTER, CA; Owner: ROBERT D. ADELMAN)
- KADY-TV (Channel 63; OXNARD, CA; Owner: BILTMORE BROADCASTING, L.L.C.)
- KJLA (Channel 57; VENTURA, CA; Owner: KJLA, LLC)
- K25GV (Channel 25; OXNARD, CA; Owner: CAPITAL BROADCASTING CORP.)
- National Bridge Inventory (NBI) Statistics
- 66Number of bridges
- 1,401ft / 427mTotal length
- $24,609,000Total costs
- 2,028,795Total average daily traffic
- 133,222Total average daily truck traffic
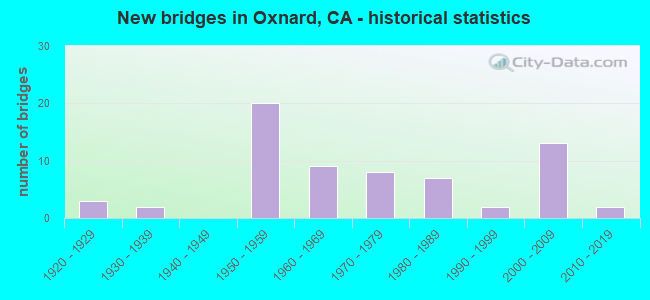
- New bridges - historical statistics
- 31920-1929
- 21930-1939
- 201950-1959
- 91960-1969
- 81970-1979
- 71980-1989
- 21990-1999
- 132000-2009
- 22010-2019
FCC Registered Antenna Towers: 347 (See the full list of FCC Registered Antenna Towers)
FCC Registered Private Land Mobile Towers: 15 (See the full list of FCC Registered Private Land Mobile Towers in Oxnard, CA)
FCC Registered Broadcast Land Mobile Towers: 92 (See the full list of FCC Registered Broadcast Land Mobile Towers)
FCC Registered Microwave Towers: 127 (See the full list of FCC Registered Microwave Towers in this town)
FCC Registered Paging Towers: 18 (See the full list of FCC Registered Paging Towers)
FCC Registered Maritime Coast & Aviation Ground Towers: 22 (See the full list of FCC Registered Maritime Coast & Aviation Ground Towers)
FCC Registered Amateur Radio Licenses: 681 (See the full list of FCC Registered Amateur Radio Licenses in Oxnard)
FAA Registered Aircraft Manufacturers and Dealers: 7 (See the full list of FAA Registered Manufacturers and Dealers in Oxnard)
FAA Registered Aircraft: 100 (See the full list of FAA Registered Aircraft)
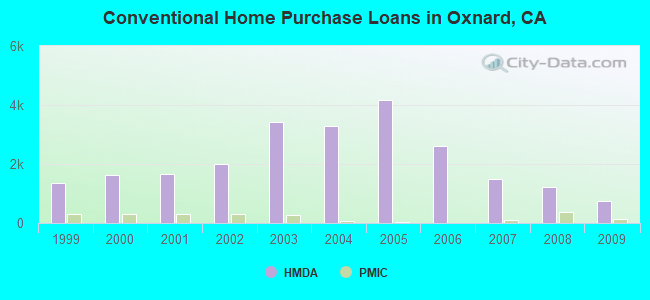
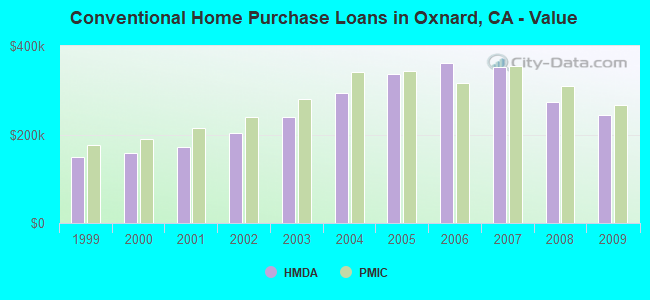
| Home Mortgage Disclosure Act Aggregated Statistics For Year 2009 (Based on 25 full and 8 partial tracts) | ||||||||||||||
| A) FHA, FSA/RHS & VA Home Purchase Loans | B) Conventional Home Purchase Loans | C) Refinancings | D) Home Improvement Loans | E) Loans on Dwellings For 5+ Families | F) Non-occupant Loans on < 5 Family Dwellings (A B C & D) | G) Loans On Manufactured Home Dwelling (A B C & D) | ||||||||
|---|---|---|---|---|---|---|---|---|---|---|---|---|---|---|
| Number | Average Value | Number | Average Value | Number | Average Value | Number | Average Value | Number | Average Value | Number | Average Value | Number | Average Value | |
| LOANS ORIGINATED | 875 | $272,074 | 762 | $244,055 | 1,552 | $263,751 | 77 | $159,321 | 5 | $760,728 | 439 | $271,295 | 17 | $79,571 |
| APPLICATIONS APPROVED, NOT ACCEPTED | 77 | $257,006 | 104 | $273,434 | 163 | $281,667 | 12 | $97,242 | 0 | $0 | 49 | $302,021 | 4 | $82,160 |
| APPLICATIONS DENIED | 237 | $260,316 | 210 | $223,279 | 700 | $297,477 | 45 | $102,705 | 0 | $0 | 174 | $278,602 | 23 | $76,770 |
| APPLICATIONS WITHDRAWN | 170 | $271,656 | 158 | $242,984 | 407 | $296,871 | 32 | $192,895 | 1 | $1,636,000 | 94 | $289,435 | 4 | $53,025 |
| FILES CLOSED FOR INCOMPLETENESS | 45 | $248,116 | 29 | $256,789 | 122 | $289,619 | 8 | $227,738 | 0 | $0 | 23 | $258,696 | 2 | $134,565 |
Detailed mortgage data for all 33 tracts in Oxnard, CA
| Private Mortgage Insurance Companies Aggregated Statistics For Year 2009 (Based on 24 full and 7 partial tracts) | ||||||
| A) Conventional Home Purchase Loans | B) Refinancings | C) Non-occupant Loans on < 5 Family Dwellings (A & B) | ||||
|---|---|---|---|---|---|---|
| Number | Average Value | Number | Average Value | Number | Average Value | |
| LOANS ORIGINATED | 123 | $265,883 | 13 | $286,889 | 3 | $260,493 |
| APPLICATIONS APPROVED, NOT ACCEPTED | 54 | $258,932 | 12 | $338,628 | 0 | $0 |
| APPLICATIONS DENIED | 14 | $252,940 | 9 | $372,554 | 3 | $380,293 |
| APPLICATIONS WITHDRAWN | 8 | $234,842 | 8 | $304,456 | 0 | $0 |
| FILES CLOSED FOR INCOMPLETENESS | 12 | $291,277 | 0 | $0 | 0 | $0 |
2005 - 2018 National Fire Incident Reporting System (NFIRS) incidents
- Fire incident types reported to NFIRS in Oxnard, CA
- 1,23242.9%Outside Fires
- 1,09438.1%Structure Fires
- 36212.6%Mobile Property/Vehicle Fires
- 1856.4%Other
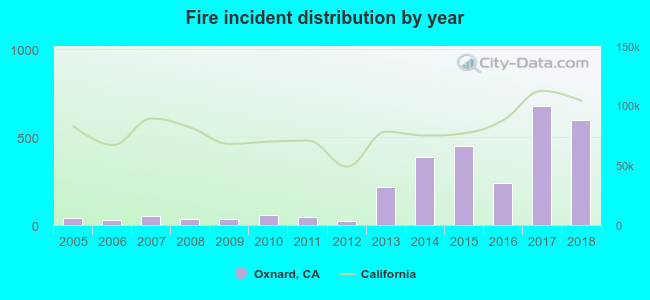 According to the data from the years 2005 - 2018 the average number of fires per year is 205. The highest number of fire incidents - 679 took place in 2017, and the least - 22 in 2012. The data has an increasing trend.
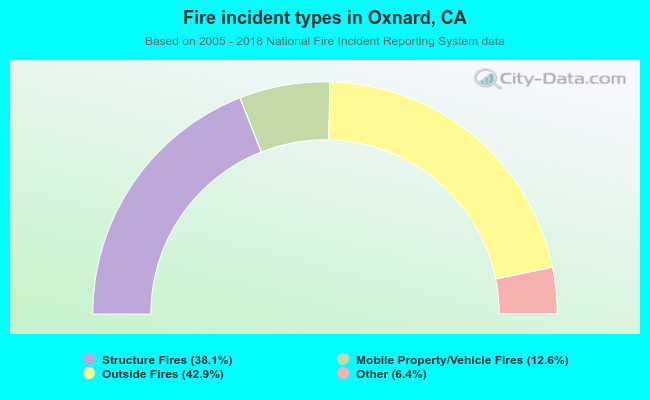 When looking into fire subcategories, the most incidents belonged to: Outside Fires (42.9%), and Structure Fires (38.1%).
Fire-safe hotels and motels in Oxnard, California:
- Courtyard By Marriott Oxnard/Ventura, 600 E Esplanade Dr, Oxnard, California 93036 , Phone: (805) 988-3600, Fax: (805) 485-2061
- Embassy Suites Mandalay Beach Resort, 2101 Mandalay Beach Rd, Oxnard, California 93035 , Phone: (805) 984-2500, Fax: (805) 984-6470
- Residence Inn By Marriott Oxnard, 2101 W Vineyard Ave, Oxnard, California 93036 , Phone: (805) 278-2200, Fax: (805) 988-9230
- Vagabond Inn, 1245 N Oxnard Blvd, Oxnard, California 93030 , Phone: (805) 983-0251, Fax: (805) 988-9638
- Hilton Garden Inn Oxnard/Camarillo, 2000 Solar Dr, Oxnard, California 93036 , Phone: (805) 983-8600, Fax: (805) 983-3600
- Channel Islands Harbor Hampton Inn, 3231 Peninsula Rd, Oxnard, California 93035 , Phone: (805) 985-1100, Fax: (805) 985-1120
- Comfort Inn Oxnard, 1001 E Channel Islands Blvd, Oxnard, California 93033 , Phone: (805) 201-6000, Fax: (805) 486-1374
- Grandstay Residential Suites Hotel, 2211 E Gonzales Rd, Oxnard, California 93036 , Phone: (805) 983-6808, Fax: (805) 983-6376
- Homewood Suites, Oxnard, 1950 Solar Dr, Oxnard, California 93036 , Phone: (805) 288-3600, Fax: (805) 288-3300
| Most common first names in Oxnard, CA among deceased individuals | ||
| Name | Count | Lived (average) |
|---|---|---|
| John | 455 | 73.5 years |
| Mary | 406 | 78.0 years |
| William | 368 | 72.7 years |
| James | 326 | 71.0 years |
| Robert | 318 | 68.5 years |
| Maria | 292 | 76.0 years |
| George | 233 | 74.6 years |
| Jose | 231 | 69.2 years |
| Charles | 213 | 73.6 years |
| Frank | 185 | 75.6 years |
| Most common last names in Oxnard, CA among deceased individuals | ||
| Last name | Count | Lived (average) |
|---|---|---|
| Garcia | 179 | 73.0 years |
| Lopez | 162 | 72.9 years |
| Martinez | 149 | 69.8 years |
| Smith | 144 | 73.4 years |
| Johnson | 130 | 72.0 years |
| Hernandez | 118 | 72.3 years |
| Ramirez | 118 | 73.7 years |
| Rodriguez | 107 | 70.6 years |
| Williams | 94 | 72.9 years |
| Gonzalez | 89 | 69.8 years |
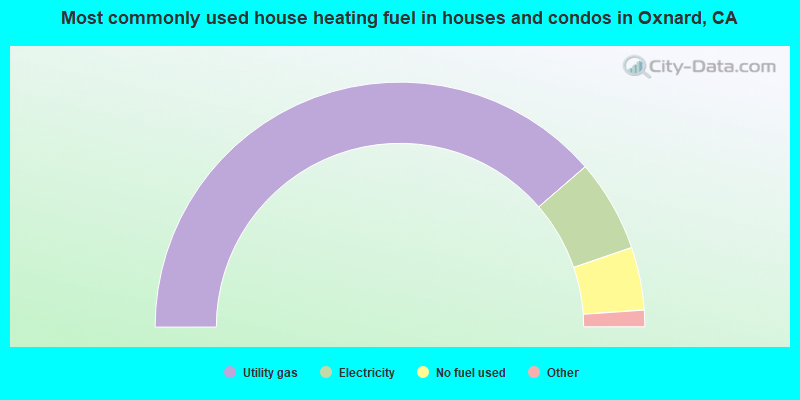
- 77.3%Utility gas
- 12.2%Electricity
- 8.3%No fuel used
- 1.2%Bottled, tank, or LP gas
- 0.4%Solar energy
- 0.4%Wood
- 0.1%Fuel oil, kerosene, etc.
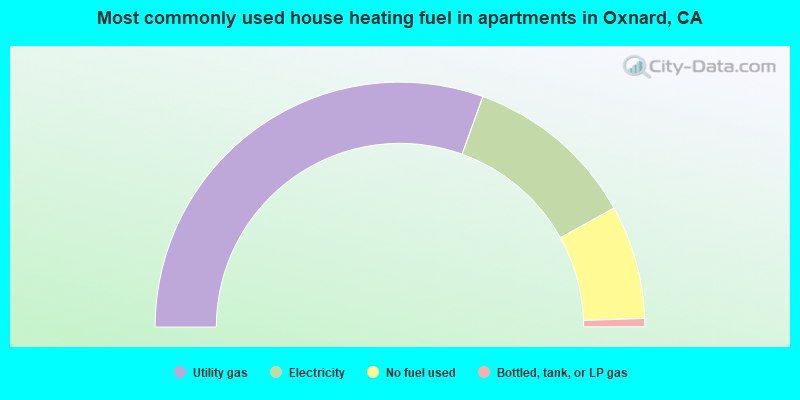
- 60.9%Utility gas
- 22.8%Electricity
- 15.0%No fuel used
- 1.1%Bottled, tank, or LP gas
Oxnard compared to California state average:
- Unemployed percentage below state average.
- Black race population percentage below state average.
- Hispanic race population percentage above state average.
Oxnard, CA compared to other similar cities:
Oxnard on our top lists:
- #6 on the list of "Top 101 cities with largest percentage of males in occupations: farming, fishing, and forestry occupations (population 50,000+)"
- #6 on the list of "Top 101 cities with largest percentage of females in occupations: farming, fishing, and forestry occupations (population 50,000+)"
- #8 on the list of "Top 101 cities with largest percentage of males in industries: agriculture, forestry, fishing and hunting (population 50,000+)"
- #9 on the list of "Top 101 cities with largest percentage of females in industries: agriculture, forestry, fishing and hunting (population 50,000+)"
- #19 on the list of "Top 100 low-educated but high-earning cities (pop. 50,000+)"
- #21 on the list of "Top 101 cities with the highest percentage of family households, population 100,000+"
- #22 on the list of "Top 101 cities with the most cars per house, population 50,000+"
- #29 on the list of "Top 101 cities with the lowest number of rapes per 100,000 residents (population 50,000+)"
- #33 on the list of "Top 100 least-educated cities (pop. 50,000+)"
- #34 on the list of "Top 101 cities with the lowest average snowfall in a year (population 50,000+)"
- #40 on the list of "Top 101 cities with the smallest sunshine amount differences during a year (population 50,000+)"
- #44 on the list of "Top 101 cities with the lowest percentage of English-only speaking households, population 50,000+"
- #47 on the list of "Top 101 cities with largest percentage of females in industries: wholesale trade (population 50,000+)"
- #50 on the list of "Top 101 cities with the highest ratio of murders to rapes between 2002 and 2012 (population 50,000+)"
- #51 on the list of "Top 100 cities with the largest percentage of males (pop. 50,000+)"
- #57 on the list of "Top 101 cities with the least people having Master's or Doctorate degrees (population 50,000+)"
- #63 on the list of "Top 101 cities with largest percentage of males in industries: wholesale trade (population 50,000+)"
- #73 on the list of "Top 101 cities with the smallest percentage of high school students in private schools (3,000+ students)"
- #76 on the list of "Top 101 cities with the lowest average wind speeds (population 50,000+)"
- #78 on the list of "Top 101 cities with largest percentage of females in occupations: material moving occupations (population 50,000+)"
- #54 (93033) on the list of "Top 101 zip codes with the largest percentage of taxpayers using paid preparers for 2012 taxes (pop 5,000+)"
- #74 (93003) on the list of "Top 101 zip codes with the most offices of physicians in 2005"
- #16 on the list of "Top 101 counties with the highest lead air pollution readings in 2012 (µg/m3)"
- #18 on the list of "Top 101 counties with the lowest lead air pollution readings in 2012 (µg/m3)"
- #38 on the list of "Top 101 counties with the highest Particulate Matter (PM10) Annual air pollution readings in 2012 (µg/m3)"
- #44 on the list of "Top 101 counties with the highest surface withdrawal of fresh water for public supply (pop. 50,000+)"
- #44 on the list of "Top 101 counties with the most Other congregations (pop. 50,000+)"

|
|
Total of 521 patent applications in 2008-2024.