Estimated zip code population in 2022: 58,025 Zip code population in 2010: 59,372 Zip code population in 2000: 79,717
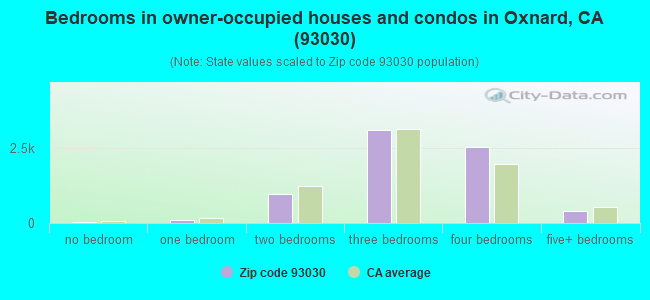
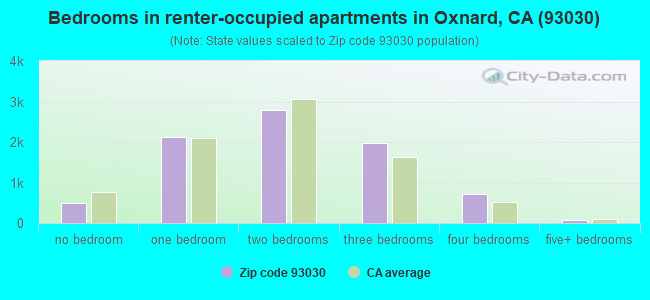
Houses and condos: 16,046 Renter-occupied apartments: 8,171
% of renters here:
53%
State:
44%
March 2022 cost of living index in zip code 93030: 92.3 (less than average, U.S. average is 100)
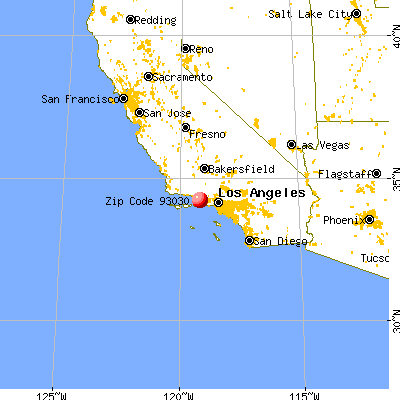
Land area: 13.9 sq. mi. Water area: 0.0 sq. mi.
Population density: 4,185 people per square mile
(average).
OSM Map
General Map
Google Map
MSN Map
OSM Map
General Map
Google Map
MSN Map
OSM Map
General Map
Google Map
MSN Map
OSM Map
General Map
Google Map
MSN Map
Please wait while loading the map...
Real estate property taxes paid for housing units in 2022:
This zip code:
0.6% ($4,094)
California:
0.7% ($4,831)
Median real estate property taxes paid for housing units with mortgages in 2022: $4,431 (0.7%) Median real estate property taxes paid for housing units with no mortgage in 2022: $2,664 (0.5%)
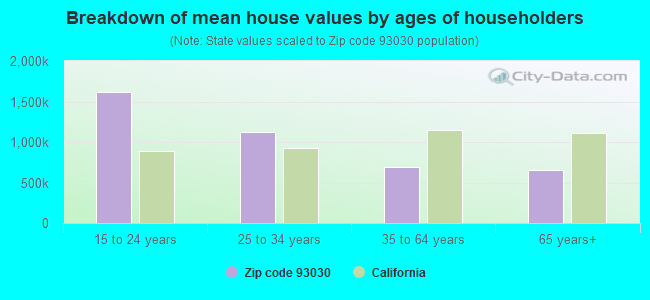
Estimated median house/condo value in 2022: $656,504
93030:
$656,504
California:
$715,900
According to our research of California and other state lists, there were 72 registered sex offenders living in 93030 zip code as of April 27, 2024. The ratio of all residents to sex offenders in zip code 93030 is 853 to 1. The ratio of registered sex offenders to all residents in this zip code is near the state average.
Median resident age:
This zip code:
34.1 years
California median age:
37.9 years
Average household size:
This zip code:
3.7 people
California:
2.8 people
Averages for the 2020 tax year for zip code 93030, filed in 2021:
Average Adjusted Gross Income (AGI) in 2020: $48,408 (Individual Income Tax Returns)
Here:
$48,408
State:
$95,910
Salary/wage: $44,218 (reported on 88.8% of returns)
Here:
$44,218
State:
$77,331
(% of AGI for various income ranges: 1653.3% for AGIs below $25k, 4756.6% for AGIs $25k-50k, 8116.1% for AGIs $50k-75k, 11776.9% for AGIs $75k-100k, 21047.5% for AGIs $100k-200k, 68954.2% for AGIs over 200k)
Taxable interest for individuals: $543 (reported on 21.5% of returns)
This zip code:
$543
California:
$2,294
(% of AGI for various income ranges: 3.9% for AGIs below $25k, 6.5% for AGIs $25k-50k, 16.7% for AGIs $50k-75k, 27.3% for AGIs $75k-100k, 92.3% for AGIs $100k-200k, 536.7% for AGIs over 200k)
Ordinary dividends: $2,588 (reported on 6.4% of returns)
Here:
$2,588
State:
$10,949
(% of AGI for various income ranges: 4.6% for AGIs below $25k, 8.0% for AGIs $25k-50k, 22.4% for AGIs $50k-75k, 50.9% for AGIs $75k-100k, 121.3% for AGIs $100k-200k, 854.2% for AGIs over 200k)
Net capital gain/loss in AGI: +$6,840 (reported on 6.7% of returns)
Here:
+$6,840
State:
+$49,306
(% of AGI for various income ranges: 1.5% for AGIs below $25k, 7.4% for AGIs $25k-50k, 30.8% for AGIs $50k-75k, 72.8% for AGIs $75k-100k, 234.0% for AGIs $100k-200k, 6170.8% for AGIs over 200k)
Profit/loss from business: +$9,783 (reported on 11.8% of returns)
Here:
+$9,783
State:
+$15,671
(% of AGI for various income ranges: 134.4% for AGIs below $25k, 124.7% for AGIs $25k-50k, 186.4% for AGIs $50k-75k, 327.8% for AGIs $75k-100k, 398.8% for AGIs $100k-200k, 2256.7% for AGIs over 200k)
Taxable individual retirement arrangement distribution: $15,026 (reported on 2.8% of returns)
93030:
$15,026
California:
$23,505
(% of AGI for various income ranges: 15.3% for AGIs below $25k, 19.0% for AGIs $25k-50k, 67.8% for AGIs $50k-75k, 118.5% for AGIs $75k-100k, 374.0% for AGIs $100k-200k, 1155.0% for AGIs over 200k)
Total itemized deductions: $33,127 (reported on 9.5% of returns)
Here:
$33,127
State:
$39,517
(% of AGI for various income ranges: 43.6% for AGIs below $25k, 121.2% for AGIs $25k-50k, 475.0% for AGIs $50k-75k, 1049.8% for AGIs $75k-100k, 2413.1% for AGIs $100k-200k, 16987.5% for AGIs over 200k)
Charity contributions: $4,186 (reported on 7.8% of returns)
Here:
$4,186
State:
$12,598
(% of AGI for various income ranges: 2.3% for AGIs below $25k, 9.6% for AGIs $25k-50k, 41.4% for AGIs $50k-75k, 109.3% for AGIs $75k-100k, 302.4% for AGIs $100k-200k, 1600.8% for AGIs over 200k)
Taxes paid: $8,583 (reported on 9.5% of returns)
93030:
$8,583
State:
$8,807
(% of AGI for various income ranges: 9.1% for AGIs below $25k, 31.0% for AGIs $25k-50k, 138.3% for AGIs $50k-75k, 331.3% for AGIs $75k-100k, 757.4% for AGIs $100k-200k, 2140.0% for AGIs over 200k)
Earned income credit: $2,205 (reported on 17.6% of returns)
Here:
$2,205
State:
$2,074
(% of AGI for various income ranges: 102.9% for AGIs below $25k, 78.6% for AGIs $25k-50k, 1.3% for AGIs $50k-75k)
Percentage of individuals using paid preparers for their 2020 taxes: 92.6%
Here:
93%
State:
92%
(% for various income ranges: 91.2% for AGIs below $25k, 92.9% for AGIs $25k-50k, 94.1% for AGIs $50k-75k, 94.0% for AGIs $75k-100k, 92.8% for AGIs $100k-200k, 95.2% for AGIs over 200k)
Averages for the 2012 tax year for zip code 93030, filed in 2013:
Average Adjusted Gross Income (AGI) in 2012: $38,873 (Individual Income Tax Returns)
Here:
$38,873
State:
$72,726
Salary/wage: $35,501 (reported on 90.8% of returns)
Here:
$35,501
State:
$59,079
(% of AGI for various income ranges: 86.5% for AGIs below $25k, 89.5% for AGIs $25k-50k, 84.2% for AGIs $50k-75k, 83.1% for AGIs $75k-100k, 80.7% for AGIs $100k-200k, 49.9% for AGIs over 200k)
Taxable interest for individuals: $737 (reported on 20.7% of returns)
This zip code:
$737
California:
$2,146
(% of AGI for various income ranges: 0.2% for AGIs below $25k, 0.2% for AGIs $25k-50k, 0.4% for AGIs $50k-75k, 0.5% for AGIs $75k-100k, 0.3% for AGIs $100k-200k, 1.9% for AGIs over 200k)
Ordinary dividends: $4,793 (reported on 5.6% of returns)
Here:
$4,793
State:
$9,308
(% of AGI for various income ranges: 0.2% for AGIs below $25k, 0.1% for AGIs $25k-50k, 0.5% for AGIs $50k-75k, 0.5% for AGIs $75k-100k, 0.5% for AGIs $100k-200k, 6.1% for AGIs over 200k)
Net capital gain/loss in AGI: +$3,440 (reported on 4.6% of returns)
Here:
+$3,440
State:
+$30,460
(% of AGI for various income ranges: 0.2% for AGIs $75k-100k, 0.3% for AGIs $100k-200k, 5.0% for AGIs over 200k)
Profit/loss from business: +$12,513 (reported on 10.8% of returns)
Here:
+$12,513
State:
+$17,064
(% of AGI for various income ranges: 6.3% for AGIs below $25k, 3.1% for AGIs $25k-50k, 2.5% for AGIs $50k-75k, 1.8% for AGIs $75k-100k, 3.0% for AGIs $100k-200k, 5.1% for AGIs over 200k)
Taxable individual retirement arrangement distribution: $13,628 (reported on 3.0% of returns)
93030:
$13,628
California:
$19,557
(% of AGI for various income ranges: 0.4% for AGIs below $25k, 0.5% for AGIs $25k-50k, 1.3% for AGIs $50k-75k, 1.3% for AGIs $75k-100k, 1.6% for AGIs $100k-200k, 2.0% for AGIs over 200k)
Self-employment retirement plans: $13,775 (reported on 0.2% of returns)
93030:
$13,775
California:
$24,530
Total itemized deductions: $24,986 (29% of AGI, reported on 22.0% of returns)
Here:
$24,986
State:
$34,004
Here:
29.2% of AGI
State:
22.7% of AGI
(% of AGI for various income ranges: 4.0% for AGIs below $25k, 8.2% for AGIs $25k-50k, 16.9% for AGIs $50k-75k, 19.8% for AGIs $75k-100k, 20.7% for AGIs $100k-200k, 24.3% for AGIs over 200k)
Charity contributions: $3,017 (reported on 18.0% of returns)
Here:
$3,017
State:
$4,659
(% of AGI for various income ranges: 0.2% for AGIs below $25k, 0.5% for AGIs $25k-50k, 1.3% for AGIs $50k-75k, 1.6% for AGIs $75k-100k, 1.8% for AGIs $100k-200k, 6.9% for AGIs over 200k)
Taxes paid: $7,749 (reported on 21.9% of returns)
93030:
$7,749
State:
$14,448
(% of AGI for various income ranges: 0.9% for AGIs below $25k, 1.9% for AGIs $25k-50k, 4.6% for AGIs $50k-75k, 6.1% for AGIs $75k-100k, 7.4% for AGIs $100k-200k, 9.5% for AGIs over 200k)
Earned income credit: $2,332 (reported on 22.5% of returns)
Here:
$2,332
State:
$2,286
(% of AGI for various income ranges: 5.6% for AGIs below $25k, 1.4% for AGIs $25k-50k)
Percentage of individuals using paid preparers for their 2012 taxes: 76.3%
Here:
76%
State:
64%
(% for various income ranges: 76.5% for AGIs below $25k, 79.1% for AGIs $25k-50k, 73.9% for AGIs $50k-75k, 70.8% for AGIs $75k-100k, 71.1% for AGIs $100k-200k, 82.4% for AGIs over 200k)
Averages for the 2004 tax year for zip code 93030, filed in 2005:
Average Adjusted Gross Income (AGI) in 2004: $39,182 (Individual Income Tax Returns)
Here:
$39,182
State:
$58,600
Salary/wage: $35,250 (reported on 89.9% of returns)
Here:
$35,250
State:
$49,455
(% of AGI for various income ranges: 127.3% for AGIs below $10k, 86.6% for AGIs $10k-25k, 88.3% for AGIs $25k-50k, 86.5% for AGIs $50k-75k, 86.4% for AGIs $75k-100k, 61.5% for AGIs over 100k)
Taxable interest for individuals: $1,024 (reported on 32.7% of returns)
This zip code:
$1,024
California:
$2,365
(% of AGI for various income ranges: 4.2% for AGIs below $10k, 0.6% for AGIs $10k-25k, 0.5% for AGIs $25k-50k, 0.8% for AGIs $50k-75k, 0.7% for AGIs $75k-100k, 1.2% for AGIs over 100k)
Taxable dividends: $1,999 (reported on 10.1% of returns)
Here:
$1,999
State:
$4,746
(% of AGI for various income ranges: 1.6% for AGIs below $10k, 0.3% for AGIs $10k-25k, 0.3% for AGIs $25k-50k, 0.5% for AGIs $50k-75k, 0.6% for AGIs $75k-100k, 0.8% for AGIs over 100k)
Net capital gain/loss: +$6,982 (reported on 8.3% of returns)
Here:
+$6,982
State:
+$23,418
(% of AGI for various income ranges: -0.7% for AGIs below $10k, 0.0% for AGIs $10k-25k, 0.2% for AGIs $25k-50k, 0.5% for AGIs $50k-75k, 0.5% for AGIs $75k-100k, 4.8% for AGIs over 100k)
Profit/loss from business: +$11,478 (reported on 12.6% of returns)
Here:
+$11,478
State:
+$16,826
(% of AGI for various income ranges: 2.0% for AGIs below $10k, 5.3% for AGIs $10k-25k, 3.6% for AGIs $25k-50k, 2.9% for AGIs $50k-75k, 2.4% for AGIs $75k-100k, 4.1% for AGIs over 100k)
IRA payment deduction: $3,019 (reported on 1.8% of returns)
93030:
$3,019
California:
$3,192
(% of AGI for various income ranges: 0.1% for AGIs $10k-25k, 0.2% for AGIs $25k-50k, 0.2% for AGIs $50k-75k, 0.2% for AGIs $75k-100k, 0.1% for AGIs over 100k)
Self-employed pension: $12,505 (reported on 0.5% of returns)
Here:
$12,505
California:
$17,688
(% of AGI for various income ranges: 0.1% for AGIs $25k-50k, 0.1% for AGIs $50k-75k, 0.2% for AGIs $75k-100k, 0.3% for AGIs over 100k)
Total itemized deductions: $24,731 (33% of AGI, reported on 31.3% of returns)
Here:
$24,731
State:
$28,113
Here:
32.5% of AGI
State:
25.3% of AGI
(% of AGI for various income ranges: 12.4% for AGIs below $10k, 8.3% for AGIs $10k-25k, 16.2% for AGIs $25k-50k, 24.7% for AGIs $50k-75k, 26.7% for AGIs $75k-100k, 22.3% for AGIs over 100k)
Charity contributions deductions: $2,363 (3% of AGI, reported on 27.5% of returns)
Here:
$2,363
State:
$3,923
Here:
3.0% of AGI
State:
3.3% of AGI
(% of AGI for various income ranges: 0.4% for AGIs below $10k, 0.5% for AGIs $10k-25k, 1.1% for AGIs $25k-50k, 2.0% for AGIs $50k-75k, 2.2% for AGIs $75k-100k, 2.3% for AGIs over 100k)
Total tax: $4,648 (reported on 62.9% of returns)
93030:
$4,648
State:
$10,761
(% of AGI for various income ranges: 3.2% for AGIs below $10k, 3.0% for AGIs $10k-25k, 5.0% for AGIs $25k-50k, 7.1% for AGIs $50k-75k, 8.2% for AGIs $75k-100k, 12.2% for AGIs over 100k)
Earned income credit: $1,897 (reported on 22.9% of returns)
Here:
$1,897
State:
$1,763
Percentage of individuals using paid preparers for their 2004 taxes: 74.1%
Here:
74%
State:
66%
(% for various income ranges: 68.4% for AGIs below $10k, 77.5% for AGIs $10k-25k, 75.0% for AGIs $25k-50k, 73.2% for AGIs $50k-75k, 71.3% for AGIs $75k-100k, 71.9% for AGIs over 100k)
Likely homosexual households (counted as self-reported same-sex unmarried-partner households)
Lesbian couples: 0.1% of all households
Gay men: 0.0% of all households
Household received Food Stamps/SNAP in the past 12 months: 2,610 Household did not receive Food Stamps/SNAP in the past 12 months: 12,835
Women who had a birth in the past 12 months: 883 (529 now married, 355 unmarried) Women who did not have a birth in the past 12 months: 13,857 (4,662 now married, 9,229 unmarried)
Housing units in zip code 93030 with a mortgage: 4,891 (277 second mortgage, 10 home equity loan, 247 both second mortgage and home equity loan) Houses without a mortgage: 138
Median monthly owner costs for units with a mortgage: $2,364 Median monthly owner costs for units without a mortgage: $551
Residents with income below the poverty level in 2022:
This zip code:
11.1%
Whole state:
12.2%
Residents with income below 50% of the poverty level in 2022:
This zip code:
7.2%
Whole state:
6.2%
Median number of rooms in houses and condos:
Here:
6.1
State:
6.0
Median number of rooms in apartments:
Here:
4.0
State:
3.9
Notable locations in this zip code not listed on our city pages
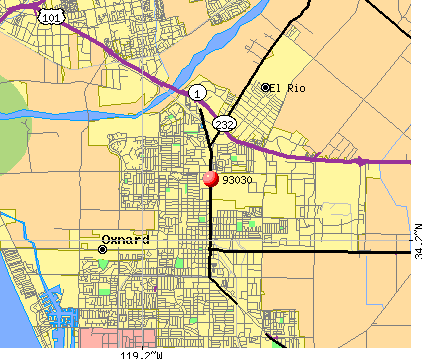
Notable locations in zip code 93030: Saint Johns Regional Medical Center Health Sciences Library (A), Oxnard Public Library (B), Oxnard City Hall (C), Oxnard Chamber of Commerce (D), Gullwing Childrens Museum (E), Colonia Multi-Service Center (F), Oxnard Community Center (G), Oxnard Fire Department Station 1 (H), Gold Coast Ambulance (I), Oxnard Fire Department Station 5 (J). Display/hide their locations on the map
Churches in zip code 93030 include: Church for the Nations (A), All Saints Episcopal Church (B), Buddhist Church of Oxnard (C), First Baptist Church (D), First Church of Christ Scientist (E), First Presbyterian Church (F), Foursquare Gospel Church (G), Oxnard Community Christian Church (H), Calvary Chapel Oxnard (I). Display/hide their locations on the map
Parks in zip code 93030 include: Brittell Park (1), Eastwood Memorial Park (2), Lemonwood Park (3), Cabrillo Park (4), Fremont Park (5), Colonia Park (6), Community Center Park (7), Del Sol Park (8), Heritage Square (9). Display/hide their locations on the map
6,998 married couples with children.
3,786 single-parent households (659 men, 3,127 women).
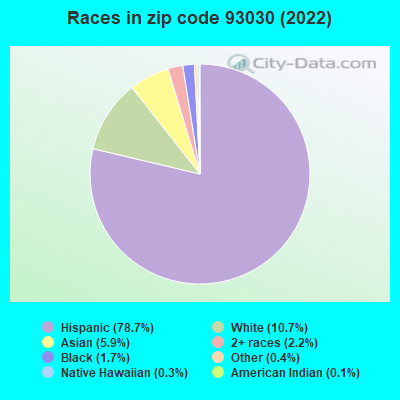
30.9% of residents of 93030 zip code speak English at home.
62.9% of residents speak Spanish at home (56% very well, 13% well, 16% not well, 15% not at all).
0.5% of residents speak other Indo-European language at home (88% very well, 12% well).
4.0% of residents speak Asian or Pacific Island language at home (58% very well, 26% well, 15% not well, 1% not at all).
1.5% of residents speak other language at home (15% very well, 7% not well, 78% not at all).
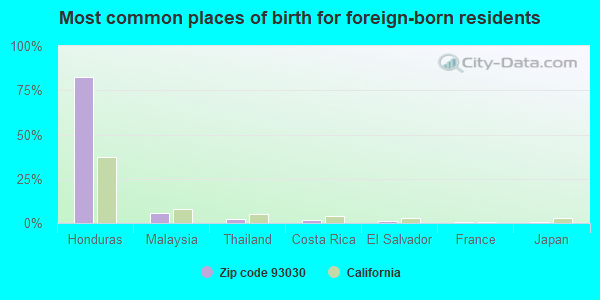
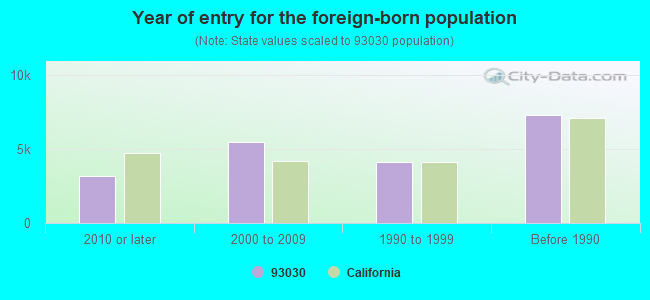
Foreign born population: 19,661 (33.9%) (42.6% of them are naturalized citizens)
Major facilities with environmental interests located in this zip code:
HUENEME HIGH SCHOOL (500 BARD ROAD in OXNARD, CA)
(National Center for Education Statistics) - STATE ID-5632849 CRITERIA AND HAZARDOUS AIR POLLUTANT INVENTORY (Inventory of air pollution sources) Large Quantity Generators, more that 1000 kg of hazardous waste/month (Resource Conservation and Recovery Act (tracking hazardous waste)) - notification Business SIC classification: ELEMENTARY AND SECONDARY SCHOOLS Organizations: OXNARD UNION H S DISTRICT (CONTACT/OWNER)
, OXNARD UNION HIGH (SCHOOL DISTRICT)
NUEVO MANDALAY ONSHORE FACILITY (201 N HARBOR BLVD in OXNARD, CA) . Federal Facility. DEPARTMENT OF INTERIOR
STATE MASTER (California - Hazardous Waste Tracking) - HAZARDOU WASTE PROGRAM CRITERIA AND HAZARDOUS AIR POLLUTANT INVENTORY (Inventory of air pollution sources) Small Quantity Generators, between 100 kg and 1000 kg of hazardous waste/month (Resource Conservation and Recovery Act (tracking hazardous waste)) - notification Business SIC and NAICS classification: CRUDE PETROLEUM AND NATURAL GAS Organizations: DOS CUADRAS OFFSHORE RESOURCES CORP LLC (CONTACT/OPERATOR)
Alternative names: NUEVO ENERGY - MANDALAY ONSHORE FAC
EQUILON ENTERPRISES (2460 VINEYARD in OXNARD, CA) . Federal Facility
STATE MASTER (California - Hazardous Waste Tracking) - HAZARDOU WASTE PROGRAM Small Quantity Generators, between 100 kg and 1000 kg of hazardous waste/month (Resource Conservation and Recovery Act (tracking hazardous waste)) Small Quantity Generators, between 100 kg and 1000 kg of hazardous waste/month (Resource Conservation and Recovery Act (tracking hazardous waste)) - notification Organizations: EQUILON ENTERPRISES L L C (CONTACT/OWNER)
Alternative names: FINANCIAL PLAZ SHELL, SHELL OIL CO
HAAS AUTOMATION (2800 STURGIS RD in OXNARD, CA)
STATE MASTER (California - Hazardous Waste Tracking) - HAZARDOU WASTE PROGRAM CRITERIA AND HAZARDOUS AIR POLLUTANT INVENTORY (Inventory of air pollution sources) HAZARDOUS WASTE BIENNIAL REPORTER (Resource Conservation and Recovery Act (tracking hazardous waste)) Small Quantity Generators, between 100 kg and 1000 kg of hazardous waste/month (Resource Conservation and Recovery Act (tracking hazardous waste)) - notification Business SIC classification: METALWORKING MACHINERY Organizations: GENE HAAS (CONTACT/OWNER)
HARBOR AUTO BODY (2262 NORTH OXNARD BLVD UNIT B in OXNARD, CA)
(Resource Conservation and Recovery Act (tracking hazardous waste)) Organizations: AL PETERSON (CONTACT/OWNER)
CHROMUX TECHNOLOGIES INCORPORATED (3001 STURGIS ROAD in OXNARD, CA)
STATE MASTER (California - Hazardous Waste Tracking) - HAZARDOU WASTE PROGRAM Small Quantity Generators, between 100 kg and 1000 kg of hazardous waste/month (Resource Conservation and Recovery Act (tracking hazardous waste)) - notification TRI REPORTER (Tracking of toxic chemicals releasing facilities) Business SIC classification: SEMICONDUCTORS AND RELATED DEVICES Organizations: CHROMUX TECH INC (CONTACT/OWNER)
Alternative names: BROADBAND TRANSPORT TECH INC, CHROMUX TECH INC OXNARD C A, CHROMUX TECH INC OXNARD C A
CHAPARRAL CONSTRUCTION CORP (5625 VINEYARD AVE in OXNARD, CA)
STATE MASTER (California - Hazardous Waste Tracking) - HAZARDOU WASTE PROGRAM Small Quantity Generators, between 100 kg and 1000 kg of hazardous waste/month (Resource Conservation and Recovery Act (tracking hazardous waste)) - notification Organizations: JESSE J CASTILLO (CONTACT/OWNER)
EQUILON ENTERPRISES LLC (1465 W 5TH ST in OXNARD, CA) . Federal Facility
STATE MASTER (California - Hazardous Waste Tracking) - HAZARDOU WASTE PROGRAM CRITERIA AND HAZARDOUS AIR POLLUTANT INVENTORY (Inventory of air pollution sources) Small Quantity Generators, between 100 kg and 1000 kg of hazardous waste/month (Resource Conservation and Recovery Act (tracking hazardous waste)) - notification Business SIC classification: GASOLINE SERVICE STATIONS Organizations: EQUILON ENTERPRISES L L C (CONTACT/OWNER)
Alternative names: SHELL OIL CO
AAMCO TRANSMISSIONS (531 VENTURA BLVD in OXNARD, CA)
STATE MASTER (California - Hazardous Waste Tracking) - HAZARDOU WASTE PROGRAM Small Quantity Generators, between 100 kg and 1000 kg of hazardous waste/month (Resource Conservation and Recovery Act (tracking hazardous waste)) - notification Organizations: W PATRICK RIGGS (CONTACT/OWNER)
ADVANCED INDUSTRIAL RECYCLING (420 N A ST in OXNARD, CA)
STATE MASTER (California - Hazardous Waste Tracking) - HAZARDOU WASTE PROGRAM TRANSPORTER (Resource Conservation and Recovery Act (tracking hazardous waste)) - notification Organizations: JOHN BUCHKO JR (CONTACT/OWNER)
ALPHA RESINS INC (500 DEL NORTE BLVD in OXNARD, CA)
STATE MASTER (California - Hazardous Waste Tracking) - HAZARDOU WASTE PROGRAM Small Quantity Generators, between 100 kg and 1000 kg of hazardous waste/month (Resource Conservation and Recovery Act (tracking hazardous waste)) - notification Organizations: HIROSHI KUROYANAGI (CONTACT/OWNER)
LIMON, ROBERT (334 WINCHESTER DR in OXNARD, CA)
STATE MASTER (California - Hazardous Waste Tracking) - HAZARDOU WASTE PROGRAM Small Quantity Generators, between 100 kg and 1000 kg of hazardous waste/month (Resource Conservation and Recovery Act (tracking hazardous waste)) Business NAICS classification: ELECTROPLATING, PLATING, POLISHING, ANODIZING, AND COLORING.
BARBERS AUTO PARTS (1540 S OXNARD BLVD in OXNARD, CA)
STATE MASTER (California - Hazardous Waste Tracking) - HAZARDOU WASTE PROGRAM Small Quantity Generators, between 100 kg and 1000 kg of hazardous waste/month (Resource Conservation and Recovery Act (tracking hazardous waste)) Alternative names: BARBERS MACHINE SHOP
Housing units lacking complete plumbing facilities: 0.8% Housing units lacking complete kitchen facilities: 0.8%
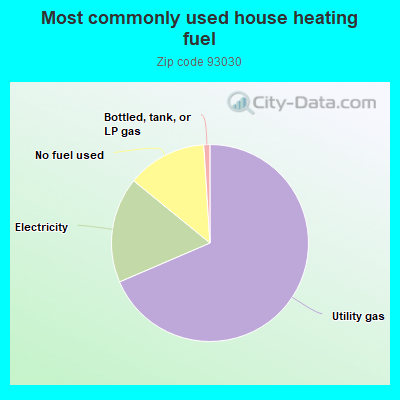
68.0%Utility gas
17.2%Electricity
13.0%No fuel used
1.0%Bottled, tank, or LP gas
Population in 1990: 66,240. Population change in the 1990s: +13,477 (+20.3%).
Place of birth for U.S.-born residents:
This state: 33,815
Northeast: 687
Midwest: 1,028
South: 1,399
West: 994
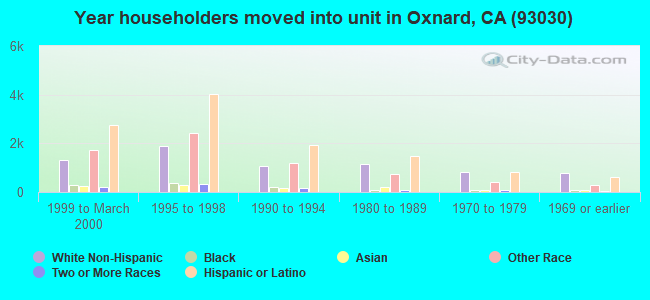
54% of the 93030 zip code residents lived in the same house 5 years ago. Out of people who lived in different houses, 80% lived in this county. Out of people who lived in different counties, 50% lived in California.
94% of the 93030 zip code residents lived in the same house 1 year ago. Out of people who lived in different houses, 70% moved from this county. Out of people who lived in different houses, 22% moved from different county within same state. Out of people who lived in different houses, 3% moved from different state. Out of people who lived in different houses, 8% moved from abroad.
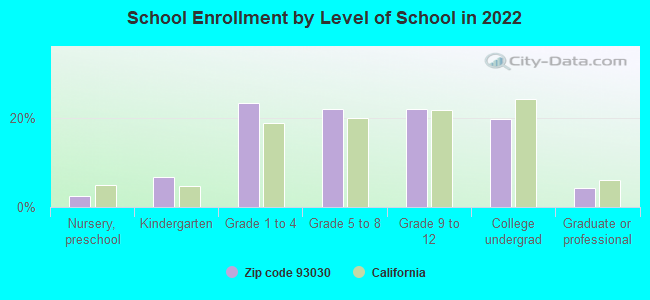
Private vs. public school enrollment:
Students in private schools in grades 1 to 8 (elementary and middle school): 258
Here:
3.9%
California:
10.5%
Students in private schools in grades 9 to 12 (high school): 61
Here:
1.9%
California:
8.5%
Students in private undergraduate colleges: 275
Here:
9.5%
California:
15.9%
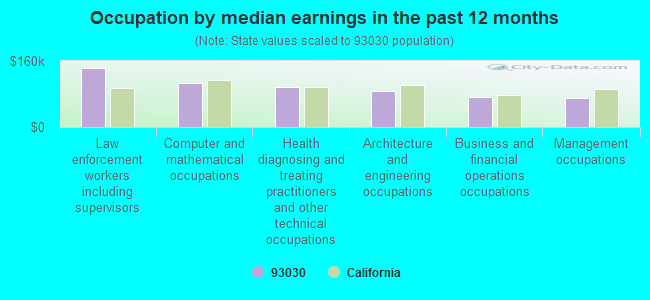
Occupation by median earnings in the past 12 months ($)
142,714Law enforcement workers including supervisors
105,529Computer and mathematical occupations
98,162Health diagnosing and treating practitioners and other technical occupations
87,965Architecture and engineering occupations
71,702Business and financial operations occupations
69,304Management occupations
Companies with biggest federal contracts located in this zip code (OXNARD, CA):
PTI TECHNOLOGIES INC (501 DEL NORTE BLVD) : $24,145,264 in 831 contractsfrom 1999 to 2006
Contracts for Centrifugals, Separators, and Pressure and Vacuum Filters, Aircraft Hydraulic, Vacuum, and De-icing System Components, Minelayers And Minesweepers, Engine Electrical System Components, Nonaircraft, and moreby Defense Logistics Agency, Air Force, Navy, Army, and others Signed by year:2000: $4,611,323; 2001: $2,513,989; 2002: $2,336,110; 2003: $2,422,360; 2004: $3,808,963; 2005: $5,110,365; 2006: $2,460,311.
Biggest contracts:
$572,511 with Defense Logistics Agency for Centrifugals, Separators, and Pressure and Vacuum Filters. Signed on 2000-06-29. Completion date: 2004-09-19.
$540,132 with Air Force for Aircraft Hydraulic, Vacuum, and De-icing System Components. Signed on 2003-07-22. Completion date: 2004-09-14.
$473,073 with Defense Logistics Agency for Aircraft Hydraulic, Vacuum, and De-icing System Components. Signed on 2000-08-24. Completion date: 2000-12-02.
$411,725 with Navy for Minelayers And Minesweepers. Signed on 2004-01-29. Completion date: 2004-11-04.
BIRD ROOFING & WATERPROOFING I (1830 LOCKWOOD STREET, STE; small business) : $7,822,284 in 56 contractsfrom 1999 to 2004
Contracts for Maintenance, Repair or Alteration of Real Property -- Other Non-Building Facilities, Construction of Structures and Facilities -- Other Non-Building Facilities, Construction of Structures and Facilities -- Family Housing Facilities, Architect - Engineer Services (including landscaping, interior layout, and designing), and moreby Army, Air Force, Department of State, Navy, and others Signed by year:2000: $3,539,290; 2001: $3,126,514; 2002: $306,481; 2003: $0; 2004: -$2,000; 2005: $0; 2006: $0.
Biggest contracts:
$1,016,273 with Army for Maintenance, Repair or Alteration of Real Property -- Other Non-Building Facilities. Signed on 2000-09-10. Completion date: 2000-09-10.
$782,460 with Army for Construction of Structures and Facilities -- Other Non-Building Facilities. Signed on 2001-08-17. Completion date: 2001-09-04.
$651,999 with Air Force for Construction of Structures and Facilities -- Family Housing Facilities. Signed on 1999-12-17. Completion date: 2000-04-19.
$504,965 with Army for Maintenance, Repair or Alteration of Real Property -- Other Non-Building Facilities. Signed on 2000-06-13. Completion date: 2000-09-29.
NORJEN INC (2361 EASTMAN AVE; small business) : $5,563,226 in 195 contractsfrom 2000 to 2006
Contracts for Airframe Structural Components, Aircraft Air Conditioning, Heating, and Pressurizing Equipment, Miscellaneous Aircraft Accessories and Components, Environmental Sciences -- Applied Research and Exploratory Development (R&D), and moreby Defense Logistics Agency, NASA, Navy, Army, and others Signed by year:2000: $35,000; 2001: $0; 2002: $303,384; 2003: $379,265; 2004: $1,388,757; 2005: $2,789,970; 2006: $666,850.
Biggest contracts:
$96,640 with Defense Logistics Agency for Airframe Structural Components. Signed on 2005-02-18. Completion date: 2006-01-14.
$92,902, same as above.Signed on 2005-12-14. Completion date: 2006-03-19.
$92,664, same as above.Signed on 2004-10-13. Completion date: 2005-10-28.
$90,600, same as above.Signed on 2005-06-21. Completion date: 2005-07-21.
SOUTHERN CALIFORNIA GOLD PRODU (2350 SANTIAGO CT; small business) : $4,946,904 in 73 contractsfrom 2003 to 2006
Contracts for Vehicular Cab, Body, and Frame Structural Components, Miscellaneous Items, Vehicular Furniture and Accessories, Metal Finishing Equipment, and moreby Navy, Defense Logistics Agency, Army Signed by year:2000: $0; 2001: $0; 2002: $0; 2003: $1,316,009; 2004: $3,081,698; 2005: $475,663; 2006: $73,534.
Biggest contracts:
$437,306 with Navy for Vehicular Cab, Body, and Frame Structural Components. Signed on 2004-02-05. Completion date: 2004-03-19.
$356,295, same as above.Signed on 2003-12-04. Completion date: 2004-01-02.
$335,958, same as above.Signed on 2004-01-21. Completion date: 2004-01-25.
$295,247, same as above.Signed on 2004-05-14. Completion date: 2004-05-21.
OXNARD PRECISION FABRICATION I (2200 TEAL CLUB RD; small business) : $4,434,262 in 224 contractsfrom 2000 to 2006
Contracts for Vehicular Cab, Body, and Frame Structural Components, Guns, over 30 mm up to 75 mm, Vehicular Furniture and Accessories, Miscellaneous Vehicular Components, and moreby Defense Logistics Agency, Army, Navy Signed by year:2000: $34,200; 2001: $81,559; 2002: $221,843; 2003: $357,638; 2004: $1,294,141; 2005: $1,554,227; 2006: $890,654.
Biggest contracts:
$312,659 with Defense Logistics Agency for Vehicular Cab, Body, and Frame Structural Components. Signed on 2004-11-10. Completion date: 2005-02-08.
$232,213, same as above.Signed on 2006-04-18. Completion date: 2006-12-02.
$154,123, same as above.Signed on 2005-10-21. Completion date: 2006-02-18.
$116,863 with Army for Vehicular Cab, Body, and Frame Structural Components. Signed on 2005-03-10. Completion date: 2006-03-30.
JOPANA TECHNOLOGIES, INC (401 N LOMBARD ST , UNIT I; small business) : $4,412,469 in 36 contractsfrom 2000 to 2005
Contracts for Armament Training Devices, Engineering and Technical Services, ADP Support Equipment, Miscellaneous Electric Power and Distribution Equipment, and moreby Defense Logistics Agency, Navy Signed by year:2000: $1,140,065; 2001: $381,693; 2002: $601,670; 2003: $1,491,719; 2004: $786,522; 2005: $10,800; 2006: $0.
Biggest contracts:
$965,300 with Defense Logistics Agency for Armament Training Devices. Signed on 2003-10-03. Completion date: 2004-08-29.
$451,270 with Navy for Engineering and Technical Services. Signed on 2000-04-11. Completion date: 2001-01-03.
$403,850 with Defense Logistics Agency for Armament Training Devices. Signed on 2004-01-28. Completion date: 2004-11-28.
$254,262 with Navy for Engineering and Technical Services. Signed on 2001-01-31. Completion date: 2001-09-30.
COLIC TOOL & ENGINEERING CO (301 CANDELARIA; small business) : $4,263,449 in 103 contractsfrom 1999 to 2006
Contracts for Airframe Structural Components, Hose and Flexible Tubing, Guns, through 30 mm, Fire Control Maintenance and Repair Shop Specialized Equipment, and moreby Defense Logistics Agency, Navy, Air Force Signed by year:2000: $1,481,012; 2001: $757,987; 2002: $865,303; 2003: $0; 2004: $518,775; 2005: $411,375; 2006: $169,932.
Biggest contracts:
$408,000 with Defense Logistics Agency for Airframe Structural Components. Signed on 2002-08-27. Completion date: 2002-12-26.
$343,533 with Defense Logistics Agency for Hose and Flexible Tubing. Signed on 2001-08-08. Completion date: 2002-02-06.
$317,145 with Defense Logistics Agency for Airframe Structural Components. Signed on 2000-04-25. Completion date: 2001-10-05.
$196,420, same as above.Signed on 2000-12-27. Completion date: 2001-08-25.
ADVANCED COMPOSITE TOOLING (2201 E CELSIUS AVE SUITE; small business) : $1,748,843 in 126 contractsfrom 2004 to 2006
Contracts for Airframe Structural Components, Electrical Hardware and Supplies, Miscellaneous Aircraft Accessories and Components, Aircraft Air Conditioning, Heating, and Pressurizing Equipment, and moreby Defense Logistics Agency Signed by year:2000: $0; 2001: $0; 2002: $0; 2003: $0; 2004: $405,231; 2005: $1,168,106; 2006: $175,506.
Biggest contracts:
$91,700 with Defense Logistics Agency for Airframe Structural Components. Signed on 2005-08-26. Completion date: 2005-12-20.
$76,483, same as above.Signed on 2005-03-03. Completion date: 2006-03-28.
$72,850, same as above.Signed on 2004-08-10. Completion date: 2005-10-14.
$71,617, same as above.Signed on 2006-01-31. Completion date: 2006-06-30.
SIERRA TECH (850 E 5TH STREET; small business) : $1,552,573 in 45 contractsfrom 2000 to 2006
Contracts for Gas Turbines and Jet Engines, Aircraft; Prime Moving, and Components, Aircraft Air Conditioning, Heating, and Pressurizing Equipment, Bolts, Airframe Structural Components, and moreby Defense Logistics Agency Signed by year:2000: $164,313; 2001: $145,620; 2002: $429,605; 2003: $39,249; 2004: $197,341; 2005: $214,256; 2006: $362,189.
Biggest contracts:
$98,500 with Defense Logistics Agency for Gas Turbines and Jet Engines, Aircraft; Prime Moving, and Components. Signed on 2006-03-08. Completion date: 2006-08-05.
$90,285 with Defense Logistics Agency for Aircraft Air Conditioning, Heating, and Pressurizing Equipment. Signed on 2002-07-26. Completion date: 2002-11-12.
$86,550 with Defense Logistics Agency for Bolts. Signed on 2002-02-11. Completion date: 2002-03-21.
$83,847 with Defense Logistics Agency for Airframe Structural Components. Signed on 2004-05-17. Completion date: 2005-09-09.
STORK DPR SVC VENTURA CNTY INC (720 PACIFIC AVE; small business) : $1,249,273 in 3 contractsfrom 1999 to 2002
$750,000 with Navy for Laundry and DryCleaning Services. Signed on 2001-06-04. Completion date: 2002-05-31.
$299,273, same as above.Signed on 2002-06-03. Completion date: 2003-06-01.
$200,000, same as above.Signed on 1999-10-01. Completion date: 2000-09-30.
Top industries in this zip code by the number of employees in 2005:
Administrative and Support and Waste Management and Remediation Services: Temporary Help Services (500-999 employees: 1 establishment, 250-499 employees: 2 establishments, 100-249 employees: 5 establishments, 50-99 employees: 2 establishments, 20-49 employees: 3 establishments, 10-19 employees: 2 establishments, 1-4 employees: 2 establishments)
2005 - 2018 National Fire Incident Reporting System (NFIRS) incidents
Based on the data from the years 2005 - 2018 the average number of fire incidents per year is 80. The highest number of reported fires - 251 took place in 2017, and the least - 15 in 2009. The data has an increasing trend.
When looking into fire subcategories, the most incidents belonged to: Outside Fires (40.8%), and Structure Fires (37.9%).
Fire incident types reported to NFIRS in Zip Code 93030


 Nearest zip codes: 93036, 93043, 93035, 93033, 93004, 93003.


 Based on the data from the years 2005 - 2018 the average number of fire incidents per year is 80. The highest number of reported fires - 251 took place in 2017, and the least - 15 in 2009. The data has an increasing trend.
 When looking into fire subcategories, the most incidents belonged to: Outside Fires (40.8%), and Structure Fires (37.9%).