Port Hueneme, California Submit your own pictures of this city and show them to the world
OSM Map
General Map
Google Map
MSN Map
OSM Map
General Map
Google Map
MSN Map
OSM Map
General Map
Google Map
MSN Map
OSM Map
General Map
Google Map
MSN Map
Please wait while loading the map...
Population in 2022: 21,407 (100% urban, 0% rural). Population change since 2000: -2.0%Males: 10,892 Females: 10,515
March 2022 cost of living index in Port Hueneme: 93.5 (less than average, U.S. average is 100) Percentage of residents living in poverty in 2022: 13.0%for White Non-Hispanic residents , 20.1% for Black residents , 14.1% for Hispanic or Latino residents , 9.0% for American Indian residents , 25.3% for other race residents , 15.3% for two or more races residents )
Profiles of local businesses
Business Search - 14 Million verified businesses
Data:
Median household income ($)
Median household income (% change since 2000)
Household income diversity
Ratio of average income to average house value (%)
Ratio of average income to average rent
Median household income ($) - White
Median household income ($) - Black or African American
Median household income ($) - Asian
Median household income ($) - Hispanic or Latino
Median household income ($) - American Indian and Alaska Native
Median household income ($) - Multirace
Median household income ($) - Other Race
Median household income for houses/condos with a mortgage ($)
Median household income for apartments without a mortgage ($)
Races - White alone (%)
Races - White alone (% change since 2000)
Races - Black alone (%)
Races - Black alone (% change since 2000)
Races - American Indian alone (%)
Races - American Indian alone (% change since 2000)
Races - Asian alone (%)
Races - Asian alone (% change since 2000)
Races - Hispanic (%)
Races - Hispanic (% change since 2000)
Races - Native Hawaiian and Other Pacific Islander alone (%)
Races - Native Hawaiian and Other Pacific Islander alone (% change since 2000)
Races - Two or more races (%)
Races - Two or more races (% change since 2000)
Races - Other race alone (%)
Races - Other race alone (% change since 2000)
Racial diversity
Unemployment (%)
Unemployment (% change since 2000)
Unemployment (%) - White
Unemployment (%) - Black or African American
Unemployment (%) - Asian
Unemployment (%) - Hispanic or Latino
Unemployment (%) - American Indian and Alaska Native
Unemployment (%) - Multirace
Unemployment (%) - Other Race
Population density (people per square mile)
Population - Males (%)
Population - Females (%)
Population - Males (%) - White
Population - Males (%) - Black or African American
Population - Males (%) - Asian
Population - Males (%) - Hispanic or Latino
Population - Males (%) - American Indian and Alaska Native
Population - Males (%) - Multirace
Population - Males (%) - Other Race
Population - Females (%) - White
Population - Females (%) - Black or African American
Population - Females (%) - Asian
Population - Females (%) - Hispanic or Latino
Population - Females (%) - American Indian and Alaska Native
Population - Females (%) - Multirace
Population - Females (%) - Other Race
Coronavirus confirmed cases (Apr 27, 2024)
Deaths caused by coronavirus (Apr 27, 2024)
Coronavirus confirmed cases (per 100k population) (Apr 27, 2024)
Deaths caused by coronavirus (per 100k population) (Apr 27, 2024)
Daily increase in number of cases (Apr 27, 2024)
Weekly increase in number of cases (Apr 27, 2024)
Cases doubled (in days) (Apr 27, 2024)
Hospitalized patients (Apr 18, 2022)
Negative test results (Apr 18, 2022)
Total test results (Apr 18, 2022)
COVID Vaccine doses distributed (per 100k population) (Sep 19, 2023)
COVID Vaccine doses administered (per 100k population) (Sep 19, 2023)
COVID Vaccine doses distributed (Sep 19, 2023)
COVID Vaccine doses administered (Sep 19, 2023)
Likely homosexual households (%)
Likely homosexual households (% change since 2000)
Likely homosexual households - Lesbian couples (%)
Likely homosexual households - Lesbian couples (% change since 2000)
Likely homosexual households - Gay men (%)
Likely homosexual households - Gay men (% change since 2000)
Cost of living index
Median gross rent ($)
Median contract rent ($)
Median monthly housing costs ($)
Median house or condo value ($)
Median house or condo value ($ change since 2000)
Mean house or condo value by units in structure - 1, detached ($)
Mean house or condo value by units in structure - 1, attached ($)
Mean house or condo value by units in structure - 2 ($)
Mean house or condo value by units in structure by units in structure - 3 or 4 ($)
Mean house or condo value by units in structure - 5 or more ($)
Mean house or condo value by units in structure - Boat, RV, van, etc. ($)
Mean house or condo value by units in structure - Mobile home ($)
Median house or condo value ($) - White
Median house or condo value ($) - Black or African American
Median house or condo value ($) - Asian
Median house or condo value ($) - Hispanic or Latino
Median house or condo value ($) - American Indian and Alaska Native
Median house or condo value ($) - Multirace
Median house or condo value ($) - Other Race
Median resident age
Resident age diversity
Median resident age - Males
Median resident age - Females
Median resident age - White
Median resident age - Black or African American
Median resident age - Asian
Median resident age - Hispanic or Latino
Median resident age - American Indian and Alaska Native
Median resident age - Multirace
Median resident age - Other Race
Median resident age - Males - White
Median resident age - Males - Black or African American
Median resident age - Males - Asian
Median resident age - Males - Hispanic or Latino
Median resident age - Males - American Indian and Alaska Native
Median resident age - Males - Multirace
Median resident age - Males - Other Race
Median resident age - Females - White
Median resident age - Females - Black or African American
Median resident age - Females - Asian
Median resident age - Females - Hispanic or Latino
Median resident age - Females - American Indian and Alaska Native
Median resident age - Females - Multirace
Median resident age - Females - Other Race
Commute - mean travel time to work (minutes)
Travel time to work - Less than 5 minutes (%)
Travel time to work - Less than 5 minutes (% change since 2000)
Travel time to work - 5 to 9 minutes (%)
Travel time to work - 5 to 9 minutes (% change since 2000)
Travel time to work - 10 to 19 minutes (%)
Travel time to work - 10 to 19 minutes (% change since 2000)
Travel time to work - 20 to 29 minutes (%)
Travel time to work - 20 to 29 minutes (% change since 2000)
Travel time to work - 30 to 39 minutes (%)
Travel time to work - 30 to 39 minutes (% change since 2000)
Travel time to work - 40 to 59 minutes (%)
Travel time to work - 40 to 59 minutes (% change since 2000)
Travel time to work - 60 to 89 minutes (%)
Travel time to work - 60 to 89 minutes (% change since 2000)
Travel time to work - 90 or more minutes (%)
Travel time to work - 90 or more minutes (% change since 2000)
Marital status - Never married (%)
Marital status - Now married (%)
Marital status - Separated (%)
Marital status - Widowed (%)
Marital status - Divorced (%)
Median family income ($)
Median family income (% change since 2000)
Median non-family income ($)
Median non-family income (% change since 2000)
Median per capita income ($)
Median per capita income (% change since 2000)
Median family income ($) - White
Median family income ($) - Black or African American
Median family income ($) - Asian
Median family income ($) - Hispanic or Latino
Median family income ($) - American Indian and Alaska Native
Median family income ($) - Multirace
Median family income ($) - Other Race
Median year house/condo built
Median year apartment built
Year house built - Built 2005 or later (%)
Year house built - Built 2000 to 2004 (%)
Year house built - Built 1990 to 1999 (%)
Year house built - Built 1980 to 1989 (%)
Year house built - Built 1970 to 1979 (%)
Year house built - Built 1960 to 1969 (%)
Year house built - Built 1950 to 1959 (%)
Year house built - Built 1940 to 1949 (%)
Year house built - Built 1939 or earlier (%)
Average household size
Household density (households per square mile)
Average household size - White
Average household size - Black or African American
Average household size - Asian
Average household size - Hispanic or Latino
Average household size - American Indian and Alaska Native
Average household size - Multirace
Average household size - Other Race
Occupied housing units (%)
Vacant housing units (%)
Owner occupied housing units (%)
Renter occupied housing units (%)
Vacancy status - For rent (%)
Vacancy status - For sale only (%)
Vacancy status - Rented or sold, not occupied (%)
Vacancy status - For seasonal, recreational, or occasional use (%)
Vacancy status - For migrant workers (%)
Vacancy status - Other vacant (%)
Residents with income below the poverty level (%)
Residents with income below 50% of the poverty level (%)
Children below poverty level (%)
Poor families by family type - Married-couple family (%)
Poor families by family type - Male, no wife present (%)
Poor families by family type - Female, no husband present (%)
Poverty status for native-born residents (%)
Poverty status for foreign-born residents (%)
Poverty among high school graduates not in families (%)
Poverty among people who did not graduate high school not in families (%)
Residents with income below the poverty level (%) - White
Residents with income below the poverty level (%) - Black or African American
Residents with income below the poverty level (%) - Asian
Residents with income below the poverty level (%) - Hispanic or Latino
Residents with income below the poverty level (%) - American Indian and Alaska Native
Residents with income below the poverty level (%) - Multirace
Residents with income below the poverty level (%) - Other Race
Air pollution - Air Quality Index (AQI)
Air pollution - CO
Air pollution - NO2
Air pollution - SO2
Air pollution - Ozone
Air pollution - PM10
Air pollution - PM25
Air pollution - Pb
Crime - Murders per 100,000 population
Crime - Rapes per 100,000 population
Crime - Robberies per 100,000 population
Crime - Assaults per 100,000 population
Crime - Burglaries per 100,000 population
Crime - Thefts per 100,000 population
Crime - Auto thefts per 100,000 population
Crime - Arson per 100,000 population
Crime - City-data.com crime index
Crime - Violent crime index
Crime - Property crime index
Crime - Murders per 100,000 population (5 year average)
Crime - Rapes per 100,000 population (5 year average)
Crime - Robberies per 100,000 population (5 year average)
Crime - Assaults per 100,000 population (5 year average)
Crime - Burglaries per 100,000 population (5 year average)
Crime - Thefts per 100,000 population (5 year average)
Crime - Auto thefts per 100,000 population (5 year average)
Crime - Arson per 100,000 population (5 year average)
Crime - City-data.com crime index (5 year average)
Crime - Violent crime index (5 year average)
Crime - Property crime index (5 year average)
1996 Presidential Elections Results (%) - Democratic Party (Clinton)
1996 Presidential Elections Results (%) - Republican Party (Dole)
1996 Presidential Elections Results (%) - Other
2000 Presidential Elections Results (%) - Democratic Party (Gore)
2000 Presidential Elections Results (%) - Republican Party (Bush)
2000 Presidential Elections Results (%) - Other
2004 Presidential Elections Results (%) - Democratic Party (Kerry)
2004 Presidential Elections Results (%) - Republican Party (Bush)
2004 Presidential Elections Results (%) - Other
2008 Presidential Elections Results (%) - Democratic Party (Obama)
2008 Presidential Elections Results (%) - Republican Party (McCain)
2008 Presidential Elections Results (%) - Other
2012 Presidential Elections Results (%) - Democratic Party (Obama)
2012 Presidential Elections Results (%) - Republican Party (Romney)
2012 Presidential Elections Results (%) - Other
2016 Presidential Elections Results (%) - Democratic Party (Clinton)
2016 Presidential Elections Results (%) - Republican Party (Trump)
2016 Presidential Elections Results (%) - Other
2020 Presidential Elections Results (%) - Democratic Party (Biden)
2020 Presidential Elections Results (%) - Republican Party (Trump)
2020 Presidential Elections Results (%) - Other
Ancestries Reported - Arab (%)
Ancestries Reported - Czech (%)
Ancestries Reported - Danish (%)
Ancestries Reported - Dutch (%)
Ancestries Reported - English (%)
Ancestries Reported - French (%)
Ancestries Reported - French Canadian (%)
Ancestries Reported - German (%)
Ancestries Reported - Greek (%)
Ancestries Reported - Hungarian (%)
Ancestries Reported - Irish (%)
Ancestries Reported - Italian (%)
Ancestries Reported - Lithuanian (%)
Ancestries Reported - Norwegian (%)
Ancestries Reported - Polish (%)
Ancestries Reported - Portuguese (%)
Ancestries Reported - Russian (%)
Ancestries Reported - Scotch-Irish (%)
Ancestries Reported - Scottish (%)
Ancestries Reported - Slovak (%)
Ancestries Reported - Subsaharan African (%)
Ancestries Reported - Swedish (%)
Ancestries Reported - Swiss (%)
Ancestries Reported - Ukrainian (%)
Ancestries Reported - United States (%)
Ancestries Reported - Welsh (%)
Ancestries Reported - West Indian (%)
Ancestries Reported - Other (%)
Educational Attainment - No schooling completed (%)
Educational Attainment - Less than high school (%)
Educational Attainment - High school or equivalent (%)
Educational Attainment - Less than 1 year of college (%)
Educational Attainment - 1 or more years of college (%)
Educational Attainment - Associate degree (%)
Educational Attainment - Bachelor's degree (%)
Educational Attainment - Master's degree (%)
Educational Attainment - Professional school degree (%)
Educational Attainment - Doctorate degree (%)
School Enrollment - Nursery, preschool (%)
School Enrollment - Kindergarten (%)
School Enrollment - Grade 1 to 4 (%)
School Enrollment - Grade 5 to 8 (%)
School Enrollment - Grade 9 to 12 (%)
School Enrollment - College undergrad (%)
School Enrollment - Graduate or professional (%)
School Enrollment - Not enrolled in school (%)
School enrollment - Public schools (%)
School enrollment - Private schools (%)
School enrollment - Not enrolled (%)
Median number of rooms in houses and condos
Median number of rooms in apartments
Housing units lacking complete plumbing facilities (%)
Housing units lacking complete kitchen facilities (%)
Density of houses
Urban houses (%)
Rural houses (%)
Households with people 60 years and over (%)
Households with people 65 years and over (%)
Households with people 75 years and over (%)
Households with one or more nonrelatives (%)
Households with no nonrelatives (%)
Population in households (%)
Family households (%)
Nonfamily households (%)
Population in families (%)
Family households with own children (%)
Median number of bedrooms in owner occupied houses
Mean number of bedrooms in owner occupied houses
Median number of bedrooms in renter occupied houses
Mean number of bedrooms in renter occupied houses
Median number of vehichles in owner occupied houses
Mean number of vehichles in owner occupied houses
Median number of vehichles in renter occupied houses
Mean number of vehichles in renter occupied houses
Mortgage status - with mortgage (%)
Mortgage status - with second mortgage (%)
Mortgage status - with home equity loan (%)
Mortgage status - with both second mortgage and home equity loan (%)
Mortgage status - without a mortgage (%)
Average family size
Average family size - White
Average family size - Black or African American
Average family size - Asian
Average family size - Hispanic or Latino
Average family size - American Indian and Alaska Native
Average family size - Multirace
Average family size - Other Race
Geographical mobility - Same house 1 year ago (%)
Geographical mobility - Moved within same county (%)
Geographical mobility - Moved from different county within same state (%)
Geographical mobility - Moved from different state (%)
Geographical mobility - Moved from abroad (%)
Place of birth - Born in state of residence (%)
Place of birth - Born in other state (%)
Place of birth - Native, outside of US (%)
Place of birth - Foreign born (%)
Housing units in structures - 1, detached (%)
Housing units in structures - 1, attached (%)
Housing units in structures - 2 (%)
Housing units in structures - 3 or 4 (%)
Housing units in structures - 5 to 9 (%)
Housing units in structures - 10 to 19 (%)
Housing units in structures - 20 to 49 (%)
Housing units in structures - 50 or more (%)
Housing units in structures - Mobile home (%)
Housing units in structures - Boat, RV, van, etc. (%)
House/condo owner moved in on average (years ago)
Renter moved in on average (years ago)
Year householder moved into unit - Moved in 1999 to March 2000 (%)
Year householder moved into unit - Moved in 1995 to 1998 (%)
Year householder moved into unit - Moved in 1990 to 1994 (%)
Year householder moved into unit - Moved in 1980 to 1989 (%)
Year householder moved into unit - Moved in 1970 to 1979 (%)
Year householder moved into unit - Moved in 1969 or earlier (%)
Means of transportation to work - Drove car alone (%)
Means of transportation to work - Carpooled (%)
Means of transportation to work - Public transportation (%)
Means of transportation to work - Bus or trolley bus (%)
Means of transportation to work - Streetcar or trolley car (%)
Means of transportation to work - Subway or elevated (%)
Means of transportation to work - Railroad (%)
Means of transportation to work - Ferryboat (%)
Means of transportation to work - Taxicab (%)
Means of transportation to work - Motorcycle (%)
Means of transportation to work - Bicycle (%)
Means of transportation to work - Walked (%)
Means of transportation to work - Other means (%)
Working at home (%)
Industry diversity
Most Common Industries - Agriculture, forestry, fishing and hunting, and mining (%)
Most Common Industries - Agriculture, forestry, fishing and hunting (%)
Most Common Industries - Mining, quarrying, and oil and gas extraction (%)
Most Common Industries - Construction (%)
Most Common Industries - Manufacturing (%)
Most Common Industries - Wholesale trade (%)
Most Common Industries - Retail trade (%)
Most Common Industries - Transportation and warehousing, and utilities (%)
Most Common Industries - Transportation and warehousing (%)
Most Common Industries - Utilities (%)
Most Common Industries - Information (%)
Most Common Industries - Finance and insurance, and real estate and rental and leasing (%)
Most Common Industries - Finance and insurance (%)
Most Common Industries - Real estate and rental and leasing (%)
Most Common Industries - Professional, scientific, and management, and administrative and waste management services (%)
Most Common Industries - Professional, scientific, and technical services (%)
Most Common Industries - Management of companies and enterprises (%)
Most Common Industries - Administrative and support and waste management services (%)
Most Common Industries - Educational services, and health care and social assistance (%)
Most Common Industries - Educational services (%)
Most Common Industries - Health care and social assistance (%)
Most Common Industries - Arts, entertainment, and recreation, and accommodation and food services (%)
Most Common Industries - Arts, entertainment, and recreation (%)
Most Common Industries - Accommodation and food services (%)
Most Common Industries - Other services, except public administration (%)
Most Common Industries - Public administration (%)
Occupation diversity
Most Common Occupations - Management, business, science, and arts occupations (%)
Most Common Occupations - Management, business, and financial occupations (%)
Most Common Occupations - Management occupations (%)
Most Common Occupations - Business and financial operations occupations (%)
Most Common Occupations - Computer, engineering, and science occupations (%)
Most Common Occupations - Computer and mathematical occupations (%)
Most Common Occupations - Architecture and engineering occupations (%)
Most Common Occupations - Life, physical, and social science occupations (%)
Most Common Occupations - Education, legal, community service, arts, and media occupations (%)
Most Common Occupations - Community and social service occupations (%)
Most Common Occupations - Legal occupations (%)
Most Common Occupations - Education, training, and library occupations (%)
Most Common Occupations - Arts, design, entertainment, sports, and media occupations (%)
Most Common Occupations - Healthcare practitioners and technical occupations (%)
Most Common Occupations - Health diagnosing and treating practitioners and other technical occupations (%)
Most Common Occupations - Health technologists and technicians (%)
Most Common Occupations - Service occupations (%)
Most Common Occupations - Healthcare support occupations (%)
Most Common Occupations - Protective service occupations (%)
Most Common Occupations - Fire fighting and prevention, and other protective service workers including supervisors (%)
Most Common Occupations - Law enforcement workers including supervisors (%)
Most Common Occupations - Food preparation and serving related occupations (%)
Most Common Occupations - Building and grounds cleaning and maintenance occupations (%)
Most Common Occupations - Personal care and service occupations (%)
Most Common Occupations - Sales and office occupations (%)
Most Common Occupations - Sales and related occupations (%)
Most Common Occupations - Office and administrative support occupations (%)
Most Common Occupations - Natural resources, construction, and maintenance occupations (%)
Most Common Occupations - Farming, fishing, and forestry occupations (%)
Most Common Occupations - Construction and extraction occupations (%)
Most Common Occupations - Installation, maintenance, and repair occupations (%)
Most Common Occupations - Production, transportation, and material moving occupations (%)
Most Common Occupations - Production occupations (%)
Most Common Occupations - Transportation occupations (%)
Most Common Occupations - Material moving occupations (%)
People in Group quarters - Institutionalized population (%)
People in Group quarters - Correctional institutions (%)
People in Group quarters - Federal prisons and detention centers (%)
People in Group quarters - Halfway houses (%)
People in Group quarters - Local jails and other confinement facilities (including police lockups) (%)
People in Group quarters - Military disciplinary barracks (%)
People in Group quarters - State prisons (%)
People in Group quarters - Other types of correctional institutions (%)
People in Group quarters - Nursing homes (%)
People in Group quarters - Hospitals/wards, hospices, and schools for the handicapped (%)
People in Group quarters - Hospitals/wards and hospices for chronically ill (%)
People in Group quarters - Hospices or homes for chronically ill (%)
People in Group quarters - Military hospitals or wards for chronically ill (%)
People in Group quarters - Other hospitals or wards for chronically ill (%)
People in Group quarters - Hospitals or wards for drug/alcohol abuse (%)
People in Group quarters - Mental (Psychiatric) hospitals or wards (%)
People in Group quarters - Schools, hospitals, or wards for the mentally retarded (%)
People in Group quarters - Schools, hospitals, or wards for the physically handicapped (%)
People in Group quarters - Institutions for the deaf (%)
People in Group quarters - Institutions for the blind (%)
People in Group quarters - Orthopedic wards and institutions for the physically handicapped (%)
People in Group quarters - Wards in general hospitals for patients who have no usual home elsewhere (%)
People in Group quarters - Wards in military hospitals for patients who have no usual home elsewhere (%)
People in Group quarters - Juvenile institutions (%)
People in Group quarters - Long-term care (%)
People in Group quarters - Homes for abused, dependent, and neglected children (%)
People in Group quarters - Residential treatment centers for emotionally disturbed children (%)
People in Group quarters - Training schools for juvenile delinquents (%)
People in Group quarters - Short-term care, detention or diagnostic centers for delinquent children (%)
People in Group quarters - Type of juvenile institution unknown (%)
People in Group quarters - Noninstitutionalized population (%)
People in Group quarters - College dormitories (includes college quarters off campus) (%)
People in Group quarters - Military quarters (%)
People in Group quarters - On base (%)
People in Group quarters - Barracks, unaccompanied personnel housing (UPH), (Enlisted/Officer), ;and similar group living quarters for military personnel (%)
People in Group quarters - Transient quarters for temporary residents (%)
People in Group quarters - Military ships (%)
People in Group quarters - Group homes (%)
People in Group quarters - Homes or halfway houses for drug/alcohol abuse (%)
People in Group quarters - Homes for the mentally ill (%)
People in Group quarters - Homes for the mentally retarded (%)
People in Group quarters - Homes for the physically handicapped (%)
People in Group quarters - Other group homes (%)
People in Group quarters - Religious group quarters (%)
People in Group quarters - Dormitories (%)
People in Group quarters - Agriculture workers' dormitories on farms (%)
People in Group quarters - Job Corps and vocational training facilities (%)
People in Group quarters - Other workers' dormitories (%)
People in Group quarters - Crews of maritime vessels (%)
People in Group quarters - Other nonhousehold living situations (%)
People in Group quarters - Other noninstitutional group quarters (%)
Residents speaking English at home (%)
Residents speaking English at home - Born in the United States (%)
Residents speaking English at home - Native, born elsewhere (%)
Residents speaking English at home - Foreign born (%)
Residents speaking Spanish at home (%)
Residents speaking Spanish at home - Born in the United States (%)
Residents speaking Spanish at home - Native, born elsewhere (%)
Residents speaking Spanish at home - Foreign born (%)
Residents speaking other language at home (%)
Residents speaking other language at home - Born in the United States (%)
Residents speaking other language at home - Native, born elsewhere (%)
Residents speaking other language at home - Foreign born (%)
Class of Workers - Employee of private company (%)
Class of Workers - Self-employed in own incorporated business (%)
Class of Workers - Private not-for-profit wage and salary workers (%)
Class of Workers - Local government workers (%)
Class of Workers - State government workers (%)
Class of Workers - Federal government workers (%)
Class of Workers - Self-employed workers in own not incorporated business and Unpaid family workers (%)
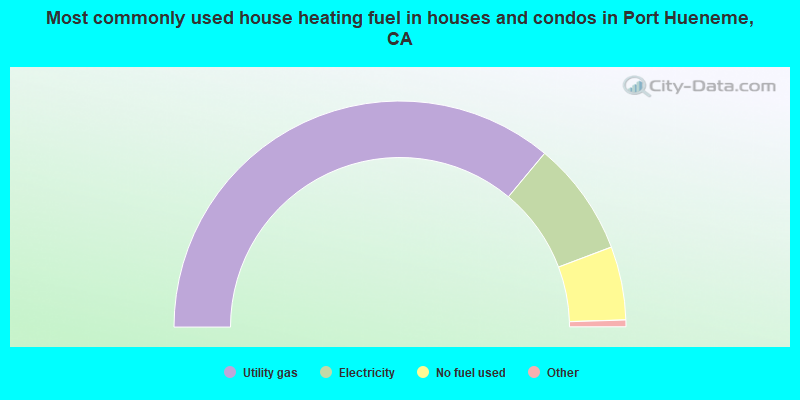
House heating fuel used in houses and condos - Utility gas (%)
House heating fuel used in houses and condos - Bottled, tank, or LP gas (%)
House heating fuel used in houses and condos - Electricity (%)
House heating fuel used in houses and condos - Fuel oil, kerosene, etc. (%)
House heating fuel used in houses and condos - Coal or coke (%)
House heating fuel used in houses and condos - Wood (%)
House heating fuel used in houses and condos - Solar energy (%)
House heating fuel used in houses and condos - Other fuel (%)
House heating fuel used in houses and condos - No fuel used (%)
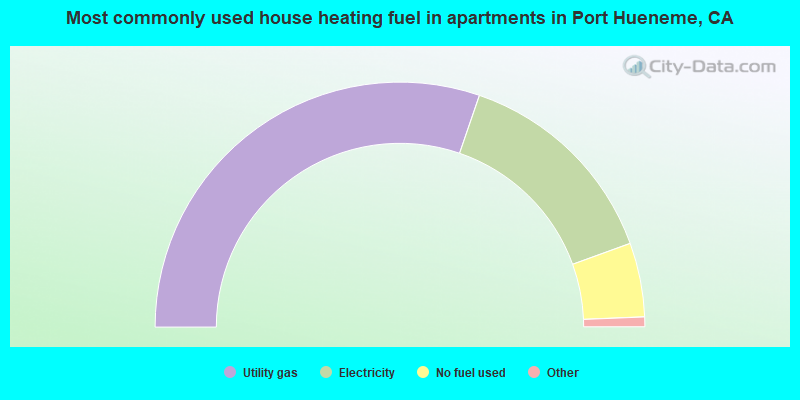
House heating fuel used in apartments - Utility gas (%)
House heating fuel used in apartments - Bottled, tank, or LP gas (%)
House heating fuel used in apartments - Electricity (%)
House heating fuel used in apartments - Fuel oil, kerosene, etc. (%)
House heating fuel used in apartments - Coal or coke (%)
House heating fuel used in apartments - Wood (%)
House heating fuel used in apartments - Solar energy (%)
House heating fuel used in apartments - Other fuel (%)
House heating fuel used in apartments - No fuel used (%)
Armed forces status - In Armed Forces (%)
Armed forces status - Civilian (%)
Armed forces status - Civilian - Veteran (%)
Armed forces status - Civilian - Nonveteran (%)
Fatal accidents locations in years 2005-2021
Fatal accidents locations in 2005
Fatal accidents locations in 2006
Fatal accidents locations in 2007
Fatal accidents locations in 2008
Fatal accidents locations in 2009
Fatal accidents locations in 2010
Fatal accidents locations in 2011
Fatal accidents locations in 2012
Fatal accidents locations in 2013
Fatal accidents locations in 2014
Fatal accidents locations in 2015
Fatal accidents locations in 2016
Fatal accidents locations in 2017
Fatal accidents locations in 2018
Fatal accidents locations in 2019
Fatal accidents locations in 2020
Fatal accidents locations in 2021
Alcohol use - People drinking some alcohol every month (%)
Alcohol use - People not drinking at all (%)
Alcohol use - Average days/month drinking alcohol
Alcohol use - Average drinks/week
Alcohol use - Average days/year people drink much
Audiometry - Average condition of hearing (%)
Audiometry - People that can hear a whisper from across a quiet room (%)
Audiometry - People that can hear normal voice from across a quiet room (%)
Audiometry - Ears ringing, roaring, buzzing (%)
Audiometry - Had a job exposure to loud noise (%)
Audiometry - Had off-work exposure to loud noise (%)
Blood Pressure & Cholesterol - Has high blood pressure (%)
Blood Pressure & Cholesterol - Checking blood pressure at home (%)
Blood Pressure & Cholesterol - Frequently checking blood cholesterol (%)
Blood Pressure & Cholesterol - Has high cholesterol level (%)
Consumer Behavior - Money monthly spent on food at supermarket/grocery store
Consumer Behavior - Money monthly spent on food at other stores
Consumer Behavior - Money monthly spent on eating out
Consumer Behavior - Money monthly spent on carryout/delivered foods
Consumer Behavior - Income spent on food at supermarket/grocery store (%)
Consumer Behavior - Income spent on food at other stores (%)
Consumer Behavior - Income spent on eating out (%)
Consumer Behavior - Income spent on carryout/delivered foods (%)
Current Health Status - General health condition (%)
Current Health Status - Blood donors (%)
Current Health Status - Has blood ever tested for HIV virus (%)
Current Health Status - Left-handed people (%)
Dermatology - People using sunscreen (%)
Diabetes - Diabetics (%)
Diabetes - Had a blood test for high blood sugar (%)
Diabetes - People taking insulin (%)
Diet Behavior & Nutrition - Diet health (%)
Diet Behavior & Nutrition - Milk product consumption (# of products/month)
Diet Behavior & Nutrition - Meals not home prepared (#/week)
Diet Behavior & Nutrition - Meals from fast food or pizza place (#/week)
Diet Behavior & Nutrition - Ready-to-eat foods (#/month)
Diet Behavior & Nutrition - Frozen meals/pizza (#/month)
Drug Use - People that ever used marijuana or hashish (%)
Drug Use - Ever used hard drugs (%)
Drug Use - Ever used any form of cocaine (%)
Drug Use - Ever used heroin (%)
Drug Use - Ever used methamphetamine (%)
Health Insurance - People covered by health insurance (%)
Kidney Conditions-Urology - Avg. # of times urinating at night
Medical Conditions - People with asthma (%)
Medical Conditions - People with anemia (%)
Medical Conditions - People with psoriasis (%)
Medical Conditions - People with overweight (%)
Medical Conditions - Elderly people having difficulties in thinking or remembering (%)
Medical Conditions - People who ever received blood transfusion (%)
Medical Conditions - People having trouble seeing even with glass/contacts (%)
Medical Conditions - People with arthritis (%)
Medical Conditions - People with gout (%)
Medical Conditions - People with congestive heart failure (%)
Medical Conditions - People with coronary heart disease (%)
Medical Conditions - People with angina pectoris (%)
Medical Conditions - People who ever had heart attack (%)
Medical Conditions - People who ever had stroke (%)
Medical Conditions - People with emphysema (%)
Medical Conditions - People with thyroid problem (%)
Medical Conditions - People with chronic bronchitis (%)
Medical Conditions - People with any liver condition (%)
Medical Conditions - People who ever had cancer or malignancy (%)
Mental Health - People who have little interest in doing things (%)
Mental Health - People feeling down, depressed, or hopeless (%)
Mental Health - People who have trouble sleeping or sleeping too much (%)
Mental Health - People feeling tired or having little energy (%)
Mental Health - People with poor appetite or overeating (%)
Mental Health - People feeling bad about themself (%)
Mental Health - People who have trouble concentrating on things (%)
Mental Health - People moving or speaking slowly or too fast (%)
Mental Health - People having thoughts they would be better off dead (%)
Oral Health - Average years since last visit a dentist
Oral Health - People embarrassed because of mouth (%)
Oral Health - People with gum disease (%)
Oral Health - General health of teeth and gums (%)
Oral Health - Average days a week using dental floss/device
Oral Health - Average days a week using mouthwash for dental problem
Oral Health - Average number of teeth
Pesticide Use - Households using pesticides to control insects (%)
Pesticide Use - Households using pesticides to kill weeds (%)
Physical Activity - People doing vigorous-intensity work activities (%)
Physical Activity - People doing moderate-intensity work activities (%)
Physical Activity - People walking or bicycling (%)
Physical Activity - People doing vigorous-intensity recreational activities (%)
Physical Activity - People doing moderate-intensity recreational activities (%)
Physical Activity - Average hours a day doing sedentary activities
Physical Activity - Average hours a day watching TV or videos
Physical Activity - Average hours a day using computer
Physical Functioning - People having limitations keeping them from working (%)
Physical Functioning - People limited in amount of work they can do (%)
Physical Functioning - People that need special equipment to walk (%)
Physical Functioning - People experiencing confusion/memory problems (%)
Physical Functioning - People requiring special healthcare equipment (%)
Prescription Medications - Average number of prescription medicines taking
Preventive Aspirin Use - Adults 40+ taking low-dose aspirin (%)
Reproductive Health - Vaginal deliveries (%)
Reproductive Health - Cesarean deliveries (%)
Reproductive Health - Deliveries resulted in a live birth (%)
Reproductive Health - Pregnancies resulted in a delivery (%)
Reproductive Health - Women breastfeeding newborns (%)
Reproductive Health - Women that had a hysterectomy (%)
Reproductive Health - Women that had both ovaries removed (%)
Reproductive Health - Women that have ever taken birth control pills (%)
Reproductive Health - Women taking birth control pills (%)
Reproductive Health - Women that have ever used Depo-Provera or injectables (%)
Reproductive Health - Women that have ever used female hormones (%)
Sexual Behavior - People 18+ that ever had sex (vaginal, anal, or oral) (%)
Sexual Behavior - Males 18+ that ever had vaginal sex with a woman (%)
Sexual Behavior - Males 18+ that ever performed oral sex on a woman (%)
Sexual Behavior - Males 18+ that ever had anal sex with a woman (%)
Sexual Behavior - Males 18+ that ever had any sex with a man (%)
Sexual Behavior - Females 18+ that ever had vaginal sex with a man (%)
Sexual Behavior - Females 18+ that ever performed oral sex on a man (%)
Sexual Behavior - Females 18+ that ever had anal sex with a man (%)
Sexual Behavior - Females 18+ that ever had any kind of sex with a woman (%)
Sexual Behavior - Average age people first had sex
Sexual Behavior - Average number of female sex partners in lifetime (males 18+)
Sexual Behavior - Average number of female vaginal sex partners in lifetime (males 18+)
Sexual Behavior - Average age people first performed oral sex on a woman (18+)
Sexual Behavior - Average number of woman performed oral sex on in lifetime (18+)
Sexual Behavior - Average number of male sex partners in lifetime (males 18+)
Sexual Behavior - Average number of male anal sex partners in lifetime (males 18+)
Sexual Behavior - Average age people first performed oral sex on a man (18+)
Sexual Behavior - Average number of male oral sex partners in lifetime (18+)
Sexual Behavior - People using protection when performing oral sex (%)
Sexual Behavior - Average number of times people have vaginal or anal sex a year
Sexual Behavior - People having sex without condom (%)
Sexual Behavior - Average number of male sex partners in lifetime (females 18+)
Sexual Behavior - Average number of male vaginal sex partners in lifetime (females 18+)
Sexual Behavior - Average number of female sex partners in lifetime (females 18+)
Sexual Behavior - Circumcised males 18+ (%)
Sleep Disorders - Average hours sleeping at night
Sleep Disorders - People that has trouble sleeping (%)
Smoking-Cigarette Use - People smoking cigarettes (%)
Taste & Smell - People 40+ having problems with smell (%)
Taste & Smell - People 40+ having problems with taste (%)
Taste & Smell - People 40+ that ever had wisdom teeth removed (%)
Taste & Smell - People 40+ that ever had tonsils teeth removed (%)
Taste & Smell - People 40+ that ever had a loss of consciousness because of a head injury (%)
Taste & Smell - People 40+ that ever had a broken nose or other serious injury to face or skull (%)
Taste & Smell - People 40+ that ever had two or more sinus infections (%)
Weight - Average height (inches)
Weight - Average weight (pounds)
Weight - Average BMI
Weight - People that are obese (%)
Weight - People that ever were obese (%)
Weight - People trying to lose weight (%)
13,865 64.2% Hispanic 5,651 26.2% White alone 933 4.3% Two or more races 633 2.9% Black alone 536 2.5% Asian alone 89 0.4% Other race alone 70 0.3% Native Hawaiian and Other 10 0.05% American Indian alone
Officers per 1,000 residents here:
0.92California average:
2.30
Latest news from Port Hueneme, CA collected exclusively by city-data.com from local newspapers, TV, and radio stations
Ancestries: American (13.8%), German (2.5%), English (1.1%).
Current Local Time:
Land area: 4.45 square miles.
Population density: 4,814 people per square mile (average).
5,395 residents are foreign born (21.1% Latin America ).
This city:
25.0%California:
26.5%
Median real estate property taxes paid for housing units with mortgages in 2022: $4,834 (0.8%)Median real estate property taxes paid for housing units with no mortgage in 2022: $2,875 (0.6%)
Nearest city with pop. 50,000+: Oxnard, CA
Nearest city with pop. 200,000+: Los Angeles, CA
Nearest cities:
Latitude: 34.16 N, Longitude: 119.19 W
Daytime population change due to commuting: +1,134 (+5.2%)Workers who live and work in this city: 2,679 (24.8%)
Area code commonly used in this area: 805
Single-family new house construction building permits:
2022: 5 buildings , average cost: $210,0002021: 4 buildings , average cost: $35,2002020: 1 building , cost: $50,0002014: 22 buildings , average cost: $229,4002013: 23 buildings , average cost: $229,4002012: 40 buildings , average cost: $182,9002010: 8 buildings , average cost: $164,7002008: 14 buildings , average cost: $146,3002007: 13 buildings , average cost: $224,3002005: 19 buildings , average cost: $172,9002004: 49 buildings , average cost: $219,3002003: 24 buildings , average cost: $165,1002002: 5 buildings , average cost: $128,4002001: 33 buildings , average cost: $119,5002000: 40 buildings , average cost: $106,8001999: 1 building , cost: $73,000Unemployment in December 2023:
Population change in the 1990s: +1,235 (+6.0%).
Most common occupations in Port Hueneme, CA (%)
Both Males Females
Other office and administrative support workers, including supervisors (5.1%)
Material recording, scheduling, dispatching, and distributing workers (4.3%)
Other production occupations, including supervisors (3.6%)
Customer service representatives (3.3%)
Building and grounds cleaning and maintenance occupations (3.0%)
Cashiers (2.9%)
Information and record clerks, except customer service representatives (2.9%)
Material recording, scheduling, dispatching, and distributing workers (6.5%)
Electrical equipment mechanics and other installation, maintenance, and repair workers, including supervisors (4.5%)
Building and grounds cleaning and maintenance occupations (4.0%)
Engineers (3.9%)
Driver/sales workers and truck drivers (3.9%)
Other production occupations, including supervisors (3.7%)
Agricultural workers, including supervisors (3.6%)
Other office and administrative support workers, including supervisors (8.0%)
Secretaries and administrative assistants (5.4%)
Customer service representatives (4.9%)
Information and record clerks, except customer service representatives (4.9%)
Cashiers (4.7%)
Other production occupations, including supervisors (3.5%)
Preschool, kindergarten, elementary, and middle school teachers (3.4%)
Earthquake activity:
Port Hueneme-area historical earthquake activity is significantly above California state average. It is 6579% greater than the overall U.S. average. On 7/21/1952 at 11:52:14, a magnitude 7.7 (7.7 UK, Class: Major, Intensity: VIII - XII) earthquake occurred 59.1 miles away from the city center, causing $50,000,000 total damage On 11/4/1927 at 13:51:53, a magnitude 7.5 (7.5 UK) earthquake occurred 116.9 miles away from the city center On 6/28/1992 at 11:57:34, a magnitude 7.6 (6.2 MB, 7.6 MS, 7.3 MW, Depth: 0.7 mi) earthquake occurred 152.4 miles away from the city center, causing 3 deaths ( 1 shaking deaths, 2 other deaths) and 400 injuries, causing $100,000,000 total damage and $40,000,000 insured lossesOn 10/16/1999 at 09:46:44, a magnitude 7.4 (6.3 MB, 7.4 MS, 7.2 MW, 7.3 ML) earthquake occurred 159.5 miles away from Port Hueneme center On 1/17/1994 at 12:30:55, a magnitude 6.8 (6.4 MB, 6.8 MS, 6.7 MW, Depth: 11.4 mi, Class: Strong, Intensity: VII - IX) earthquake occurred 35.5 miles away from the city center, causing 60 deaths ( 60 shaking deaths) and 7000 injuriesOn 4/18/1906 at 13:12:21, a magnitude 7.9 (7.9 UK) earthquake occurred 340.2 miles away from the city center, causing $524,000,000 total damage Magnitude types: body-wave magnitude (MB), local magnitude (ML), surface-wave magnitude (MS), moment magnitude (MW) Natural disasters: The number of natural disasters in Ventura County (36) is a lot greater than the US average (15).Major Disasters (Presidential) Declared: 24Emergencies Declared: 2Fires: 17, Floods: 16, Storms: 10, Landslides: 5, Mudslides: 4, Winter Storms: 4, Freezes: 2, Heavy Rains: 2, Earthquake: 1, Hurricane: 1, Snow: 1, Tornado: 1, Wind: 1, Other: 1 (Note: some incidents may be assigned to more than one category). Hospitals and medical centers in Port Hueneme: ANACAPA ADVENTIST HOSP (provides emergency services, 307 E CLARA ST) OUR LADY OF GUADALUPE HOME (1474 FIFTH ST) Other hospitals and medical centers near Port Hueneme: SHORELINE CARE CENTER (Nursing Home, about 1 miles away; OXNARD, CA)
MAYWOOD ACRES HEALTHCARE (Nursing Home, about 2 miles away; OXNARD, CA)
FMC-DIALYSIS SERVICES OF CHANNEL ISLANDS (Dialysis Facility, about 2 miles away; OXNARD, CA)
ST THOMAS AQUINAS HOME (Hospital, about 2 miles away; OXNARD, CA)
MITCHELL HOME - L STREET (Hospital, about 3 miles away; OXNARD, CA)
HEALTHWISE HOME CARE SOLUTIONS INC (Home Health Center, about 4 miles away; OXNARD, CA)
STAFF BUILDERS SRVS (Home Health Center, about 4 miles away; OXNARD, CA)
Amtrak stations near Port Hueneme: 3 miles: OXNARD (201 E. 4TH ST.) Services: ticket office, fully wheelchair accessible, enclosed waiting area, public restrooms, public payphones, snack bar, free short-term parking, free long-term parking, call for car rental service, call for taxi service, intercity bus service, public transit connection.
10 miles: VENTURA (HARBOR BLVD. & FIGUEROA ST.) Services: public payphones, call for taxi service.
11 miles: CAMARILLO (30 LEWIS RD.) Services: public payphones, public transit connection.
Colleges/universities with over 2000 students nearest to Port Hueneme:
Oxnard College (about 3 miles; Oxnard, CA ; Full-time enrollment: 3,879)
Ventura College (about 9 miles; Ventura, CA ; FT enrollment: 8,460)
California State University-Channel Islands (about 9 miles; Camarillo, CA ; FT enrollment: 4,163)
California Lutheran University (about 19 miles; Thousand Oaks, CA ; FT enrollment: 4,103)
Moorpark College (about 23 miles; Moorpark, CA ; FT enrollment: 9,338)
Pepperdine University (about 30 miles; Malibu, CA ; FT enrollment: 6,722)
Santa Barbara City College (about 34 miles; Santa Barbara, CA ; FT enrollment: 12,568)
Public elementary/middle schools in Port Hueneme: RICHARD BARD ELEMENTARY Students: 416, Location: 622 E. PLEASANT VALLEY RD., Grades: KG-6)HUENEME ELEMENTARY Students: 341, Location: 354 N. THIRD ST., Grades: KG-6)PARKVIEW ELEMENTARY Location: 1416 SIXTH PL., Grades: KG-6)
SUNKIST ELEMENTARY Location: 1400 TEAKWOOD ST., Grades: KG-6)
Private elementary/middle school in Port Hueneme: HUENEME CHRISTIAN SCHOOL Students: 231, Location: 312 N VENTURA RD, Grades: PK-8)
See full list of schools located in Port Hueneme
Notable locations in Port Hueneme: (A) , Port Hueneme Lighthouse (B) , Seabee Museum (C) , Port Hueneme Historical Museum (D) , Womens Improvement Club of Hueneme (E) , Ventura County Maritime Museum (F) , R D Prueter Library (G) , Port Hueneme Chamber of Commerce (H) , Port Hueneme Administration Building (I) , Ventura County Fire Protection District Station 53 Port Hueneme (J) . Display/hide their locations on the map
Shopping Centers: (1) , Town and Shore Shopping Center (2) , Mandalay Village Marketplace Shopping Center (3) , Beach Port Shopping Center (4) , B and D Shopping Center (5) . Display/hide their locations on the map
Churches in Port Hueneme include: (A) , Port Hueneme Church of Christ (B) , Port Hueneme First Assembly of God Church (C) , Westminster Presbyterian Church (D) . Display/hide their locations on the map
Parks in Port Hueneme include: (1) , Dewar Park (2) , La Jenelle Park (3) , Richard Bard Bubbling Springs Park (4) , Seabee Park (5) , Walter B Moranda Park (6) , Port Hueneme Beach Park (7) . Display/hide their locations on the map
Birthplace of: Josh Towers - 2005 Major League Baseball player (Toronto Blue Jays, born : Feb 26, 1977), Maria Bamford - Actress, Ashli Amari Adams - Actress.
Ventura County has a predicted average indoor radon screening level greater than 4 pCi/L (pico curies per liter) - Highest Potential Drinking water stations with addresses in Port Hueneme and their reported violations in the past:
ODESSA MARKET (Serves OR, Population served: 50, Groundwater):
Past monitoring violations:
9 routine major monitoring violations
2 regular monitoring violations
Average household size: This city:
3.0 peopleCalifornia:
2.9 people
Percentage of family households: This city:
68.2%Whole state:
68.7%
Percentage of households with unmarried partners: This city:
7.2%Whole state:
7.2%
Likely homosexual households (counted as self-reported same-sex unmarried-partner households)
Lesbian couples: 0.5% of all households Gay men: 0.3% of all households
People in group quarters in Port Hueneme in 2010:
826 people in military barracks and dormitories (nondisciplinary)
25 people in residential treatment centers for adults
12 people in group homes intended for adults
5 people in maritime/merchant vessels
People in group quarters in Port Hueneme in 2000:
861 people in military barracks, etc.
127 people in other group homes
28 people in military transient quarters for temporary residents
25 people in homes for the mentally retarded
3 people in hospitals or wards for drug/alcohol abuse
2 people in crews of maritime vessels
Banks with branches in Port Hueneme (2011 data):
Wells Fargo Bank, National Association: Port Hueneme Branch at 533 W. Channel Islands Boulevard, branch established on 2003/05/05. Info updated 2011/04/05: Bank assets: $1,161,490.0 mil, Deposits: $905,653.0 mil, headquarters in Sioux Falls, SD, positive income , 6395 total offices , Holding Company: Wells Fargo & Company
Santa Barbara Bank & Trust, National Association: Channel Islands Branch at 583 West Channel Islands Boulevard, branch established on 1998/03/23. Info updated 2011/06/09: Bank assets: $5,847.9 mil, Deposits: $4,684.3 mil, headquarters in Santa Barbara, CA, positive income , Commercial Lending Specialization, 48 total offices , Holding Company: Sb Acquisition Company, Llc
Citibank, National Association: 739 West Channel Islands Boulevard B at 739 West Channel Islands Boulevard, branch established on 1945/01/01. Info updated 2012/01/10: Bank assets: $1,288,658.0 mil, Deposits: $882,541.0 mil, headquarters in Sioux Falls, SD, positive income , International Specialization, 1048 total offices , Holding Company: Citigroup Inc.
Armed Forces Bank of California, National Association: Hueneme Office Branch at 130 23rd Avenue, branch established on 2004/11/01. Info updated 2009/07/22: Bank assets: $25.7 mil, Deposits: $19.7 mil, headquarters in San Diego, CA, positive income , 8 total offices , Holding Company: Dickinson Financial Corporation Ii
Bank of America, National Association: Port Hueneme Branch at 755 West Channel Islands Boulevard, branch established on 1971/05/13. Info updated 2009/11/18: Bank assets: $1,451,969.3 mil, Deposits: $1,077,176.8 mil, headquarters in Charlotte, NC, positive income , 5782 total offices , Holding Company: Bank Of America Corporation
JPMorgan Chase Bank, National Association: Port Hueneme Office at 619 W Channelisland Blvd, branch established on 1991/03/04. Info updated 2011/11/10: Bank assets: $1,811,678.0 mil, Deposits: $1,190,738.0 mil, headquarters in Columbus, OH, positive income , International Specialization, 5577 total offices , Holding Company: Jpmorgan Chase & Co.
For population 15 years and over in Port Hueneme:
Never married: 39.1%Now married: 43.5%Separated: 1.2%Widowed: 5.3%Divorced: 11.0% For population 25 years and over in Port Hueneme:
High school or higher: 77.8%Bachelor's degree or higher: 20.1%Graduate or professional degree: 5.4%Unemployed: 5.7%Mean travel time to work (commute): 20.6 minutes
Education Gini index (Inequality in education) Here:
17.0California average:
15.5
Religion statistics for Port Hueneme, CA (based on Ventura County data)
Religion Adherents Congregations Catholic 232,571 20 Evangelical Protestant 73,341 268 Other 37,398 118 Mainline Protestant 22,006 65 Black Protestant 1,986 4 Orthodox 1,680 7 None 454,336 -
Source: Clifford Grammich, Kirk Hadaway, Richard Houseal, Dale E.Jones, Alexei Krindatch, Richie Stanley and Richard H.Taylor. 2012. 2010 U.S.Religion Census: Religious Congregations & Membership Study. Association of Statisticians of American Religious Bodies. Jones, Dale E., et al. 2002. Congregations and Membership in the United States 2000. Nashville, TN: Glenmary Research Center. Graphs represent county-level data
Food Environment Statistics: Number of grocery stores : 156This county :
1.97 / 10,000 pop.California :
2.14 / 10,000 pop.
Number of supercenters and club stores : 4This county :
0.05 / 10,000 pop.California :
0.04 / 10,000 pop.
Number of convenience stores (no gas) : 45Ventura County :
0.57 / 10,000 pop.California :
0.62 / 10,000 pop.
Number of convenience stores (with gas) : 134Ventura County :
1.69 / 10,000 pop.State :
1.49 / 10,000 pop.
Number of full-service restaurants : 577This county :
7.28 / 10,000 pop.California :
7.42 / 10,000 pop.
Adult diabetes rate : Ventura County :
7.4%California :
7.3%
Adult obesity rate : Ventura County :
23.1%California :
21.3%
Low-income preschool obesity rate : Ventura County :
19.0%California :
17.9%
Health and Nutrition: Healthy diet rate : This city:
48.4%California:
49.4%
Average overall health of teeth and gums : Average BMI : Port Hueneme:
28.3California:
28.1
People feeling badly about themselves : This city:
20.4%California:
20.2%
People not drinking alcohol at all : Here:
11.4%California:
11.2%
Average hours sleeping at night : Overweight people : This city:
31.2%State:
31.5%
General health condition : Port Hueneme:
55.8%California:
56.4%
Average condition of hearing : This city:
81.2%California:
80.9%
More about Health and Nutrition of Port Hueneme, CA Residents
Local government employment and payroll (March 2022)
Function
Full-time employees
Monthly full-time payroll
Average yearly full-time wage
Part-time employees
Monthly part-time payroll
Police Protection - Officers
19 $238,606 $150,699 0 $0 Other and Unallocable
14 $98,394 $84,338 4 $11,011 Police - Other
11 $88,331 $96,361 2 $1,798 Financial Administration
10 $70,677 $84,812 0 $0 Solid Waste Management
10 $65,715 $78,858 1 $1,142 Streets and Highways
8 $61,564 $92,346 0 $0 Water Supply
7 $44,533 $76,342 0 $0 Natural Resources
7 $59,403 $101,834 0 $0 Housing and Community Development (Local)
5 $31,598 $75,835 1 $240 Sewerage
5 $33,456 $80,294 0 $0 Other Government Administration
4 $49,978 $149,934 5 $3,839 Parks and Recreation
2 $16,327 $97,962 5 $4,527
Totals for Government
102 $858,580 $101,009 18 $22,557
Port Hueneme government finances - Expenditure in 2017 (per resident):
Construction - Regular Highways: $1,963,000 ($91.70)
Solid Waste Management: $610,000 ($28.50)Sewerage: $313,000 ($14.62)Current Operations - Police Protection: $6,136,000 ($286.64)
Water Utilities: $5,522,000 ($257.95)Central Staff Services: $4,868,000 ($227.40)Housing and Community Development: $3,755,000 ($175.41)Regular Highways: $2,368,000 ($110.62)Solid Waste Management: $2,232,000 ($104.26)Sewerage: $1,943,000 ($90.76)Financial Administration: $1,490,000 ($69.60)Parks and Recreation: $486,000 ($22.70)Protective Inspection and Regulation - Other: $448,000 ($20.93)General - Other: $10,000 ($0.47)General - Interest on Debt: $481,000 ($22.47)
Other Capital Outlay - General - Other: $545,000 ($25.46)
Solid Waste Management: $109,000 ($5.09)Housing and Community Development: $24,000 ($1.12)
Port Hueneme government finances - Revenue in 2017 (per resident):
Charges - Solid Waste Management: $4,332,000 ($202.36)
Sewerage: $3,716,000 ($173.59)Housing and Community Development: $605,000 ($28.26)Other: $382,000 ($17.84)Regular Highways: $191,000 ($8.92)Parks and Recreation: $53,000 ($2.48)Federal Intergovernmental - Housing and Community Development: $3,596,000 ($167.98)
Other: $27,000 ($1.26)Local Intergovernmental - Water Utilities: $556,000 ($25.97)
Miscellaneous - General Revenue - Other: $2,817,000 ($131.59)
Rents: $2,779,000 ($129.82)Interest Earnings: $1,305,000 ($60.96)Fines and Forfeits: $412,000 ($19.25)Revenue - Water Utilities: $8,139,000 ($380.20)
State Intergovernmental - Highways: $455,000 ($21.25)
Other: $360,000 ($16.82)General Local Government Support: $12,000 ($0.56)Tax - Property: $3,906,000 ($182.46)
General Sales and Gross Receipts: $2,017,000 ($94.22)Public Utilities Sales: $1,490,000 ($69.60)Other Selective Sales: $560,000 ($26.16)Occupation and Business License - Other: $530,000 ($24.76)Other License: $195,000 ($9.11)Documentary and Stock Transfer: $80,000 ($3.74)
Port Hueneme government finances - Debt in 2017 (per resident):
Long Term Debt - Beginning Outstanding - Unspecified Public Purpose: $10,176,000 ($475.36)
Outstanding Unspecified Public Purpose: $9,348,000 ($436.68)Retired Unspecified Public Purpose: $829,000 ($38.73)
Port Hueneme government finances - Cash and Securities in 2017 (per resident):
Other Funds - Cash and Securities: $51,845,000 ($2421.87)
4.96% of this county's 2021 resident taxpayers lived in other counties in 2020 ($110,211 average adjusted gross income )
Here:
4.96%California average:
5.19%
0.03% of residents moved from foreign countries ($345 average AGI )Ventura County:
0.03%California average:
0.03%
Top counties from which taxpayers relocated into this county between 2020 and 2021:
5.51% of this county's 2020 resident taxpayers moved to other counties in 2021 ($95,405 average adjusted gross income )
Here:
5.51%California average:
6.14%
0.02% of residents moved to foreign countries ($247 average AGI )Ventura County:
0.02%California average:
0.02%
Top counties to which taxpayers relocated from this county between 2020 and 2021:
Businesses in Port Hueneme, CA
Name Count Name Count
99 Cents Only Stores 1 Jamba Juice 1 AT&T 1 KFC 1 Blockbuster 1 Kroger 1 CVS 1 McDonald's 1 Carl\s Jr. 1 Panda Express 1 Curves 1 Pizza Hut 1 DHL 1 Rite Aid 1 Dairy Queen 1 Starbucks 1 Dennys 1 Taco Bell 2 Domino's Pizza 1 U-Haul 1 GNC 1 UPS 1 H&R Block 2 Wendy's 1
Strongest AM radio stations in Port Hueneme:
KVTA (1520 AM; 10 kW; PORT HUENEME, CA; Owner: GOLD COAST BROADCASTING LLC)
KUNX (1590 AM; 5 kW; VENTURA, CA; Owner: GOLD COAST BROADCASTING LLC)
KACD (850 AM; 25 kW; THOUSAND OAKS, CA; Owner: CITICASTERS LICENSES, L.P.)
KOXR (910 AM; 5 kW; OXNARD, CA; Owner: LAZER BROADCASTING CORPORATION)
KSPN (710 AM; 50 kW; LOS ANGELES, CA; Owner: KABC-AM RADIO, INC.)
KLAC (570 AM; 50 kW; LOS ANGELES, CA; Owner: AMFM RADIO LICENSES, L.L.C.)
KNX (1070 AM; 50 kW; LOS ANGELES, CA; Owner: INFINITY BROADCASTING OPERATIONS, INC.)
KFWB (980 AM; 50 kW; LOS ANGELES, CA; Owner: INFINITY BROADCASTING OPERATIONS, INC.)
KFI (640 AM; 50 kW; LOS ANGELES, CA; Owner: CAPSTAR TX LIMITED PARTNERSHIP)
KVEN (1450 AM; 1 kW; VENTURA, CA; Owner: CUMULUS LICENSING CORP.)
KIRN (670 AM; 35 kW; SIMI VALLEY, CA; Owner: LOTUS OXNARD CORP.)
KBLA (1580 AM; 50 kW; SANTA MONICA, CA)
KSUR (1260 AM; 25 kW; BEVERLY HILLS, CA)
Strongest FM radio stations in Port Hueneme:
KSSC (107.1 FM; VENTURA, CA; Owner: ENTRAVISION HOLDINGS, LLC)
KDAR (98.3 FM; OXNARD, CA; Owner: ATEP RADIO, INC.)
KBBY-FM (95.1 FM; VENTURA, CA; Owner: CUMULUS LICENSING CORP.)
KCRU (89.1 FM; OXNARD, CA; Owner: SANTA MONICA COMMUNITY COLLEGE DISTRICT)
KCZN (96.7 FM; SANTA PAULA, CA; Owner: LAZER BROADCASTING CORPORATION)
KCAQ (104.7 FM; OXNARD, CA; Owner: GOLD COAST BROADCASTING LLC)
KOCP (95.9 FM; CAMARILLO, CA; Owner: GOLD COAST BROADCASTING LLC)
K272DI (102.3 FM; FILLMORE, CA; Owner: SANTA MONICA COMMUNITY COLLEGE DIST.)
KFYV (105.5 FM; OJAI, CA; Owner: GOLD COAST BROADCASTING LLC)
K271AC (102.1 FM; OJAI, CA; Owner: SANTA MONICA COMMUNITY COLLEGE DIST.)
KMLA (103.7 FM; EL RIO, CA; Owner: GOLD COAST RADIO, L.L.C.)
KHAY (100.7 FM; VENTURA, CA; Owner: CUMULUS LICENSING CORP.)
KLFH (89.5 FM; OJAI, CA; Owner: SHEPHERD COMMUNICATIONS, INC.)
KMRO (90.3 FM; CAMARILLO, CA; Owner: THE ASSOCIATION FOR COMMUNITY EDUCATION, INC.)
KCPB (91.1 FM; THOUSAND OAKS, CA; Owner: UNIVERSITY OF SOUTHERN CALIFORNIA)
K254AH (98.7 FM; ISLA VISTA, CA; Owner: PACIFICA FOUNDATION, INC.)
K210CH (89.9 FM; OAK VIEW, CA; Owner: LIFE ON THE WAY COMMUNICATIONS, INC.)
K293AG (106.5 FM; TAFT, CA; Owner: CENTRO CRISTIANO DE FE, INC.)
KKBT (100.3 FM; LOS ANGELES, CA; Owner: RADIO ONE LICENSES, LLC)
KRAZ (105.9 FM; SANTA YNEZ, CA; Owner: KNIGHT BROADCASTING, INC.)
TV broadcast stations around Port Hueneme:
KTRO-LP (Channel 50; LANCASTER, CA; Owner: ROBERT D. ADELMAN)
KJLA (Channel 57; VENTURA, CA; Owner: KJLA, LLC)
KADY-TV (Channel 63; OXNARD, CA; Owner: BILTMORE BROADCASTING, L.L.C.)
National Bridge Inventory (NBI) Statistics 11 Number of bridges46ft / 14.2m Total length $1,831,000 Total costs6,480 Total average daily traffic167 Total average daily truck traffic7,760 Total future (year 2031) average daily traffic
New bridges - historical statistics
4 1940-1949 1 1950-1959 5 1970-1979 1 1980-1989
See full National Bridge Inventory statistics for Port Hueneme, CA
FCC Registered Cell Phone Towers: 1
157 East Scott Street (12540) (Lat: 34.149333 Lon: -119.198944), Type: Building, Structure height: 21.3 m, Call Sign: KNKA335Assigned Frequencies: 869.040 MHz, 869.040 MHz, 869.040 MHz, 824.040 MHz, 824.040 MHz, 824.040 MHz, 890.010 MHz, 890.010 MHz, 890.010 MHz, 845.010 MHz, 845.010 MHz, 845.010 MHzGrant Date: 09/07/2016, Expiration Date: 10/01/2026, Certifier: Michael P GogginRegistrant: At&t Services, Inc., 208 S Akard St, 20f, Dallas, TX 75202, Phone: (855) 699-7073, Fax: (214) 746-6410, Email:
FCC Registered Antenna Towers: 4
Gina Cacciatore, (2547389) Naval Base Ventura Patterson Road Bldg 401 (Lat: 34.162306 Lon: -119.209028), Type: 18.8, Structure height: 06111 m, Overall height: 18.8 m, Registrant: Los Angeles Smsa Limited Partnership, Network.Regulatory@verizonwireless.Com, Np2ne Network Engineering, Alpha-retta, Phone: (770) 797-1070 Gina Cacciatore, (2547389) Naval Base Ventura Patterson Road Bldg 401 (Lat: 34.162306 Lon: -119.209028), Type: 18.8, Structure height: 06111 m, Overall height: 18.8 m, Registrant: Los Angeles Smsa Limited Partnership, Network.Regulatory@verizonwireless.Com, Np2ne Network Engineering, Alpha-retta, Phone: (770) 797-1070 Gina Cacciatore, (2547389) Naval Base Ventura Patterson Road Bldg 401 (Lat: 34.162306 Lon: -119.209028), Type: 18.8, Structure height: 06111 m, Overall height: 18.8 m, Registrant: Los Angeles Smsa Limited Partnership, Network.Regulatory@verizonwireless.Com, Np2ne Network Engineering, Alpha-retta, Phone: (770) 797-1070 Gina Cacciatore, (2547389) Naval Base Ventura Patterson Road Bldg 401 (Lat: 34.162306 Lon: -119.209028), Type: 18.8, Structure height: 06111 m, Overall height: 18.8 m, Registrant: Los Angeles Smsa Limited Partnership, Network.Regulatory@verizonwireless.Com, Np2ne Network Engineering, Alpha-retta, Phone: (770) 797-1070 FCC Registered Broadcast Land Mobile Towers: 17 (
See the full list of FCC Registered Broadcast Land Mobile Towers in Port Hueneme, CA )
FCC Registered Microwave Towers: 7 (
See the full list of FCC Registered Microwave Towers in this town )
FCC Registered Maritime Coast & Aviation Ground Towers: 8 (
See the full list of FCC Registered Maritime Coast & Aviation Ground Towers )
FCC Registered Amateur Radio Licenses: 118 (
See the full list of FCC Registered Amateur Radio Licenses in Port Hueneme )
FAA Registered Aircraft: 13 (
See the full list of FAA Registered Aircraft in Port Hueneme )
Home Mortgage Disclosure Act Aggregated Statistics For Year 2009(Based on 2 full and 1 partial tracts) A) FHA, FSA/RHS & VA B) Conventional C) Refinancings D) Home Improvement Loans E) Loans on Dwellings For 5+ Families F) Non-occupant Loans on G) Loans On Manufactured Number Average Value Number Average Value Number Average Value Number Average Value Number Average Value Number Average Value Number Average Value
LOANS ORIGINATED 88 $256,315 80 $209,245 126 $229,045 5 $81,674 0 $0 65 $199,869 1 $244,840 APPLICATIONS APPROVED, NOT ACCEPTED 5 $221,144 11 $209,691 15 $212,039 2 $23,620 0 $0 10 $206,829 0 $0 APPLICATIONS DENIED 21 $288,496 22 $222,968 71 $239,733 7 $91,834 0 $0 32 $188,996 1 $274,700 APPLICATIONS WITHDRAWN 11 $262,004 16 $222,091 29 $242,285 3 $38,683 1 $597,180 12 $213,966 0 $0 FILES CLOSED FOR INCOMPLETENESS 2 $273,230 4 $168,382 9 $266,623 0 $0 0 $0 3 $248,827 0 $0
Aggregated Statistics For Year 2008(Based on 2 full and 1 partial tracts) A) FHA, FSA/RHS & VA B) Conventional C) Refinancings D) Home Improvement Loans E) Loans on Dwellings For 5+ Families F) Non-occupant Loans on G) Loans On Manufactured Number Average Value Number Average Value Number Average Value Number Average Value Number Average Value Number Average Value Number Average Value
LOANS ORIGINATED 47 $299,714 114 $203,521 83 $271,618 10 $98,745 0 $0 59 $246,509 1 $44,790 APPLICATIONS APPROVED, NOT ACCEPTED 6 $289,768 24 $225,765 22 $280,801 3 $214,387 0 $0 16 $214,487 2 $125,710 APPLICATIONS DENIED 10 $293,528 42 $236,885 124 $335,857 11 $189,127 2 $1,492,950 25 $238,402 4 $318,992 APPLICATIONS WITHDRAWN 11 $296,379 31 $202,857 30 $311,285 4 $224,158 0 $0 13 $229,140 0 $0 FILES CLOSED FOR INCOMPLETENESS 1 $304,520 4 $279,182 16 $290,317 0 $0 0 $0 4 $232,152 0 $0
Aggregated Statistics For Year 2007(Based on 2 full and 1 partial tracts) A) FHA, FSA/RHS & VA B) Conventional C) Refinancings D) Home Improvement Loans E) Loans on Dwellings For 5+ Families F) Non-occupant Loans on G) Loans On Manufactured Number Average Value Number Average Value Number Average Value Number Average Value Number Average Value Number Average Value Number Average Value
LOANS ORIGINATED 2 $388,665 160 $288,039 276 $302,758 42 $172,179 8 $2,026,058 67 $320,338 1 $258,780 APPLICATIONS APPROVED, NOT ACCEPTED 0 $0 37 $274,082 82 $323,639 8 $190,542 0 $0 15 $300,133 1 $110,480 APPLICATIONS DENIED 0 $0 68 $274,653 232 $374,617 28 $256,898 1 $462,810 40 $323,346 4 $103,510 APPLICATIONS WITHDRAWN 1 $248,820 16 $301,379 72 $346,341 9 $296,643 2 $932,100 7 $190,643 0 $0 FILES CLOSED FOR INCOMPLETENESS 0 $0 4 $142,940 18 $375,491 0 $0 0 $0 2 $322,820 0 $0
Aggregated Statistics For Year 2006(Based on 2 full and 1 partial tracts) A) FHA, FSA/RHS & VA B) Conventional C) Refinancings D) Home Improvement Loans E) Loans on Dwellings For 5+ Families F) Non-occupant Loans on G) Loans On Manufactured Number Average Value Number Average Value Number Average Value Number Average Value Number Average Value Number Average Value Number Average Value
LOANS ORIGINATED 2 $259,775 244 $281,798 407 $324,358 74 $222,032 4 $7,863,908 98 $329,582 3 $158,673 APPLICATIONS APPROVED, NOT ACCEPTED 0 $0 68 $252,769 89 $334,608 11 $318,932 0 $0 21 $307,137 3 $61,563 APPLICATIONS DENIED 0 $0 109 $276,049 211 $352,982 34 $177,518 0 $0 43 $326,226 4 $78,220 APPLICATIONS WITHDRAWN 0 $0 57 $299,601 170 $346,646 17 $243,920 0 $0 22 $325,075 0 $0 FILES CLOSED FOR INCOMPLETENESS 0 $0 11 $307,336 37 $313,494 3 $144,650 0 $0 5 $329,842 0 $0
Aggregated Statistics For Year 2005(Based on 2 full and 1 partial tracts) A) FHA, FSA/RHS & VA B) Conventional C) Refinancings D) Home Improvement Loans E) Loans on Dwellings For 5+ Families F) Non-occupant Loans on G) Loans On Manufactured Number Average Value Number Average Value Number Average Value Number Average Value Number Average Value Number Average Value Number Average Value
LOANS ORIGINATED 0 $0 410 $303,359 513 $299,367 83 $239,812 2 $739,010 147 $299,871 1 $52,990 APPLICATIONS APPROVED, NOT ACCEPTED 0 $0 47 $299,260 89 $275,919 11 $298,084 0 $0 8 $330,806 2 $138,330 APPLICATIONS DENIED 0 $0 132 $294,455 213 $309,059 29 $200,568 1 $2,289,190 30 $331,059 11 $71,495 APPLICATIONS WITHDRAWN 1 $271,970 80 $309,494 173 $302,811 17 $304,365 0 $0 25 $307,170 0 $0 FILES CLOSED FOR INCOMPLETENESS 0 $0 17 $295,731 73 $355,176 1 $334,220 0 $0 6 $286,112 1 $66,840
Aggregated Statistics For Year 2004(Based on 2 full and 1 partial tracts) A) FHA, FSA/RHS & VA B) Conventional C) Refinancings D) Home Improvement Loans E) Loans on Dwellings For 5+ Families F) Non-occupant Loans on G) Loans On Manufactured Number Average Value Number Average Value Number Average Value Number Average Value Number Average Value Number Average Value Number Average Value
LOANS ORIGINATED 1 $234,890 383 $253,753 598 $242,071 70 $172,998 3 $895,770 149 $236,648 3 $37,203 APPLICATIONS APPROVED, NOT ACCEPTED 1 $234,890 43 $241,360 107 $246,368 11 $151,749 0 $0 20 $205,970 2 $92,380 APPLICATIONS DENIED 1 $241,860 87 $241,828 187 $244,175 48 $132,456 0 $0 31 $247,189 6 $63,493 APPLICATIONS WITHDRAWN 0 $0 49 $277,637 185 $238,084 31 $146,084 0 $0 11 $223,037 1 $30,000 FILES CLOSED FOR INCOMPLETENESS 0 $0 17 $251,360 61 $285,426 4 $174,960 0 $0 7 $252,949 0 $0
Aggregated Statistics For Year 2003(Based on 2 full and 1 partial tracts) A) FHA, FSA/RHS & VA B) Conventional C) Refinancings D) Home Improvement Loans E) Loans on Dwellings For 5+ Families F) Non-occupant Loans on Number Average Value Number Average Value Number Average Value Number Average Value Number Average Value Number Average Value
LOANS ORIGINATED 6 $234,393 342 $203,975 949 $181,359 31 $67,927 6 $699,530 208 $173,861 APPLICATIONS APPROVED, NOT ACCEPTED 1 $284,970 42 $198,346 131 $185,099 4 $84,730 1 $273,710 27 $160,026 APPLICATIONS DENIED 2 $208,910 64 $150,965 175 $184,706 22 $54,334 0 $0 16 $186,491 APPLICATIONS WITHDRAWN 0 $0 33 $209,510 240 $178,093 8 $53,180 0 $0 33 $153,281 FILES CLOSED FOR INCOMPLETENESS 0 $0 6 $247,518 41 $183,016 1 $14,930 0 $0 9 $195,823
Aggregated Statistics For Year 2002(Based on 2 full and 1 partial tracts) A) FHA, FSA/RHS & VA B) Conventional C) Refinancings D) Home Improvement Loans E) Loans on Dwellings For 5+ Families F) Non-occupant Loans on Number Average Value Number Average Value Number Average Value Number Average Value Number Average Value Number Average Value
LOANS ORIGINATED 25 $202,578 234 $171,903 615 $162,229 29 $57,977 2 $1,253,580 114 $150,755 APPLICATIONS APPROVED, NOT ACCEPTED 1 $228,920 22 $185,476 94 $175,654 7 $38,771 0 $0 14 $155,323 APPLICATIONS DENIED 0 $0 39 $127,233 134 $172,553 20 $25,089 0 $0 18 $152,553 APPLICATIONS WITHDRAWN 6 $228,657 32 $167,232 193 $163,531 9 $40,120 0 $0 15 $182,751 FILES CLOSED FOR INCOMPLETENESS 0 $0 5 $228,338 24 $156,559 0 $0 0 $0 2 $164,225
Aggregated Statistics For Year 2001(Based on 2 full and 1 partial tracts) A) FHA, FSA/RHS & VA B) Conventional C) Refinancings D) Home Improvement Loans E) Loans on Dwellings For 5+ Families F) Non-occupant Loans on Number Average Value Number Average Value Number Average Value Number Average Value Number Average Value Number Average Value
LOANS ORIGINATED 62 $185,513 264 $138,110 411 $144,837 26 $39,317 3 $371,910 106 $140,695 APPLICATIONS APPROVED, NOT ACCEPTED 1 $194,960 30 $130,318 47 $150,000 7 $54,101 0 $0 8 $99,841 APPLICATIONS DENIED 8 $169,469 39 $141,790 158 $129,734 27 $30,892 2 $1,449,155 23 $141,920 APPLICATIONS WITHDRAWN 10 $183,660 33 $160,659 132 $145,721 16 $45,744 3 $2,152,170 10 $123,885 FILES CLOSED FOR INCOMPLETENESS 0 $0 5 $118,372 32 $137,770 1 $27,850 5 $2,124,966 3 $159,247
Aggregated Statistics For Year 2000(Based on 2 full and 1 partial tracts) A) FHA, FSA/RHS & VA B) Conventional C) Refinancings D) Home Improvement Loans E) Loans on Dwellings For 5+ Families F) Non-occupant Loans on Number Average Value Number Average Value Number Average Value Number Average Value Number Average Value Number Average Value
LOANS ORIGINATED 65 $165,416 206 $121,143 112 $112,829 23 $31,559 0 $0 43 $123,348 APPLICATIONS APPROVED, NOT ACCEPTED 3 $146,650 16 $121,283 26 $105,167 12 $29,682 0 $0 2 $108,985 APPLICATIONS DENIED 8 $164,548 44 $132,115 77 $100,648 31 $26,669 1 $235,890 6 $122,257 APPLICATIONS WITHDRAWN 14 $155,449 21 $123,829 49 $103,590 4 $33,422 0 $0 5 $111,274 FILES CLOSED FOR INCOMPLETENESS 2 $144,815 8 $136,335 14 $107,490 1 $19,500 0 $0 2 $126,405
Aggregated Statistics For Year 1999(Based on 2 full and 3 partial tracts) A) FHA, FSA/RHS & VA B) Conventional C) Refinancings D) Home Improvement Loans E) Loans on Dwellings For 5+ Families F) Non-occupant Loans on Number Average Value Number Average Value Number Average Value Number Average Value Number Average Value Number Average Value
LOANS ORIGINATED 106 $127,593 340 $107,429 319 $114,703 43 $20,913 1 $66,790 113 $96,879 APPLICATIONS APPROVED, NOT ACCEPTED 4 $134,928 26 $111,027 61 $109,996 14 $33,801 2 $290,535 15 $99,143 APPLICATIONS DENIED 8 $138,834 55 $105,854 134 $91,794 26 $18,167 0 $0 21 $85,095 APPLICATIONS WITHDRAWN 8 $146,886 44 $123,882 110 $108,662 3 $40,330 1 $149,070 12 $97,820 FILES CLOSED FOR INCOMPLETENESS 1 $138,420 7 $169,359 24 $114,445 1 $51,060 0 $0 4 $106,930
Detailed HMDA statistics for the following Tracts:
0042.00
, 0043.01 , 0044.00
Private Mortgage Insurance Companies Aggregated Statistics For Year 2009(Based on 1 full and 1 partial tracts) A) Conventional B) Refinancings C) Non-occupant Loans on Number Average Value Number Average Value Number Average Value
LOANS ORIGINATED 18 $244,767 1 $254,380 2 $190,600 APPLICATIONS APPROVED, NOT ACCEPTED 5 $260,592 0 $0 2 $237,875 APPLICATIONS DENIED 1 $242,310 0 $0 0 $0 APPLICATIONS WITHDRAWN 1 $220,960 0 $0 0 $0 FILES CLOSED FOR INCOMPLETENESS 1 $198,680 1 $333,430 0 $0
Aggregated Statistics For Year 2008(Based on 1 full and 1 partial tracts) A) Conventional B) Refinancings C) Non-occupant Loans on Number Average Value Number Average Value Number Average Value
LOANS ORIGINATED 21 $324,499 3 $329,730 2 $230,245 APPLICATIONS APPROVED, NOT ACCEPTED 9 $287,057 5 $377,098 3 $280,343 APPLICATIONS DENIED 7 $242,127 1 $377,860 5 $255,522 APPLICATIONS WITHDRAWN 0 $0 0 $0 0 $0 FILES CLOSED FOR INCOMPLETENESS 0 $0 0 $0 0 $0
Aggregated Statistics For Year 2007(Based on 1 full and 1 partial tracts) A) Conventional B) Refinancings C) Non-occupant Loans on Number Average Value Number Average Value Number Average Value
LOANS ORIGINATED 14 $357,606 9 $499,997 1 $274,700 APPLICATIONS APPROVED, NOT ACCEPTED 1 $350,350 3 $547,083 0 $0 APPLICATIONS DENIED 0 $0 0 $0 0 $0 APPLICATIONS WITHDRAWN 1 $398,120 0 $0 0 $0 FILES CLOSED FOR INCOMPLETENESS 0 $0 0 $0 0 $0
Aggregated Statistics For Year 2006(Based on 1 full and 1 partial tracts) A) Conventional B) Refinancings C) Non-occupant Loans on Number Average Value Number Average Value Number Average Value
LOANS ORIGINATED 1 $247,830 1 $476,750 0 $0 APPLICATIONS APPROVED, NOT ACCEPTED 1 $358,310 1 $352,790 1 $358,310 APPLICATIONS DENIED 0 $0 0 $0 0 $0 APPLICATIONS WITHDRAWN 0 $0 0 $0 0 $0 FILES CLOSED FOR INCOMPLETENESS 0 $0 0 $0 0 $0
Aggregated Statistics For Year 2005(Based on 1 full and 1 partial tracts) A) Conventional B) Refinancings C) Non-occupant Loans on Number Average Value Number Average Value Number Average Value
LOANS ORIGINATED 1 $266,740 4 $450,528 0 $0 APPLICATIONS APPROVED, NOT ACCEPTED 2 $268,730 0 $0 1 $267,740 APPLICATIONS DENIED 0 $0 0 $0 0 $0 APPLICATIONS WITHDRAWN 0 $0 0 $0 0 $0 FILES CLOSED FOR INCOMPLETENESS 0 $0 0 $0 0 $0
Aggregated Statistics For Year 2004(Based on 2 full and 1 partial tracts) A) Conventional B) Refinancings C) Non-occupant Loans on Number Average Value Number Average Value Number Average Value
LOANS ORIGINATED 5 $321,084 4 $214,160 1 $245,840 APPLICATIONS APPROVED, NOT ACCEPTED 1 $256,240 6 $249,987 0 $0 APPLICATIONS DENIED 0 $0 1 $279,680 0 $0 APPLICATIONS WITHDRAWN 1 $270,970 1 $322,480 0 $0 FILES CLOSED FOR INCOMPLETENESS 0 $0 0 $0 0 $0
Aggregated Statistics For Year 2003(Based on 1 full and 1 partial tracts) A) Conventional B) Refinancings C) Non-occupant Loans on Number Average Value Number Average Value Number Average Value
LOANS ORIGINATED 26 $277,236 16 $255,628 6 $230,412 APPLICATIONS APPROVED, NOT ACCEPTED 2 $199,155 7 $217,637 0 $0 APPLICATIONS DENIED 0 $0 1 $229,310 0 $0 APPLICATIONS WITHDRAWN 0 $0 0 $0 0 $0 FILES CLOSED FOR INCOMPLETENESS 0 $0 0 $0 0 $0
Aggregated Statistics For Year 2002(Based on 2 full and 1 partial tracts) A) Conventional B) Refinancings C) Non-occupant Loans on Number Average Value Number Average Value Number Average Value
LOANS ORIGINATED 39 $236,094 17 $196,890 5 $175,400 APPLICATIONS APPROVED, NOT ACCEPTED 6 $204,272 4 $185,070 1 $257,780 APPLICATIONS DENIED 3 $183,467 0 $0 2 $159,250 APPLICATIONS WITHDRAWN 1 $188,110 1 $223,740 0 $0 FILES CLOSED FOR INCOMPLETENESS 0 $0 0 $0 0 $0
Aggregated Statistics For Year 2001(Based on 1 full and 1 partial tracts) A) Conventional B) Refinancings C) Non-occupant Loans on Number Average Value Number Average Value Number Average Value
LOANS ORIGINATED 45 $181,287 19 $185,234 7 $152,693 APPLICATIONS APPROVED, NOT ACCEPTED 3 $141,207 7 $200,523 0 $0 APPLICATIONS DENIED 2 $205,640 3 $182,467 0 $0 APPLICATIONS WITHDRAWN 2 $176,280 1 $149,290 0 $0 FILES CLOSED FOR INCOMPLETENESS 0 $0 0 $0 0 $0
Aggregated Statistics For Year 2000(Based on 1 full and 1 partial tracts) A) Conventional B) Refinancings C) Non-occupant Loans on Number Average Value Number Average Value Number Average Value
LOANS ORIGINATED 46 $160,704 10 $162,810 10 $130,583 APPLICATIONS APPROVED, NOT ACCEPTED 6 $137,095 2 $134,565 0 $0 APPLICATIONS DENIED 7 $142,337 0 $0 1 $94,550 APPLICATIONS WITHDRAWN 2 $203,885 0 $0 0 $0 FILES CLOSED FOR INCOMPLETENESS 0 $0 0 $0 0 $0
Aggregated Statistics For Year 1999(Based on 1 full and 3 partial tracts) A) Conventional B) Refinancings C) Non-occupant Loans on Number Average Value Number Average Value Number Average Value
LOANS ORIGINATED 51 $147,556 37 $158,690 3 $115,107 APPLICATIONS APPROVED, NOT ACCEPTED 5 $140,990 11 $154,325 1 $127,010 APPLICATIONS DENIED 0 $0 2 $93,140 1 $54,210 APPLICATIONS WITHDRAWN 5 $132,304 2 $176,175 0 $0 FILES CLOSED FOR INCOMPLETENESS 1 $143,260 0 $0 0 $0
Detailed PMIC statistics for the following Tracts:
0042.00
, 0043.01 , 0044.00 Fire-safe hotels and motels in Port Hueneme, California:
Country Inn & Suites By Carlson Port Hueneme, 350 E Hueneme Rd, Port Hueneme, California 93041 Phone: (805) 986-5353, Fax: (805) 986-4399
Americas Best Value Inn, 340 E Pleasant Valley Rd, Port Hueneme, California 93041 Phone: (805) 488-5555, Fax: (805) 986-5617
Holiday Inn Express, 350 E Hueneme, Port Hueneme, California 93041 Phone: (805) 986-5353, Fax: (805) 986-4399
All 3 fire-safe hotels and motels in Port Hueneme, California
Most common first names in Port Hueneme, CA among deceased individuals Name Count Lived (average)
John 112 73.3 years Robert 100 72.7 years Mary 83 77.8 years William 72 73.4 years James 68 72.8 years George 59 78.3 years Charles 53 73.7 years Joseph 45 76.2 years Ruth 41 80.2 years Helen 41 78.5 years
Most common last names in Port Hueneme, CA among deceased individuals Last name Count Lived (average)
Smith 43 75.4 years Miller 22 74.7 years Williams 22 78.9 years Brown 22 76.0 years Anderson 19 72.4 years Johnson 17 76.5 years Martin 14 79.1 years Howard 11 77.8 years Scott 11 73.0 years Garcia 11 59.7 years
Port Hueneme compared to California state average:
Unemployed percentage below state average. Black race population percentage below state average. Length of stay since moving in significantly above state average. Port Hueneme on our top lists :
#51 on the list of "Top 101 cities with the largest percentage of people in crews of maritime vessels (population 1,000+)"
#52 on the list of "Top 101 cities with the largest percentage of people in military transient quarters for temporary residents (population 1,000+)"
#94 on the list of "Top 101 cities with the largest percentage of people in military barracks, etc. (population 1,000+)"
#16 on the list of "Top 101 counties with the highest lead air pollution readings in 2012 (µg/m3 )"
#18 on the list of "Top 101 counties with the lowest lead air pollution readings in 2012 (µg/m3 )"
#38 on the list of "Top 101 counties with the highest Particulate Matter (PM10 ) Annual air pollution readings in 2012 (µg/m3 )"
#44 on the list of "Top 101 counties with the highest surface withdrawal of fresh water for public supply (pop. 50,000+)"
#44 on the list of "Top 101 counties with the most Other congregations (pop. 50,000+)"
Top Patent Applicants
Randal L. Hatfield (12)
Steven L. Kaufman (4)
Michael Leung (4)
Jose F. Cuan (3)
Elizabeth Rainbeau (2)
Jason Mcauley (2)
George I. Isaac (2)
Daniel C. Wiggins (2)
Gunter Pfaff (2)
Franz P. Schiffmann (2)
Total of 50 patent applications in 2008-2024.


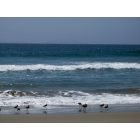
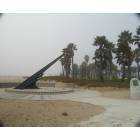
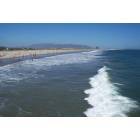
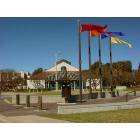
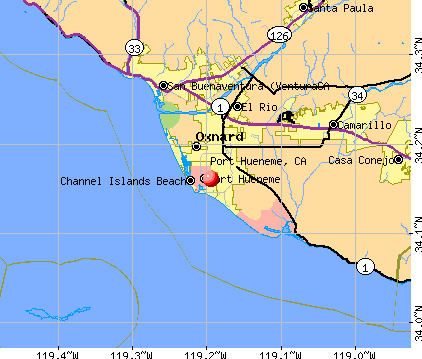


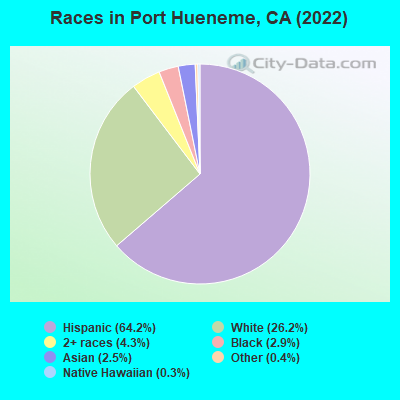
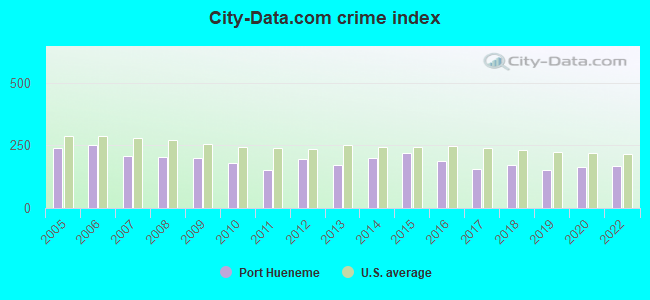
 Recent articles from our blog. Our writers, many of them Ph.D. graduates or candidates, create easy-to-read articles on a wide variety of topics.

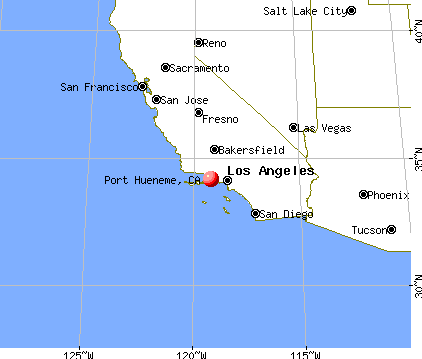
 (2.3 miles
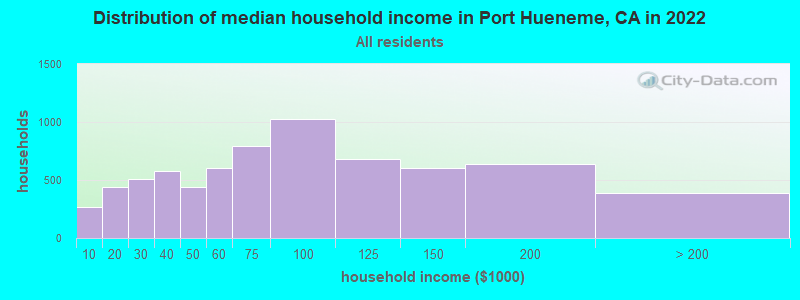
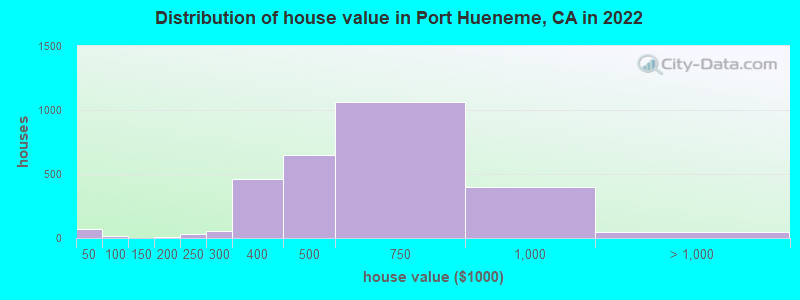
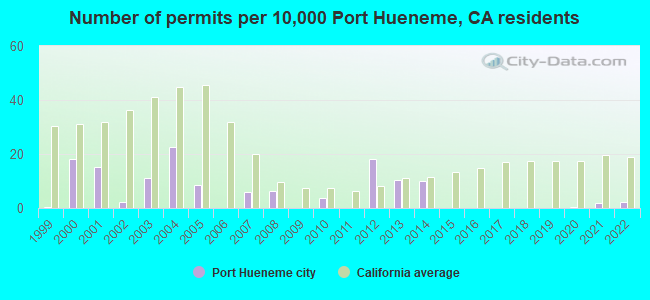
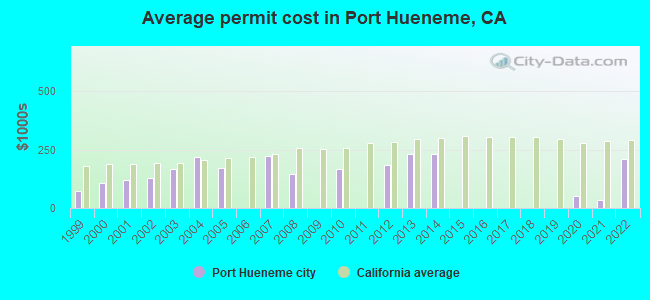

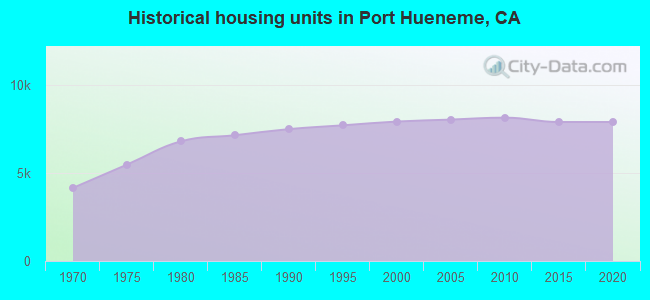
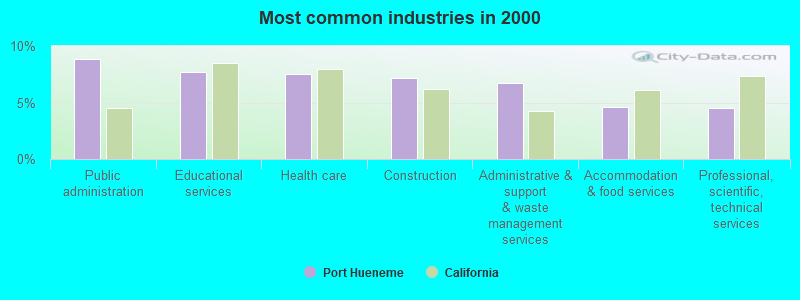
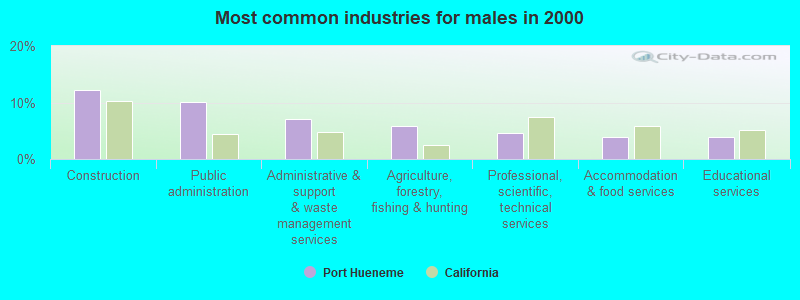
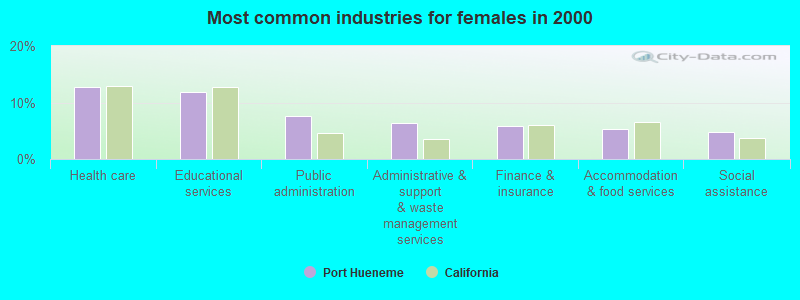
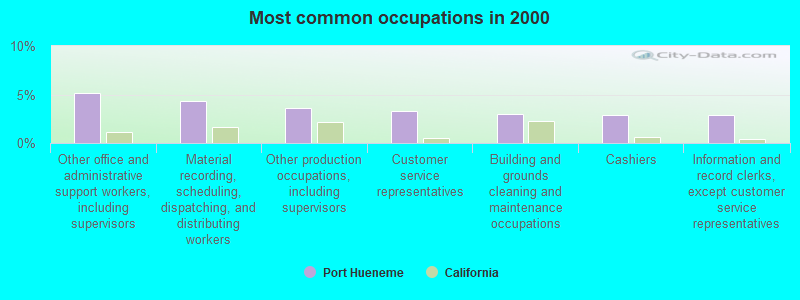
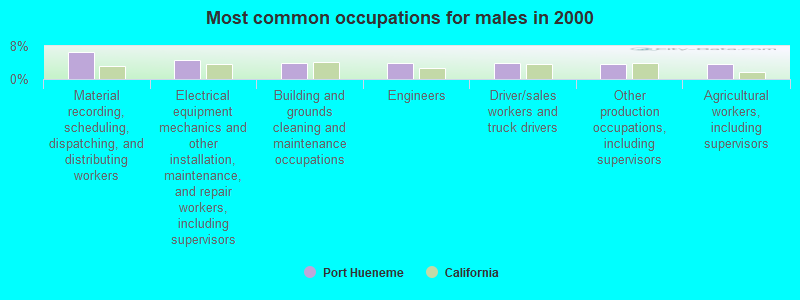
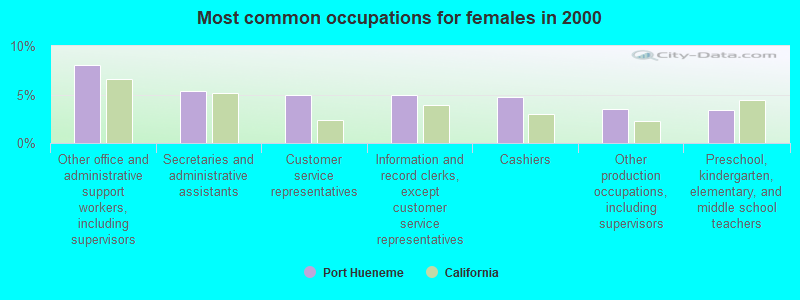
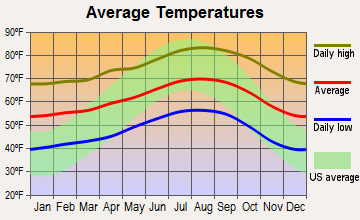
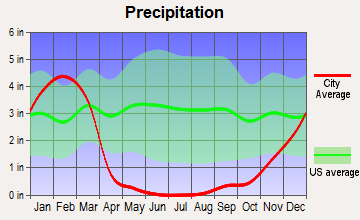
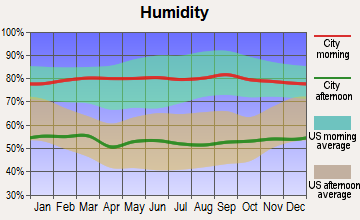
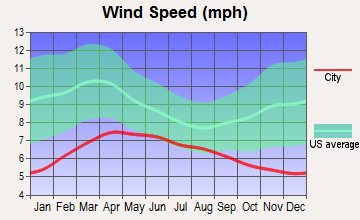
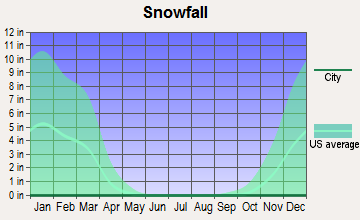
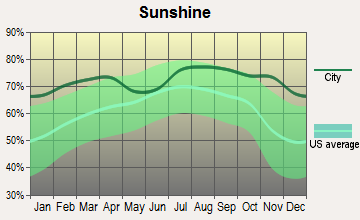
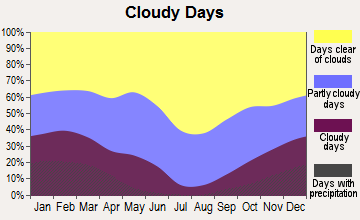
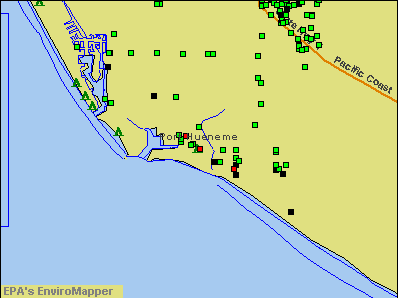

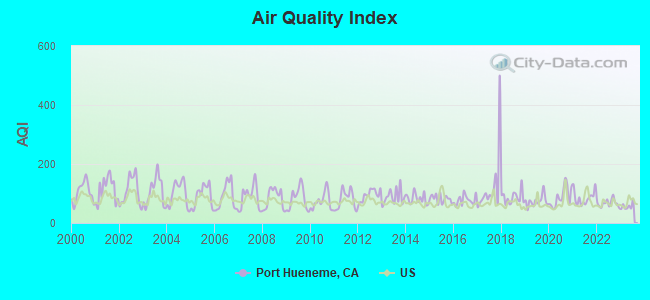
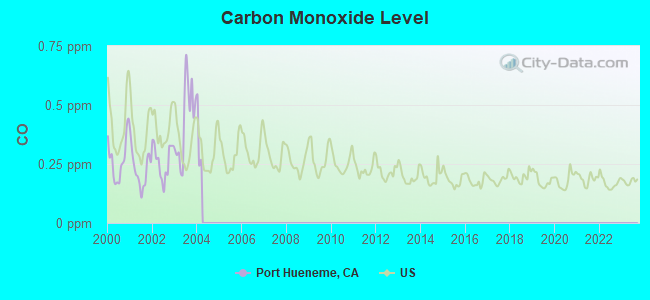
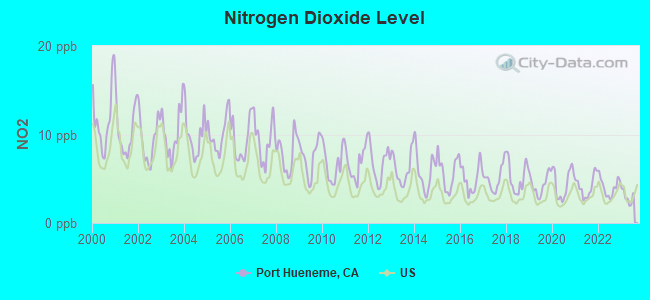
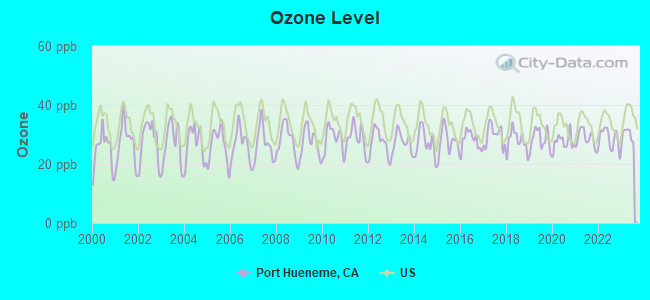
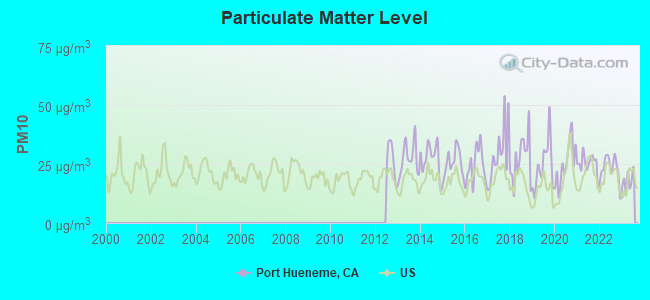
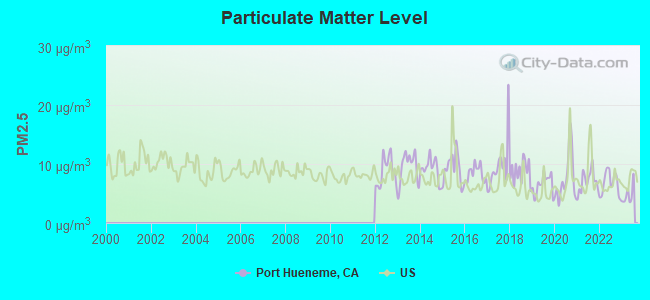
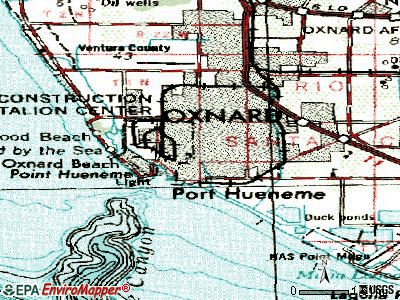
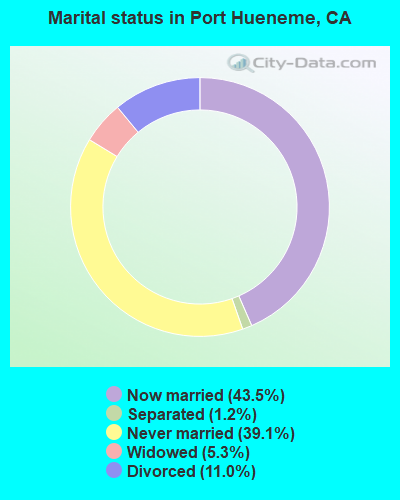
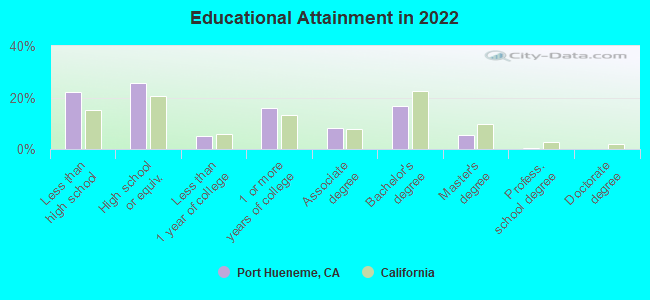
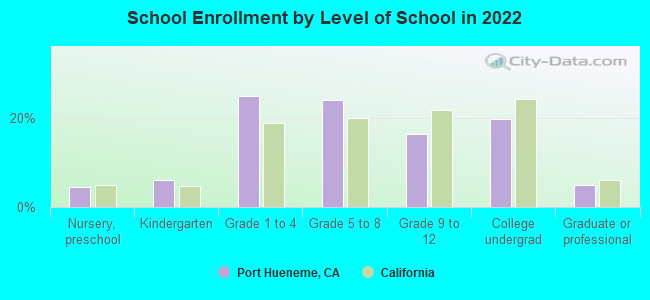
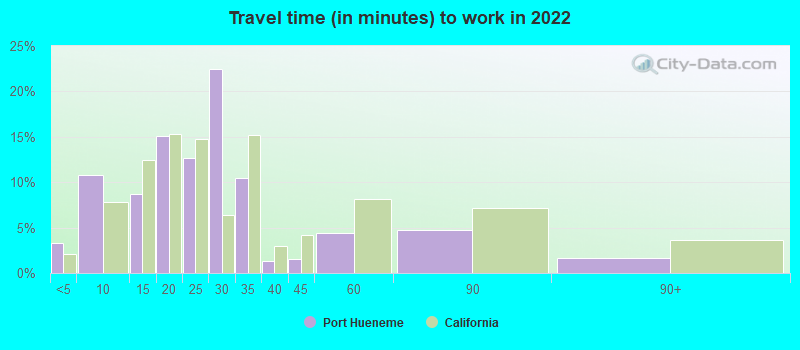
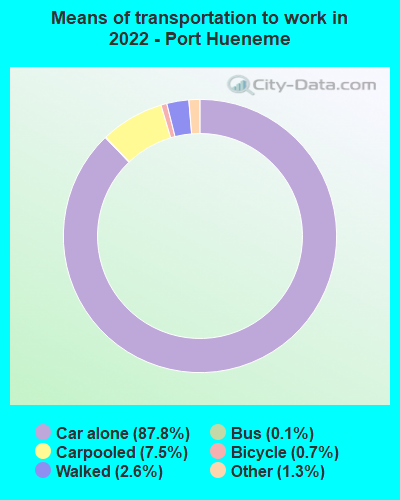
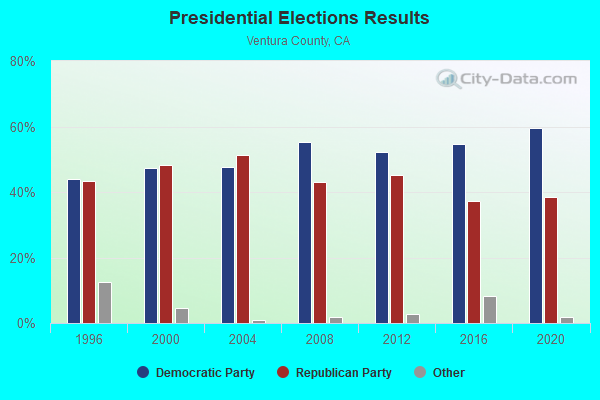
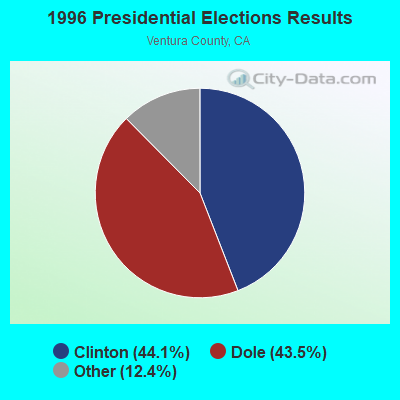
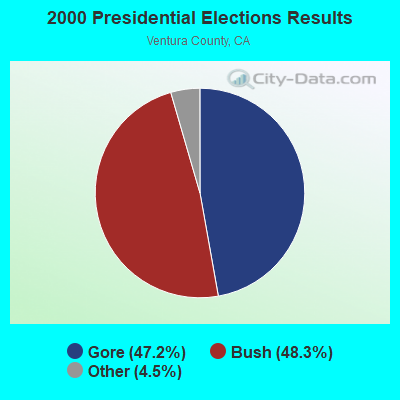
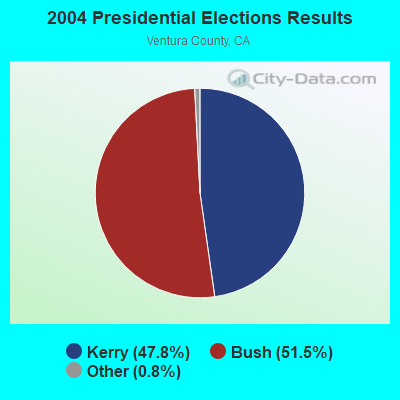
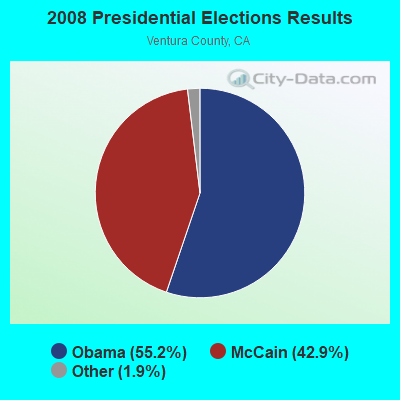
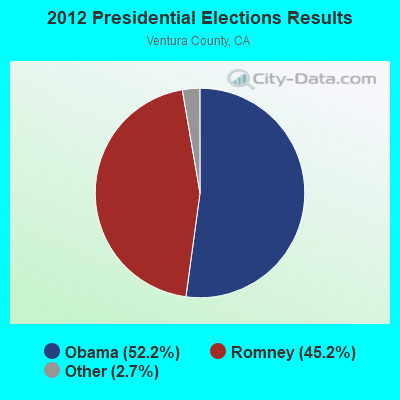
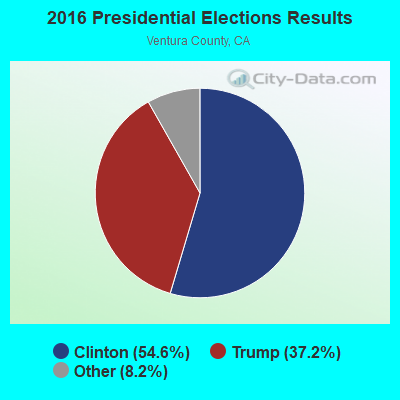
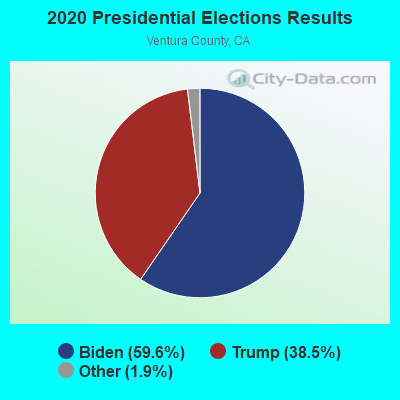
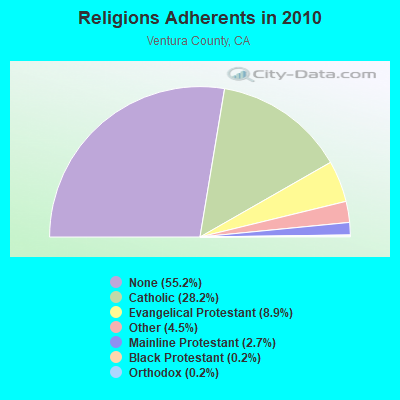
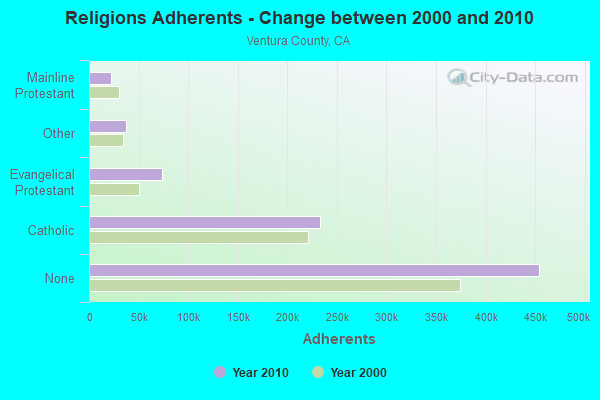
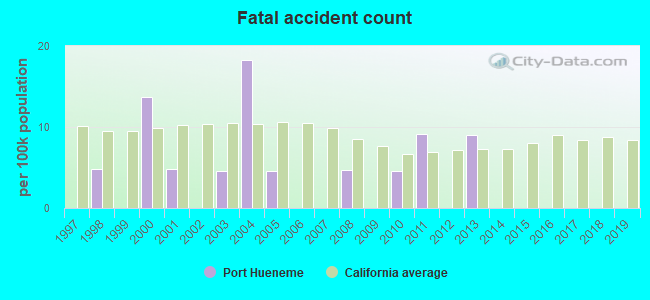
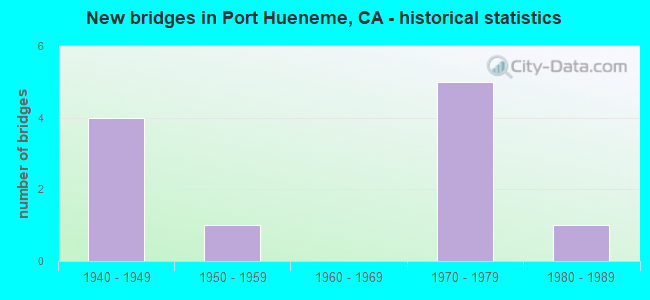
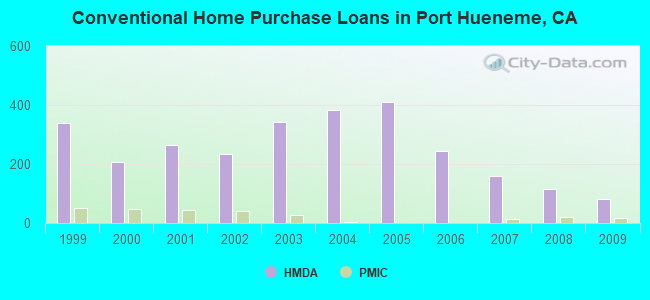
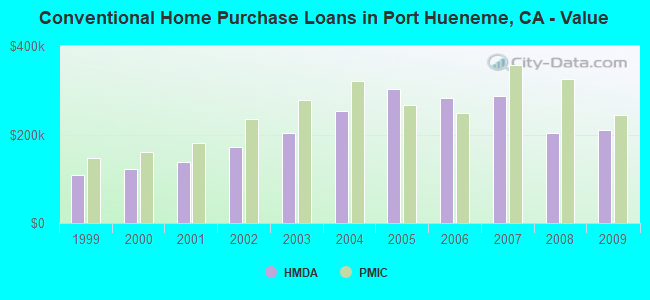
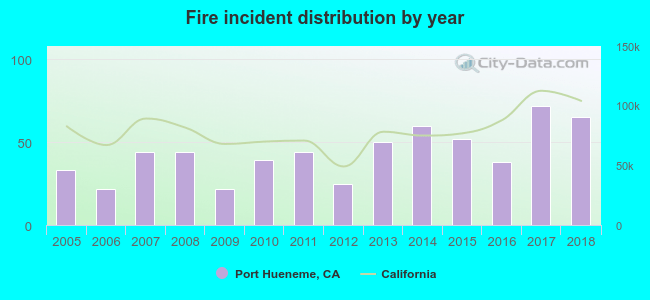 Based on the data from the years 2005 - 2018 the average number of fire incidents per year is 44. The highest number of reported fire incidents - 72 took place in 2017, and the least - 22 in 2006. The data has a rising trend.
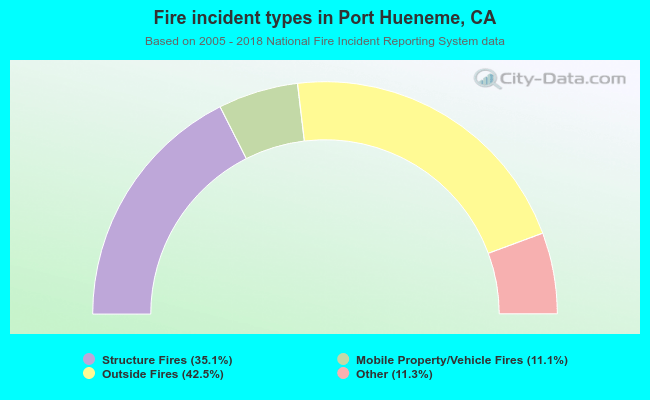 When looking into fire subcategories, the most reports belonged to: Outside Fires (42.5%), and Structure Fires (35.1%).