Seattle, Washington, and Spokane, are both popular places to live and visit in the Pacific Northwest region of the United States. However, each has its distinct characteristics in terms of crime and safety, weather, cost of living, education, and other vital aspects. While Seattle is a bustling coastal city with a vibrant cultural scene, Spokane is a quieter, inland city with a more laid-back pace. So, whether you're considering a move or just a visit, understanding these differences will assist you in making an informed decision.
Distance between
Seattle, WA and
Spokane, WA : 229.1 miles
Seattle's population is larger by 220%. Its population has grown by 170,545 people (30.3%) since 2000. The population of Spokane has grown by 33,442 people (17.1%) during that time.
When comparing Seattle and Spokane, Seattle has a higher crime rate. Both property and violent crimes are more prevalent in Seattle than in Spokane, although it's important to note that crime rates can vary significantly within different neighborhoods in each city. Nonetheless, Spokane has a reputation for being safer overall. Tourists are advised to exercise general precaution in both cities.
City-data.com crime index counts serious crimes and violent crime more heavily. It adjusts for the number of visitors and daily workers commuting into cities. (higher means more crime, U.S. average = 301.1)
City-data.com crime index counts serious crimes and violent crime more heavily. It adjusts for the number of visitors and daily workers commuting into cities. (higher means more crime, U.S. average = 301.1)
Sex Offenders
According to our data, there are 481 registered sex offenders living in Seattle and 325 registered sex offenders living in . The ratio of residents to sex offenders in Seattle is 1,464 to 1; the ratio in Spokane is 665 to 1. The number of registered sex offenders compared to the number of residents is a smaller in Seattle than in Spokane.
Cost of Living
The cost of living in Seattle is considerably higher than in Spokane. This includes essentials like housing, groceries, and healthcare. Seattle's booming tech industry, led by companies like Amazon and Microsoft, has driven up the cost of living.
Income Tax
Washington State, including both Seattle and Spokane, does not impose income tax on its residents.
Property Tax
Property taxes in Seattle tend to be higher than those in Spokane, corresponding to the higher property prices in Seattle.
Sales Tax
The sales tax in Seattle is slightly higher than in Spokane. Washington State has no income tax, making it attractive for those in high-income brackets.
Income
Type
Seattle
Spokane
Estimated median household income
$110,781
$58,714
Estimated per capita income
$74,733
$33,112
Cost of living index (U.S. average is 100)
118.5
94.2
If you make $50,000 in Spokane, you will have to make $62,898 in Seattle to maintain the same standard of living.
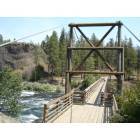
Geographical Conditions
Seattle is a coastal city, known for its stunning waterfront and nearby mountain ranges. Spokane, on the other hand, is an inland city boasting beautiful parks and outdoor recreational areas.
Both cities host well-regarded educational institutions. Seattle, home to the University of Washington, has a higher concentration of residents with a college degree when compared to Spokane. However, Spokane is noted for its public school system and local colleges like Gonzaga University.
Seattle's economy is driven by large tech companies, notably Microsoft and Amazon. On the other hand, Spokane has a diverse economy with a focus on healthcare and education. While Seattle offers higher wages, the increased cost of living might offset these benefits.
Biggest Employers
Seattle's largest employers are Amazon and Microsoft, while in Spokane, the largest employers are the State of Washington and Providence Health & Services.
There were 264 building permits issued in Seattle in 2012 (52 less than in 2011) compared to 346 building permits issued in Spokane in 2012 (170 more than in 2011).
In Seattle (King County), 69.0% voted for Democrats and 28.5% for Republicans in 2012 Presidential Election. In Spokane (Spokane County), 45.4% voted for Democrats and 51.2% for Republicans.
Elections
Type
Democrats
Republicans
Other
Year
Seattle
Spokane
Seattle
Spokane
Seattle
Spokane
2020
75.1%
46.0%
22.3%
50.4%
2.6%
3.6%
2016
70.0%
39.8%
21.1%
48.2%
8.9%
12.0%
2012
69.0%
45.4%
28.5%
51.2%
2.5%
3.4%
2008
70.2%
48.0%
28.1%
49.1%
1.7%
2.9%
2004
65.1%
43.3%
33.8%
55.2%
1.1%
1.6%
2000
60.3%
43.5%
34.5%
52.1%
5.2%
4.5%
1996
56.4%
45.0%
31.4%
41.8%
12.2%
13.1%
Breakdown of population affiliated with a religious congregation
Type
Adherents
Congregations
Religion
Seattle
Spokane
Seattle
Spokane
CATHOLIC CHURCH
14.4%
13.1%
4.9%
6.5%
EVANGELICAL LUTHERAN CHURCH IN AMERICA
1.3%
1.9%
4.7%
4.6%
EPISCOPAL CHURCH
0.8%
0.5%
2.4%
1.7%
AMERICAN BAPTIST CHURCHES IN THE USA
0.6%
0.1%
2.9%
1.9%
MUSLIM ESTIMATE
0.6%
0.1%
1.4%
0.2%
SEVENTH DAY ADVENTIST CHURCH
0.6%
0.9%
2.3%
3.6%
LUTHERAN CHURCH
0.5%
0.9%
2.0%
2.2%
SOUTHERN BAPTIST CONVENTION
0.3%
1.0%
3.8%
4.6%
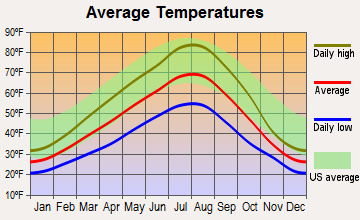
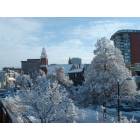
Weather
Seattle's weather is milder, with wet winters and cool, dry summers, while Spokane, has a four-season climate with cold winters and hot, dry summers. The marine influence on Seattle moderates its weather, but Spokane, further inland, experiences greater temperature extremes.
Weather and climate
Type
Seattle
Spokane
Temperature - Average
52.5°F
47.3°F
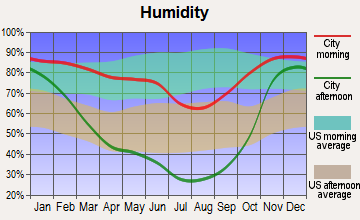
Humidity - Average morning or afternoon humidity
78.5%
68.4%
Humidity - Differences between morning and afternoon humidity
38%
61%
Humidity - Maximum monthly morning or afternoon humidity
86%
87%
Humidity - Minimum monthly morning or afternoon humidity
48%
26%
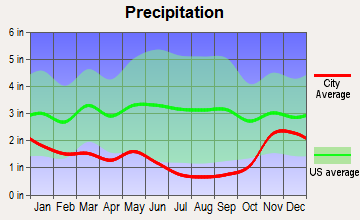
Precipitation - Yearly average
36.6 in
16.9 in
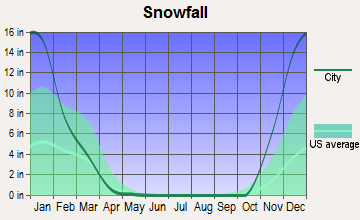
Snowfall - Yearly average
21.4 in
85 in
Clouds - Number of days clear of clouds
11.6%
14.3%
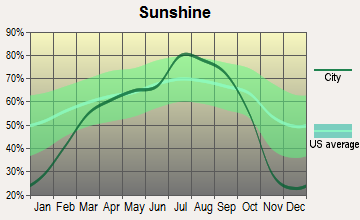
Sunshine amount - Average
49.4%
56.5%
Sunshine amount - Differences during a year
44%
56%
Sunshine amount - Maximum monthly
64%
78%
Sunshine amount - Minimum monthly
20%
22%
Wind speed - Average
8.6 mph
9.4 mph
Average climate in Seattle, Washington
Average climate in Spokane, Washington
Air pollution
Type
AQI
CO
NO2
OZONE
PB
PM10
PM25
SO2
Year
Seattle
Spokane
Seattle
Spokane
Seattle
Seattle
Seattle
Seattle
Spokane
Seattle
Spokane
Seattle
2018
82
92
0.21
N/A
10.6
N/A
20.7
N/A
N/A
N/A
N/A
24.8
8.3
9.9
0.7
N/A
2017
92
91
0.23
N/A
11.1
N/A
21.0
N/A
N/A
N/A
N/A
22.7
8.8
10.7
0.3
N/A
2016
67
61
0.22
N/A
11.9
N/A
20.3
N/A
N/A
N/A
N/A
18.4
6.6
6.6
0.6
N/A
2015
81
81
0.23
N/A
10.8
N/A
19.3
N/A
N/A
N/A
N/A
23.4
8.5
9.4
0.8
N/A
2014
75
67
0.24
N/A
11.5
N/A
19.5
N/A
N/A
N/A
N/A
19.7
7.4
7.9
N/A
N/A
2013
81
82
0.24
N/A
N/A
N/A
17.4
N/A
N/A
N/A
N/A
21.7
9.1
8.9
0.8
N/A
2012
77
73
0.23
N/A
N/A
N/A
19.5
N/A
N/A
N/A
N/A
23.5
7.7
8.0
1.0
N/A
2011
72
65
0.24
N/A
N/A
N/A
18.6
N/A
N/A
N/A
N/A
N/A
7.5
7.9
1.1
N/A
2010
71
67
0.24
N/A
N/A
N/A
18.0
N/A
N/A
N/A
N/A
N/A
6.7
7.4
1.1
N/A
2009
94
65
0.27
N/A
N/A
N/A
17.7
N/A
N/A
N/A
N/A
N/A
8.0
7.8
1.4
N/A
2008
80
74
0.30
N/A
N/A
N/A
17.8
N/A
N/A
N/A
N/A
27.2
6.5
9.0
1.3
N/A
2007
83
80
0.30
N/A
N/A
N/A
18.2
N/A
N/A
N/A
20.3
24.3
7.9
9.0
1.5
N/A
2006
98
92
N/A
N/A
N/A
N/A
18.3
N/A
N/A
N/A
22.6
26.4
8.7
9.8
N/A
N/A
2005
101
86
0.80
N/A
18.3
N/A
N/A
N/A
N/A
N/A
24.5
26.6
9.5
9.9
3.5
N/A
2004
102
94
0.81
N/A
17.9
N/A
N/A
N/A
N/A
N/A
N/A
N/A
10.3
10.5
3.0
N/A
2003
91
86
0.78
N/A
18.5
N/A
N/A
N/A
N/A
N/A
N/A
N/A
9.9
10.7
2.4
N/A
2002
87
79
0.82
1.13
19.3
N/A
N/A
N/A
N/A
N/A
N/A
N/A
11.7
10.6
2.7
N/A
2001
88
85
0.90
1.01
20.7
N/A
N/A
N/A
0.005
N/A
N/A
N/A
12.3
10.6
3.7
N/A
2000
98
82
1.06
0.98
20.9
N/A
N/A
N/A
N/A
N/A
N/A
19.2
13.3
11.5
3.2
N/A
Natural disasters
Type
Seattle
Spokane
Tornado activity compared to U.S. average
5.5%
9.4%
Earthquake activity compared to U.S. average
1,394.2%
1,073.7%
Natural disasters compared to U.S. average
30%
17%
Transportation
Seattle has a comprehensive public transport system that includes buses, light rail, and ferries. On the other hand, Spokane has a bus system, but many residents rely on cars for their commute.
Transport
Type
Seattle
Spokane
Amtrak stations
1
1
Amtrak stations nearby
2
1
FAA registered aircraft
1
387
FAA registered aircraft manufacturers and dealers
2
2
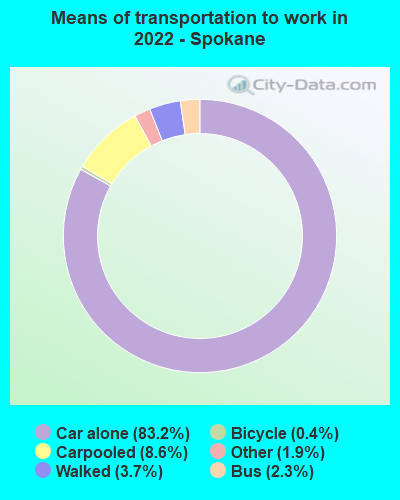
Means of transportation to work
Type
Seattle
Spokane
Bicycle
2.1%
1.2%
Bus
8.9%
2.4%
Carpooled
8.7%
8.1%
Car alone
67.8%
83.2%
Ferryboat
0.7%
0%
Motorcycle
0.3%
0.1%
Railroad
1.2%
0%
Streetcar
0.3%
0%
Subway
0.6%
0.1%
Taxicab
0.1%
0.1%
Walked
8%
4.1%
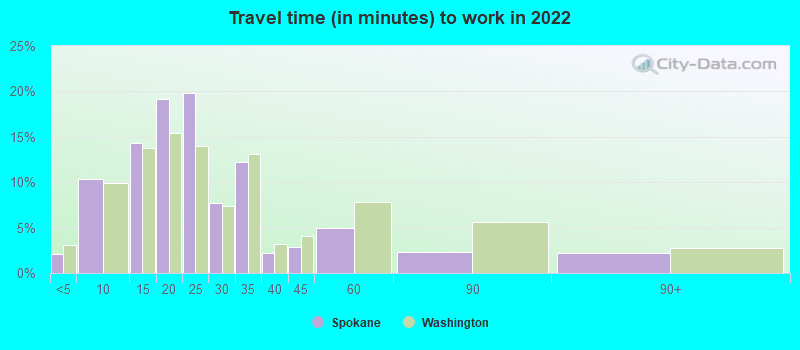
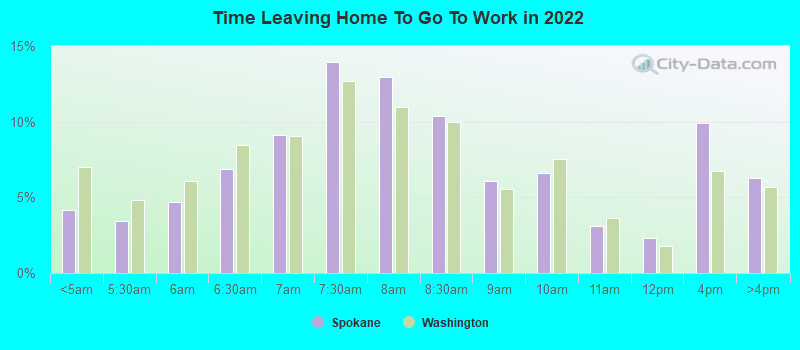
Average travel time to work
Type
Seattle
Spokane
Average
35 min
24.8 min
Other means
23.5 min
19.9 min
Public transportation
35.6 min
35.3 min
Private vehicle occupancy
Type
Seattle
Spokane
Average
1.2
1.1
Drove alone
89%
90%
In 2 person carpool
8.7%
8.5%
In 3 person carpool
0.8%
0.8%
In 4 person carpool
0.2%
0.5%
In 5-6 person carpool
1.1%
0.2%
In 7+ person carpool
0.2%
0%
How many people usually rode to work in the car, truck or van.
Real Estate
With a higher cost of living, real estate in Seattle is more expensive than in Spokane. In terms of investment, Seattle's real estate market is very competitive, with high demand and low supply.
Neighborhoods
Seattle offers diverse city living with a range of cultures in neighborhoods such as Belltown and Capitol Hill, while Spokane provides more suburban-style living with neighborhoods including Perry District and Kendall Yards.
Houses and residents
Type
Seattle
Spokane
Houses
384,799
99,251
Average household size (people)
2.1
2.3
Median year apartment built
1987
1973
Median year house/condo built
1955
1957
Length of stay in the house since moving in
12.4 years
11.4 years
Houses occupied
351,650 (91.4%)
94,748 (95.5%)
Houses occupied by owners
161,587 (46%)
54,499 (57.5%)
Houses occupied by renters
190,063 (54%)
40,249 (42.5%)
Median rent asked for vacant for-rent units
$2,780
$620.37
Median monthly housing costs
$1,984
$1,061
Median price asked for vacant for-sale houses and condos
$860,506
$126,710
Estimated median house or condo value
$848,100
$318,200
Median numbers of rooms
4.1
5.5
Median number of rooms in apartments
3
3.9
Median number of rooms in houses and condos
6.3
6.8
Median house price - detached houses
Over $1,000,000
$357,948
Median house price - in 2-unit structures
$764,579
$291,236
Median house price - in 3-to-4-unit structures
$719,049
$257,823
Median house price - in 5 or more unit structures
$626,370
$276,532
Median house price - mobile homes
$226,727
$60,750
Median house price - Townhouses or other attached units
$925,507
$370,566
Median house price - All housing units
Over $1,000,000
$348,191
Median house age
47
59
Renting percentage
51.9%
42.4%
Housing density (houses/condos per square mile)
4,587.9
1,718.4
House value disparities
20.6%
28%
Household income disparities
42.2%
44.5%
Median household income for houses/condes with a mortgage
$189,767
$86,101
Median household income for apartments without a mortgage
$112,771
$61,883
Housing units without a mortgage
2,459 (2.1%)
766 (2.1%)
Housing units with both a second mortgage and home equity loan
12,354 (10.5%)
2,784 (7.5%)
Housing units with a mortgage
115,481 (97.9%)
36,544 (97.9%)
Housing units with a home equity loan
240 (0.2%)
22 (0.1%)
Housing units with a second mortgage
13,881 (11.8%)
3,852 (10.3%)
House/condo owner moved in on average (years ago)
8
9
House/condo renter moved in on average (years ago)
1
1
Housing units lacking complete kitchen facilities
2.2%
1.2%
Housing units lacking complete plumbing facilities
0.4%
0.9%
Housing units in structures
Housing units in structures
Seattle
Spokane
One, detached
39.6%
63.1%
One, attached
6.0%
4.0%
Two
2.0%
2.6%
3 or 4
3.2%
3.9%
5 to 9
5.7%
4.7%
10 to 19
7.0%
6.5%
20 to 49
11.9%
6.7%
50 or more
24.4%
6.8%
Mobile homes
0.1%
1.7%
Median real estate property taxes paid for housing units
Self-employed workers in own not incorporated business
24,994
4,150
State government workers
27,235
5,528
Unpaid family workers
947
21
Industries and Occupations
Tech, healthcare, and manufacturing dominate Seattle’s job market. Meanwhile, Spokane’s economy is more varied with health care, education, and agriculture being the key drivers.
Seattle boasts world-class healthcare facilities including UW Medicine and Swedish Health Services. Spokane also has quality healthcare with major hospitals such as Providence Sacred Heart Medical Center and Deaconess Hospital.
Health (county statistics)
Type
Seattle
Spokane
General health status score of residents in this county from 1 (poor) to 5 (excellent)
While Seattle has more modern infrastructure due to its larger size and economic prowess, both cities have invested in renovating and improving their existing infrastructure in recent years. Spokane benefits from being less congested due to its smaller population.
Infrastructure
Type
Seattle
Spokane
Hospitals
22
10
TV stations
17
13
Arenas or stadiums
5
2
Bank branches located here
236
93
Bank institutions located here
37
16
Main business address for public companies
54
10
Drinking water stations with no reported violations in the past
3
1
Drinking water stations with reported violations in the past
HMDA - Conventional home purchase loans - Applications denied
Year
Seattle
Spokane
1999
1,357
840
2000
1,148
568
2001
890
329
2002
840
261
2003
1,421
458
2004
1,810
626
2005
2,341
889
2006
2,789
1,024
2007
2,273
688
2008
1,113
267
2009
748
142
Culture and Food
Seattle is famous for its coffee culture, diverse cuisine and vibrant art scene. Spokane has a burgeoning arts scene, numerous wineries, and a growing food scene.
Sports Teams
Seattle is home to major league sports teams like the Seahawks (NFL), Mariners (MLB), and the recent addition of the Kraken (NHL), whereas Spokane does not have any major league teams but hosts minor league team Spokane Indians (MiLB) and Spokane Chiefs (WHL).


 Seattle, WA
 Spokane, WA