This comparison provides an in-depth look into living and visiting South Coast and Mission Viejo, California. South Coast, often synonymous with Orange County, features beautiful beaches, vibrant nightlife, and a strong economy, while Mission Viejo, a city in South Coast, is known for its safe neighborhoods, outdoor activities, and exceptional public services. This guide aims to help those who are contemplating relocation or a trip to these Californian destinations by considering various vital aspects such as safety, cost of living, healthcare, transportation and more.
In terms of safety, Mission Viejo consistently ranks as one of the safest cities in the United States. Its low crime rates and well-maintained neighborhoods make it attractive to families and retirees. South Coast, in general, has a broader variety of cities which can result in varying crime rates, but it's mostly safe and, on average, safer than other metropolitan areas in California.
Cost of Living
While southern California is known for its high cost of living, Mission Viejo tends to be somewhat more affordable than other parts of the South Coast. In general, housing tends to be the most significant factor in the cost of living, with both areas boasting above-average housing costs.
Income Tax
Both Mission Viejo and South Coast, like all of California, adhere to the state's progressive income tax system with rates ranging from 1% to 13.3% depending on income.
Property Tax
Property tax rates in Mission Viejo and the South Coast are typically around 1% of the assessed value of the property, in line with the California state average.
Sales Tax
California's state sales tax is 7.25%, and both Mission Viejo and the broader South Coast follow this, with some local taxes resulting in slightly higher total rates in some areas.
Income
Type
South Coast
Mission Viejo
Estimated median household income
$112,870
$124,971
Estimated per capita income
$68,453
$60,644
Cost of living index (U.S. average is 100)
96.8
87.9
If you make $50,000 in Mission Viejo, you will have to make $55,063 in South Coast to maintain the same standard of living.
Geographical Conditions
South Coast boasts stunning beaches and coastal plains, while Mission Viejo is inland with picturesque rolling hills. Both have beautiful natural surroundings and offer numerous recreational opportunities.
Geographical information
Type
South Coast
Mission Viejo
Land area
101 sq. miles
18.7 sq. miles
Population density
2,953.2 people per sq. mile
4,955.1 people per sq. mile
Relative area comparison
South Coast, CA Mission Viejo, CA
Education
Both the South Coast and Mission Viejo have strong educational systems. Mission Viejo is a part of the Saddleback Valley Unified School District and Capistrano Unified School District both of which are highly rated. South Coast has numerous top-rated public, charter and private schools, in addition to several reputable colleges and universities.
South Coast has a vibrant, diverse economy with strong sectors in tourism, technology, healthcare, and professional services. Mission Viejo is somewhat smaller but has a stable economy with a focus on the service sector, healthcare, and retail.
Biggest Employers
South Coast's biggest employers include Disneyland Resort, University of California - Irvine, and the County of Orange. In Mission Viejo, the largest employers are the Capistrano Unified School District, Saddleback College, and Mission Hospital.
Weather
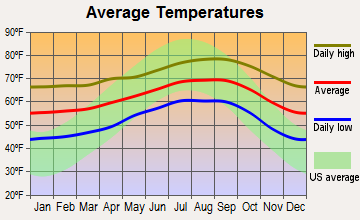
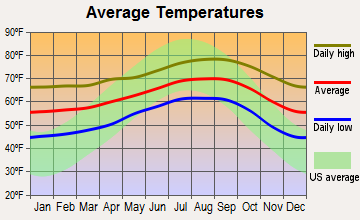
Both South Coast and Mission Viejo enjoy an appealing Southern California climate. Expect lots of sunshine, modest rainfall, and mild winters. Summer temperatures are warmer inland in Mission Viejo, while South Coast benefits from the cooling sea breezes off the Pacific.
Weather and climate
Type
South Coast
Mission Viejo
Temperature - Average
62.1°F
62.6°F
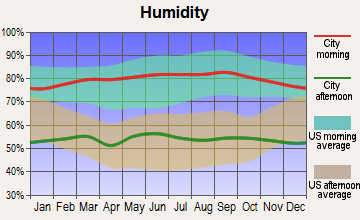
Humidity - Average morning or afternoon humidity
69.1%
68.9%
Humidity - Differences between morning and afternoon humidity
24.6%
24.5%
Humidity - Maximum monthly morning or afternoon humidity
77%
76.7%
Humidity - Minimum monthly morning or afternoon humidity
52.4%
52.2%
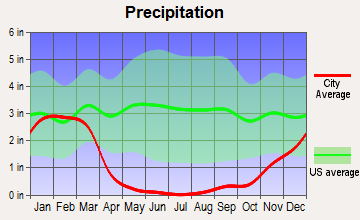
Precipitation - Yearly average
13.4 in
13.2 in
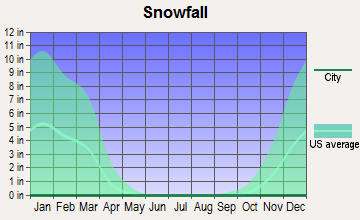
Snowfall - Yearly average
0 in
0 in
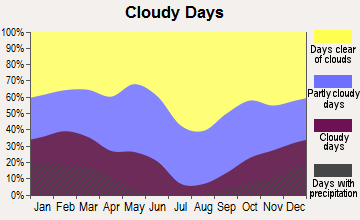
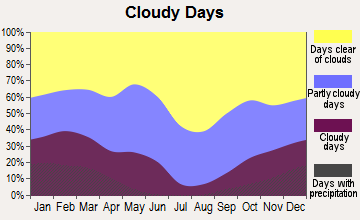
Clouds - Number of days clear of clouds
26.7%
26.8%
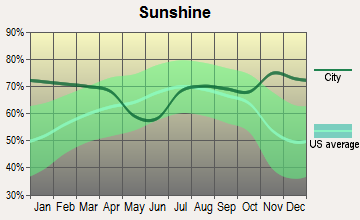
Sunshine amount - Average
77.6%
77.9%
Sunshine amount - Differences during a year
20.5%
21.1%
Sunshine amount - Maximum monthly
81.9%
83.2%
Sunshine amount - Minimum monthly
61.4%
62.1%
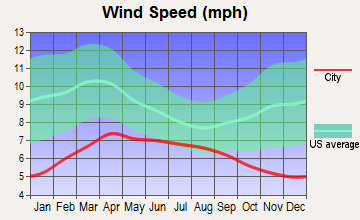
Wind speed - Average
5.5 mph
5.4 mph
Average climate in South Coast, California
Average climate in Mission Viejo, California
Air pollution
Type
AQI
CO
NO2
OZONE
PM10
PM25
SO2
Year
South Coast
Mission Viejo
South Coast
Mission Viejo
South Coast
Mission Viejo
South Coast
Mission Viejo
South Coast
Mission Viejo
South Coast
Mission Viejo
South Coast
Mission Viejo
2018
105
121
0.18
0.19
8.6
10.8
34.0
34.2
22.7
24.2
7.0
9.2
N/A
N/A
2017
111
122
0.21
0.22
8.4
10.5
34.7
34.7
23.0
24.6
11.3
12.2
N/A
N/A
2016
105
112
0.14
0.12
9.6
10.7
33.8
34.2
21.9
22.8
9.8
11.1
0.1
0.1
2015
111
123
0.10
0.07
10.5
11.3
32.9
32.8
19.4
21.8
10.5
12.4
0.1
0.1
2014
100
107
0.11
0.09
9.8
10.9
31.3
31.7
25.4
26.0
11.8
13.8
0.3
0.3
2013
97
110
0.17
0.16
10.6
11.6
30.0
30.0
24.5
26.1
10.3
11.9
0.2
0.2
2012
101
114
0.26
0.29
10.1
11.2
29.9
31.3
21.5
23.9
10.5
12.3
0.1
0.1
2011
113
129
0.15
0.13
10.2
11.8
30.3
30.5
24.0
25.5
10.9
13.0
0.3
0.3
2010
101
113
0.21
0.21
10.9
12.1
30.6
31.1
23.3
23.5
11.4
12.9
0.6
0.6
2009
120
134
0.15
0.12
13.0
14.2
31.5
31.7
27.3
26.1
12.4
13.8
1.1
1.1
2008
131
142
0.26
0.23
13.2
14.9
32.0
31.8
38.8
35.6
9.4
12.5
1.1
1.1
2007
110
114
0.24
0.21
13.7
15.1
30.6
30.8
N/A
N/A
N/A
N/A
0.8
0.8
2006
112
113
0.30
0.30
14.8
15.9
30.6
31.0
N/A
N/A
N/A
N/A
1.3
1.3
2005
109
112
0.28
0.27
13.7
15.5
29.9
29.8
N/A
N/A
N/A
N/A
1.3
1.3
2004
130
132
0.29
0.26
15.5
16.6
32.5
32.8
N/A
N/A
N/A
N/A
1.6
1.6
2003
132
132
0.38
0.33
18.2
19.6
31.3
30.7
N/A
N/A
N/A
N/A
1.1
1.1
2002
129
130
0.40
0.36
17.7
19.2
28.4
27.4
N/A
N/A
N/A
N/A
1.6
1.6
2001
137
140
0.52
0.47
18.5
19.3
27.8
27.2
N/A
N/A
N/A
N/A
1.4
1.4
2000
140
140
0.52
0.45
21.2
21.3
24.5
23.6
N/A
N/A
N/A
N/A
1.9
1.9
Natural disasters
Type
South Coast
Mission Viejo
Tornado activity compared to U.S. average
17.1%
17.9%
Earthquake activity compared to U.S. average
6,728.5%
6,866.6%
Natural disasters compared to U.S. average
32%
32%
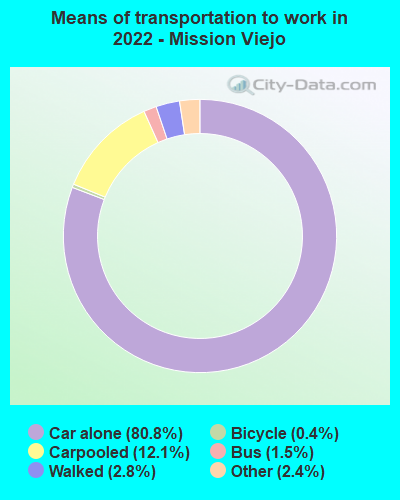
Transportation
Both South Coast and Mission Viejo are serviced by the Orange County Transportation Authority, with numerous bus routes and Metrolink train services. Driving is still the most common commuting method, and traffic can be heavy during peak periods.
Transport
Type
South Coast
Mission Viejo
Amtrak stations nearby
3
3
FAA registered aircraft
0
58
FAA registered aircraft manufacturers and dealers
0
3
Means of transportation to work
Type
South Coast
Mission Viejo
Bicycle
0.3%
0.4%
Bus
1%
1.6%
Carpooled
10.5%
10.7%
Car alone
79.2%
83.1%
Motorcycle
0.2%
0.2%
Railroad
0.4%
0.1%
Subway
0%
0.3%
Walked
1.7%
2.5%
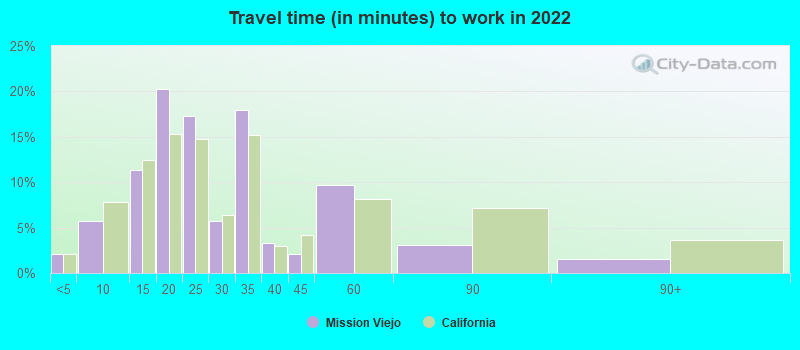
Average travel time to work
Type
South Coast
Mission Viejo
Average
27.9 min
26.6 min
Real Estate
Real estate in both South Coast and Mission Viejo is incredibly sought-after. The communities in Mission Viejo are serene and family-friendly, while South Coast properties offer variety, with oceanfront homes thrilling the high-end market.
Neighborhoods
The neighborhoods of Mission Viejo are admired for their safety, beauty, and community spirit, while those in the broader South Coast offer a diverse mixture of urban, suburban, and beachfront locations.
Houses and residents
Type
South Coast
Mission Viejo
Houses
124,031
36,316
Average household size (people)
2.5
2.8
Houses occupied
117,093 (94.4%)
34,168 (94.1%)
Houses occupied by owners
81,601 (69.7%)
26,639 (78%)
Houses occupied by renters
35,492 (30.3%)
7,529 (22%)
Median rent asked for vacant for-rent units
$2,718
$3,060
Median price asked for vacant for-sale houses and condos
$1,099,558
$630,958
Estimated median house or condo value
Over $1,000,000
$859,500
Median number of rooms in apartments
3.9
4.1
Median number of rooms in houses and condos
5.1
6.5
Renting percentage
33.8%
22.1%
Housing density (houses/condos per square mile)
1,227.5
1,946.5
Household income disparities
38.1%
37%
Housing units without a mortgage
10,715 (16.4%)
531 (2.7%)
Housing units with both a second mortgage and home equity loan
248 (0.4%)
1,736 (8.8%)
Housing units with a mortgage
54,674 (83.6%)
19,220 (97.3%)
Housing units with a home equity loan
5,859 (9%)
0 (0%)
Housing units with a second mortgage
7,560 (11.6%)
1,980 (10%)
Housing units lacking complete kitchen facilities
0.8%
2.2%
Housing units lacking complete plumbing facilities
Self-employed workers in own not incorporated business
17,244
3,059
State government workers
4,403
1,541
Unpaid family workers
640
198
Industries and Occupations
In South Coast, the primary industries include tourism, arts and entertainment, technology, and healthcare. Mission Viejo also boasts a balanced mix of industries, with healthcare, retail, and education being the dominant sectors.
Health Care
In terms of healthcare, both areas have excellent services. Mission Hospital in Mission Viejo is one of the most respected hospitals in California, and South Coast is home to highly-rated facilities like Hoag Hospital and UC Irvine Medical Center.
Infrastructure
In terms of infrastructure, both the larger area of South Coast and the city of Mission Viejo are well-developed with modern amenities. There are numerous medical facilities throughout the region, and internet coverage is widespread and reliable in both regions.
Infrastructure
Type
South Coast
Mission Viejo
TV stations
1
1
Nuclear power plants nearby
2
2
Culture and Food
Culturally, both South Coast and Mission Viejo offer an assortment of activities and cuisines. South Coast is a cultural melting pot with a vibrant food scene, while Mission Viejo has a more suburban, family-friendly culture with a focus on recreational activities.
Sports Teams
While South Coast is home to major sports teams like the Anaheim Ducks (NHL) and the Los Angeles Angels (MLB), Mission Viejo has a strong community sports culture and hosts numerous sports events throughout the year.
 South Coast, CA
 Mission Viejo, CA