Mission Viejo, California Submit your own pictures of this city and show them to the world
OSM Map
General Map
Google Map
MSN Map
OSM Map
General Map
Google Map
MSN Map
OSM Map
General Map
Google Map
MSN Map
OSM Map
General Map
Google Map
MSN Map
Please wait while loading the map...
Population in 2022: 91,776 (100% urban, 0% rural). Population change since 2000: -1.4%Males: 45,921 Females: 45,855
March 2022 cost of living index in Mission Viejo: 88.7 (less than average, U.S. average is 100) Percentage of residents living in poverty in 2022: 9.3%for White Non-Hispanic residents , 17.4% for Black residents , 4.2% for Hispanic or Latino residents , 4.6% for American Indian residents , 10.2% for other race residents , 3.4% for two or more races residents )
Profiles of local businesses
Business Search - 14 Million verified businesses
Data:
Median household income ($)
Median household income (% change since 2000)
Household income diversity
Ratio of average income to average house value (%)
Ratio of average income to average rent
Median household income ($) - White
Median household income ($) - Black or African American
Median household income ($) - Asian
Median household income ($) - Hispanic or Latino
Median household income ($) - American Indian and Alaska Native
Median household income ($) - Multirace
Median household income ($) - Other Race
Median household income for houses/condos with a mortgage ($)
Median household income for apartments without a mortgage ($)
Races - White alone (%)
Races - White alone (% change since 2000)
Races - Black alone (%)
Races - Black alone (% change since 2000)
Races - American Indian alone (%)
Races - American Indian alone (% change since 2000)
Races - Asian alone (%)
Races - Asian alone (% change since 2000)
Races - Hispanic (%)
Races - Hispanic (% change since 2000)
Races - Native Hawaiian and Other Pacific Islander alone (%)
Races - Native Hawaiian and Other Pacific Islander alone (% change since 2000)
Races - Two or more races (%)
Races - Two or more races (% change since 2000)
Races - Other race alone (%)
Races - Other race alone (% change since 2000)
Racial diversity
Unemployment (%)
Unemployment (% change since 2000)
Unemployment (%) - White
Unemployment (%) - Black or African American
Unemployment (%) - Asian
Unemployment (%) - Hispanic or Latino
Unemployment (%) - American Indian and Alaska Native
Unemployment (%) - Multirace
Unemployment (%) - Other Race
Population density (people per square mile)
Population - Males (%)
Population - Females (%)
Population - Males (%) - White
Population - Males (%) - Black or African American
Population - Males (%) - Asian
Population - Males (%) - Hispanic or Latino
Population - Males (%) - American Indian and Alaska Native
Population - Males (%) - Multirace
Population - Males (%) - Other Race
Population - Females (%) - White
Population - Females (%) - Black or African American
Population - Females (%) - Asian
Population - Females (%) - Hispanic or Latino
Population - Females (%) - American Indian and Alaska Native
Population - Females (%) - Multirace
Population - Females (%) - Other Race
Coronavirus confirmed cases (Apr 27, 2024)
Deaths caused by coronavirus (Apr 27, 2024)
Coronavirus confirmed cases (per 100k population) (Apr 27, 2024)
Deaths caused by coronavirus (per 100k population) (Apr 27, 2024)
Daily increase in number of cases (Apr 27, 2024)
Weekly increase in number of cases (Apr 27, 2024)
Cases doubled (in days) (Apr 27, 2024)
Hospitalized patients (Apr 18, 2022)
Negative test results (Apr 18, 2022)
Total test results (Apr 18, 2022)
COVID Vaccine doses distributed (per 100k population) (Sep 19, 2023)
COVID Vaccine doses administered (per 100k population) (Sep 19, 2023)
COVID Vaccine doses distributed (Sep 19, 2023)
COVID Vaccine doses administered (Sep 19, 2023)
Likely homosexual households (%)
Likely homosexual households (% change since 2000)
Likely homosexual households - Lesbian couples (%)
Likely homosexual households - Lesbian couples (% change since 2000)
Likely homosexual households - Gay men (%)
Likely homosexual households - Gay men (% change since 2000)
Cost of living index
Median gross rent ($)
Median contract rent ($)
Median monthly housing costs ($)
Median house or condo value ($)
Median house or condo value ($ change since 2000)
Mean house or condo value by units in structure - 1, detached ($)
Mean house or condo value by units in structure - 1, attached ($)
Mean house or condo value by units in structure - 2 ($)
Mean house or condo value by units in structure by units in structure - 3 or 4 ($)
Mean house or condo value by units in structure - 5 or more ($)
Mean house or condo value by units in structure - Boat, RV, van, etc. ($)
Mean house or condo value by units in structure - Mobile home ($)
Median house or condo value ($) - White
Median house or condo value ($) - Black or African American
Median house or condo value ($) - Asian
Median house or condo value ($) - Hispanic or Latino
Median house or condo value ($) - American Indian and Alaska Native
Median house or condo value ($) - Multirace
Median house or condo value ($) - Other Race
Median resident age
Resident age diversity
Median resident age - Males
Median resident age - Females
Median resident age - White
Median resident age - Black or African American
Median resident age - Asian
Median resident age - Hispanic or Latino
Median resident age - American Indian and Alaska Native
Median resident age - Multirace
Median resident age - Other Race
Median resident age - Males - White
Median resident age - Males - Black or African American
Median resident age - Males - Asian
Median resident age - Males - Hispanic or Latino
Median resident age - Males - American Indian and Alaska Native
Median resident age - Males - Multirace
Median resident age - Males - Other Race
Median resident age - Females - White
Median resident age - Females - Black or African American
Median resident age - Females - Asian
Median resident age - Females - Hispanic or Latino
Median resident age - Females - American Indian and Alaska Native
Median resident age - Females - Multirace
Median resident age - Females - Other Race
Commute - mean travel time to work (minutes)
Travel time to work - Less than 5 minutes (%)
Travel time to work - Less than 5 minutes (% change since 2000)
Travel time to work - 5 to 9 minutes (%)
Travel time to work - 5 to 9 minutes (% change since 2000)
Travel time to work - 10 to 19 minutes (%)
Travel time to work - 10 to 19 minutes (% change since 2000)
Travel time to work - 20 to 29 minutes (%)
Travel time to work - 20 to 29 minutes (% change since 2000)
Travel time to work - 30 to 39 minutes (%)
Travel time to work - 30 to 39 minutes (% change since 2000)
Travel time to work - 40 to 59 minutes (%)
Travel time to work - 40 to 59 minutes (% change since 2000)
Travel time to work - 60 to 89 minutes (%)
Travel time to work - 60 to 89 minutes (% change since 2000)
Travel time to work - 90 or more minutes (%)
Travel time to work - 90 or more minutes (% change since 2000)
Marital status - Never married (%)
Marital status - Now married (%)
Marital status - Separated (%)
Marital status - Widowed (%)
Marital status - Divorced (%)
Median family income ($)
Median family income (% change since 2000)
Median non-family income ($)
Median non-family income (% change since 2000)
Median per capita income ($)
Median per capita income (% change since 2000)
Median family income ($) - White
Median family income ($) - Black or African American
Median family income ($) - Asian
Median family income ($) - Hispanic or Latino
Median family income ($) - American Indian and Alaska Native
Median family income ($) - Multirace
Median family income ($) - Other Race
Median year house/condo built
Median year apartment built
Year house built - Built 2005 or later (%)
Year house built - Built 2000 to 2004 (%)
Year house built - Built 1990 to 1999 (%)
Year house built - Built 1980 to 1989 (%)
Year house built - Built 1970 to 1979 (%)
Year house built - Built 1960 to 1969 (%)
Year house built - Built 1950 to 1959 (%)
Year house built - Built 1940 to 1949 (%)
Year house built - Built 1939 or earlier (%)
Average household size
Household density (households per square mile)
Average household size - White
Average household size - Black or African American
Average household size - Asian
Average household size - Hispanic or Latino
Average household size - American Indian and Alaska Native
Average household size - Multirace
Average household size - Other Race
Occupied housing units (%)
Vacant housing units (%)
Owner occupied housing units (%)
Renter occupied housing units (%)
Vacancy status - For rent (%)
Vacancy status - For sale only (%)
Vacancy status - Rented or sold, not occupied (%)
Vacancy status - For seasonal, recreational, or occasional use (%)
Vacancy status - For migrant workers (%)
Vacancy status - Other vacant (%)
Residents with income below the poverty level (%)
Residents with income below 50% of the poverty level (%)
Children below poverty level (%)
Poor families by family type - Married-couple family (%)
Poor families by family type - Male, no wife present (%)
Poor families by family type - Female, no husband present (%)
Poverty status for native-born residents (%)
Poverty status for foreign-born residents (%)
Poverty among high school graduates not in families (%)
Poverty among people who did not graduate high school not in families (%)
Residents with income below the poverty level (%) - White
Residents with income below the poverty level (%) - Black or African American
Residents with income below the poverty level (%) - Asian
Residents with income below the poverty level (%) - Hispanic or Latino
Residents with income below the poverty level (%) - American Indian and Alaska Native
Residents with income below the poverty level (%) - Multirace
Residents with income below the poverty level (%) - Other Race
Air pollution - Air Quality Index (AQI)
Air pollution - CO
Air pollution - NO2
Air pollution - SO2
Air pollution - Ozone
Air pollution - PM10
Air pollution - PM25
Air pollution - Pb
Crime - Murders per 100,000 population
Crime - Rapes per 100,000 population
Crime - Robberies per 100,000 population
Crime - Assaults per 100,000 population
Crime - Burglaries per 100,000 population
Crime - Thefts per 100,000 population
Crime - Auto thefts per 100,000 population
Crime - Arson per 100,000 population
Crime - City-data.com crime index
Crime - Violent crime index
Crime - Property crime index
Crime - Murders per 100,000 population (5 year average)
Crime - Rapes per 100,000 population (5 year average)
Crime - Robberies per 100,000 population (5 year average)
Crime - Assaults per 100,000 population (5 year average)
Crime - Burglaries per 100,000 population (5 year average)
Crime - Thefts per 100,000 population (5 year average)
Crime - Auto thefts per 100,000 population (5 year average)
Crime - Arson per 100,000 population (5 year average)
Crime - City-data.com crime index (5 year average)
Crime - Violent crime index (5 year average)
Crime - Property crime index (5 year average)
1996 Presidential Elections Results (%) - Democratic Party (Clinton)
1996 Presidential Elections Results (%) - Republican Party (Dole)
1996 Presidential Elections Results (%) - Other
2000 Presidential Elections Results (%) - Democratic Party (Gore)
2000 Presidential Elections Results (%) - Republican Party (Bush)
2000 Presidential Elections Results (%) - Other
2004 Presidential Elections Results (%) - Democratic Party (Kerry)
2004 Presidential Elections Results (%) - Republican Party (Bush)
2004 Presidential Elections Results (%) - Other
2008 Presidential Elections Results (%) - Democratic Party (Obama)
2008 Presidential Elections Results (%) - Republican Party (McCain)
2008 Presidential Elections Results (%) - Other
2012 Presidential Elections Results (%) - Democratic Party (Obama)
2012 Presidential Elections Results (%) - Republican Party (Romney)
2012 Presidential Elections Results (%) - Other
2016 Presidential Elections Results (%) - Democratic Party (Clinton)
2016 Presidential Elections Results (%) - Republican Party (Trump)
2016 Presidential Elections Results (%) - Other
2020 Presidential Elections Results (%) - Democratic Party (Biden)
2020 Presidential Elections Results (%) - Republican Party (Trump)
2020 Presidential Elections Results (%) - Other
Ancestries Reported - Arab (%)
Ancestries Reported - Czech (%)
Ancestries Reported - Danish (%)
Ancestries Reported - Dutch (%)
Ancestries Reported - English (%)
Ancestries Reported - French (%)
Ancestries Reported - French Canadian (%)
Ancestries Reported - German (%)
Ancestries Reported - Greek (%)
Ancestries Reported - Hungarian (%)
Ancestries Reported - Irish (%)
Ancestries Reported - Italian (%)
Ancestries Reported - Lithuanian (%)
Ancestries Reported - Norwegian (%)
Ancestries Reported - Polish (%)
Ancestries Reported - Portuguese (%)
Ancestries Reported - Russian (%)
Ancestries Reported - Scotch-Irish (%)
Ancestries Reported - Scottish (%)
Ancestries Reported - Slovak (%)
Ancestries Reported - Subsaharan African (%)
Ancestries Reported - Swedish (%)
Ancestries Reported - Swiss (%)
Ancestries Reported - Ukrainian (%)
Ancestries Reported - United States (%)
Ancestries Reported - Welsh (%)
Ancestries Reported - West Indian (%)
Ancestries Reported - Other (%)
Educational Attainment - No schooling completed (%)
Educational Attainment - Less than high school (%)
Educational Attainment - High school or equivalent (%)
Educational Attainment - Less than 1 year of college (%)
Educational Attainment - 1 or more years of college (%)
Educational Attainment - Associate degree (%)
Educational Attainment - Bachelor's degree (%)
Educational Attainment - Master's degree (%)
Educational Attainment - Professional school degree (%)
Educational Attainment - Doctorate degree (%)
School Enrollment - Nursery, preschool (%)
School Enrollment - Kindergarten (%)
School Enrollment - Grade 1 to 4 (%)
School Enrollment - Grade 5 to 8 (%)
School Enrollment - Grade 9 to 12 (%)
School Enrollment - College undergrad (%)
School Enrollment - Graduate or professional (%)
School Enrollment - Not enrolled in school (%)
School enrollment - Public schools (%)
School enrollment - Private schools (%)
School enrollment - Not enrolled (%)
Median number of rooms in houses and condos
Median number of rooms in apartments
Housing units lacking complete plumbing facilities (%)
Housing units lacking complete kitchen facilities (%)
Density of houses
Urban houses (%)
Rural houses (%)
Households with people 60 years and over (%)
Households with people 65 years and over (%)
Households with people 75 years and over (%)
Households with one or more nonrelatives (%)
Households with no nonrelatives (%)
Population in households (%)
Family households (%)
Nonfamily households (%)
Population in families (%)
Family households with own children (%)
Median number of bedrooms in owner occupied houses
Mean number of bedrooms in owner occupied houses
Median number of bedrooms in renter occupied houses
Mean number of bedrooms in renter occupied houses
Median number of vehichles in owner occupied houses
Mean number of vehichles in owner occupied houses
Median number of vehichles in renter occupied houses
Mean number of vehichles in renter occupied houses
Mortgage status - with mortgage (%)
Mortgage status - with second mortgage (%)
Mortgage status - with home equity loan (%)
Mortgage status - with both second mortgage and home equity loan (%)
Mortgage status - without a mortgage (%)
Average family size
Average family size - White
Average family size - Black or African American
Average family size - Asian
Average family size - Hispanic or Latino
Average family size - American Indian and Alaska Native
Average family size - Multirace
Average family size - Other Race
Geographical mobility - Same house 1 year ago (%)
Geographical mobility - Moved within same county (%)
Geographical mobility - Moved from different county within same state (%)
Geographical mobility - Moved from different state (%)
Geographical mobility - Moved from abroad (%)
Place of birth - Born in state of residence (%)
Place of birth - Born in other state (%)
Place of birth - Native, outside of US (%)
Place of birth - Foreign born (%)
Housing units in structures - 1, detached (%)
Housing units in structures - 1, attached (%)
Housing units in structures - 2 (%)
Housing units in structures - 3 or 4 (%)
Housing units in structures - 5 to 9 (%)
Housing units in structures - 10 to 19 (%)
Housing units in structures - 20 to 49 (%)
Housing units in structures - 50 or more (%)
Housing units in structures - Mobile home (%)
Housing units in structures - Boat, RV, van, etc. (%)
House/condo owner moved in on average (years ago)
Renter moved in on average (years ago)
Year householder moved into unit - Moved in 1999 to March 2000 (%)
Year householder moved into unit - Moved in 1995 to 1998 (%)
Year householder moved into unit - Moved in 1990 to 1994 (%)
Year householder moved into unit - Moved in 1980 to 1989 (%)
Year householder moved into unit - Moved in 1970 to 1979 (%)
Year householder moved into unit - Moved in 1969 or earlier (%)
Means of transportation to work - Drove car alone (%)
Means of transportation to work - Carpooled (%)
Means of transportation to work - Public transportation (%)
Means of transportation to work - Bus or trolley bus (%)
Means of transportation to work - Streetcar or trolley car (%)
Means of transportation to work - Subway or elevated (%)
Means of transportation to work - Railroad (%)
Means of transportation to work - Ferryboat (%)
Means of transportation to work - Taxicab (%)
Means of transportation to work - Motorcycle (%)
Means of transportation to work - Bicycle (%)
Means of transportation to work - Walked (%)
Means of transportation to work - Other means (%)
Working at home (%)
Industry diversity
Most Common Industries - Agriculture, forestry, fishing and hunting, and mining (%)
Most Common Industries - Agriculture, forestry, fishing and hunting (%)
Most Common Industries - Mining, quarrying, and oil and gas extraction (%)
Most Common Industries - Construction (%)
Most Common Industries - Manufacturing (%)
Most Common Industries - Wholesale trade (%)
Most Common Industries - Retail trade (%)
Most Common Industries - Transportation and warehousing, and utilities (%)
Most Common Industries - Transportation and warehousing (%)
Most Common Industries - Utilities (%)
Most Common Industries - Information (%)
Most Common Industries - Finance and insurance, and real estate and rental and leasing (%)
Most Common Industries - Finance and insurance (%)
Most Common Industries - Real estate and rental and leasing (%)
Most Common Industries - Professional, scientific, and management, and administrative and waste management services (%)
Most Common Industries - Professional, scientific, and technical services (%)
Most Common Industries - Management of companies and enterprises (%)
Most Common Industries - Administrative and support and waste management services (%)
Most Common Industries - Educational services, and health care and social assistance (%)
Most Common Industries - Educational services (%)
Most Common Industries - Health care and social assistance (%)
Most Common Industries - Arts, entertainment, and recreation, and accommodation and food services (%)
Most Common Industries - Arts, entertainment, and recreation (%)
Most Common Industries - Accommodation and food services (%)
Most Common Industries - Other services, except public administration (%)
Most Common Industries - Public administration (%)
Occupation diversity
Most Common Occupations - Management, business, science, and arts occupations (%)
Most Common Occupations - Management, business, and financial occupations (%)
Most Common Occupations - Management occupations (%)
Most Common Occupations - Business and financial operations occupations (%)
Most Common Occupations - Computer, engineering, and science occupations (%)
Most Common Occupations - Computer and mathematical occupations (%)
Most Common Occupations - Architecture and engineering occupations (%)
Most Common Occupations - Life, physical, and social science occupations (%)
Most Common Occupations - Education, legal, community service, arts, and media occupations (%)
Most Common Occupations - Community and social service occupations (%)
Most Common Occupations - Legal occupations (%)
Most Common Occupations - Education, training, and library occupations (%)
Most Common Occupations - Arts, design, entertainment, sports, and media occupations (%)
Most Common Occupations - Healthcare practitioners and technical occupations (%)
Most Common Occupations - Health diagnosing and treating practitioners and other technical occupations (%)
Most Common Occupations - Health technologists and technicians (%)
Most Common Occupations - Service occupations (%)
Most Common Occupations - Healthcare support occupations (%)
Most Common Occupations - Protective service occupations (%)
Most Common Occupations - Fire fighting and prevention, and other protective service workers including supervisors (%)
Most Common Occupations - Law enforcement workers including supervisors (%)
Most Common Occupations - Food preparation and serving related occupations (%)
Most Common Occupations - Building and grounds cleaning and maintenance occupations (%)
Most Common Occupations - Personal care and service occupations (%)
Most Common Occupations - Sales and office occupations (%)
Most Common Occupations - Sales and related occupations (%)
Most Common Occupations - Office and administrative support occupations (%)
Most Common Occupations - Natural resources, construction, and maintenance occupations (%)
Most Common Occupations - Farming, fishing, and forestry occupations (%)
Most Common Occupations - Construction and extraction occupations (%)
Most Common Occupations - Installation, maintenance, and repair occupations (%)
Most Common Occupations - Production, transportation, and material moving occupations (%)
Most Common Occupations - Production occupations (%)
Most Common Occupations - Transportation occupations (%)
Most Common Occupations - Material moving occupations (%)
People in Group quarters - Institutionalized population (%)
People in Group quarters - Correctional institutions (%)
People in Group quarters - Federal prisons and detention centers (%)
People in Group quarters - Halfway houses (%)
People in Group quarters - Local jails and other confinement facilities (including police lockups) (%)
People in Group quarters - Military disciplinary barracks (%)
People in Group quarters - State prisons (%)
People in Group quarters - Other types of correctional institutions (%)
People in Group quarters - Nursing homes (%)
People in Group quarters - Hospitals/wards, hospices, and schools for the handicapped (%)
People in Group quarters - Hospitals/wards and hospices for chronically ill (%)
People in Group quarters - Hospices or homes for chronically ill (%)
People in Group quarters - Military hospitals or wards for chronically ill (%)
People in Group quarters - Other hospitals or wards for chronically ill (%)
People in Group quarters - Hospitals or wards for drug/alcohol abuse (%)
People in Group quarters - Mental (Psychiatric) hospitals or wards (%)
People in Group quarters - Schools, hospitals, or wards for the mentally retarded (%)
People in Group quarters - Schools, hospitals, or wards for the physically handicapped (%)
People in Group quarters - Institutions for the deaf (%)
People in Group quarters - Institutions for the blind (%)
People in Group quarters - Orthopedic wards and institutions for the physically handicapped (%)
People in Group quarters - Wards in general hospitals for patients who have no usual home elsewhere (%)
People in Group quarters - Wards in military hospitals for patients who have no usual home elsewhere (%)
People in Group quarters - Juvenile institutions (%)
People in Group quarters - Long-term care (%)
People in Group quarters - Homes for abused, dependent, and neglected children (%)
People in Group quarters - Residential treatment centers for emotionally disturbed children (%)
People in Group quarters - Training schools for juvenile delinquents (%)
People in Group quarters - Short-term care, detention or diagnostic centers for delinquent children (%)
People in Group quarters - Type of juvenile institution unknown (%)
People in Group quarters - Noninstitutionalized population (%)
People in Group quarters - College dormitories (includes college quarters off campus) (%)
People in Group quarters - Military quarters (%)
People in Group quarters - On base (%)
People in Group quarters - Barracks, unaccompanied personnel housing (UPH), (Enlisted/Officer), ;and similar group living quarters for military personnel (%)
People in Group quarters - Transient quarters for temporary residents (%)
People in Group quarters - Military ships (%)
People in Group quarters - Group homes (%)
People in Group quarters - Homes or halfway houses for drug/alcohol abuse (%)
People in Group quarters - Homes for the mentally ill (%)
People in Group quarters - Homes for the mentally retarded (%)
People in Group quarters - Homes for the physically handicapped (%)
People in Group quarters - Other group homes (%)
People in Group quarters - Religious group quarters (%)
People in Group quarters - Dormitories (%)
People in Group quarters - Agriculture workers' dormitories on farms (%)
People in Group quarters - Job Corps and vocational training facilities (%)
People in Group quarters - Other workers' dormitories (%)
People in Group quarters - Crews of maritime vessels (%)
People in Group quarters - Other nonhousehold living situations (%)
People in Group quarters - Other noninstitutional group quarters (%)
Residents speaking English at home (%)
Residents speaking English at home - Born in the United States (%)
Residents speaking English at home - Native, born elsewhere (%)
Residents speaking English at home - Foreign born (%)
Residents speaking Spanish at home (%)
Residents speaking Spanish at home - Born in the United States (%)
Residents speaking Spanish at home - Native, born elsewhere (%)
Residents speaking Spanish at home - Foreign born (%)
Residents speaking other language at home (%)
Residents speaking other language at home - Born in the United States (%)
Residents speaking other language at home - Native, born elsewhere (%)
Residents speaking other language at home - Foreign born (%)
Class of Workers - Employee of private company (%)
Class of Workers - Self-employed in own incorporated business (%)
Class of Workers - Private not-for-profit wage and salary workers (%)
Class of Workers - Local government workers (%)
Class of Workers - State government workers (%)
Class of Workers - Federal government workers (%)
Class of Workers - Self-employed workers in own not incorporated business and Unpaid family workers (%)
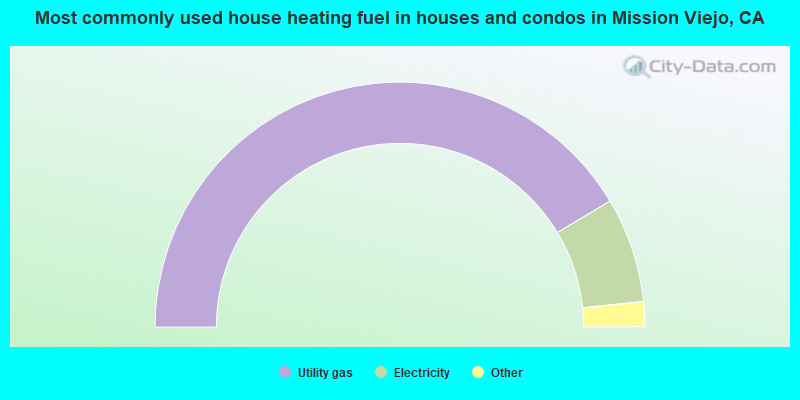
House heating fuel used in houses and condos - Utility gas (%)
House heating fuel used in houses and condos - Bottled, tank, or LP gas (%)
House heating fuel used in houses and condos - Electricity (%)
House heating fuel used in houses and condos - Fuel oil, kerosene, etc. (%)
House heating fuel used in houses and condos - Coal or coke (%)
House heating fuel used in houses and condos - Wood (%)
House heating fuel used in houses and condos - Solar energy (%)
House heating fuel used in houses and condos - Other fuel (%)
House heating fuel used in houses and condos - No fuel used (%)
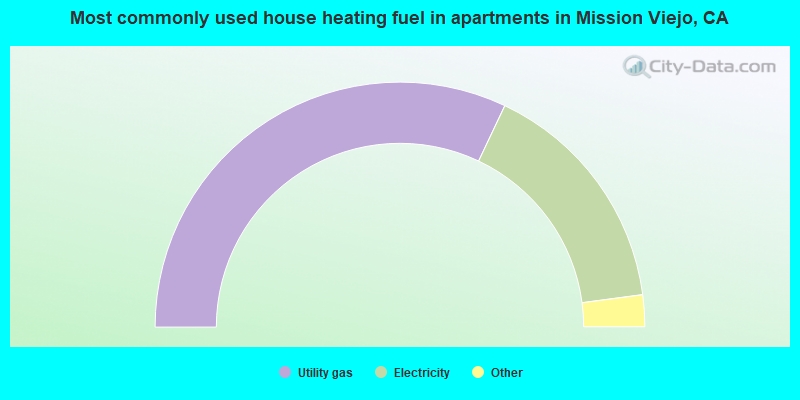
House heating fuel used in apartments - Utility gas (%)
House heating fuel used in apartments - Bottled, tank, or LP gas (%)
House heating fuel used in apartments - Electricity (%)
House heating fuel used in apartments - Fuel oil, kerosene, etc. (%)
House heating fuel used in apartments - Coal or coke (%)
House heating fuel used in apartments - Wood (%)
House heating fuel used in apartments - Solar energy (%)
House heating fuel used in apartments - Other fuel (%)
House heating fuel used in apartments - No fuel used (%)
Armed forces status - In Armed Forces (%)
Armed forces status - Civilian (%)
Armed forces status - Civilian - Veteran (%)
Armed forces status - Civilian - Nonveteran (%)
Fatal accidents locations in years 2005-2021
Fatal accidents locations in 2005
Fatal accidents locations in 2006
Fatal accidents locations in 2007
Fatal accidents locations in 2008
Fatal accidents locations in 2009
Fatal accidents locations in 2010
Fatal accidents locations in 2011
Fatal accidents locations in 2012
Fatal accidents locations in 2013
Fatal accidents locations in 2014
Fatal accidents locations in 2015
Fatal accidents locations in 2016
Fatal accidents locations in 2017
Fatal accidents locations in 2018
Fatal accidents locations in 2019
Fatal accidents locations in 2020
Fatal accidents locations in 2021
Alcohol use - People drinking some alcohol every month (%)
Alcohol use - People not drinking at all (%)
Alcohol use - Average days/month drinking alcohol
Alcohol use - Average drinks/week
Alcohol use - Average days/year people drink much
Audiometry - Average condition of hearing (%)
Audiometry - People that can hear a whisper from across a quiet room (%)
Audiometry - People that can hear normal voice from across a quiet room (%)
Audiometry - Ears ringing, roaring, buzzing (%)
Audiometry - Had a job exposure to loud noise (%)
Audiometry - Had off-work exposure to loud noise (%)
Blood Pressure & Cholesterol - Has high blood pressure (%)
Blood Pressure & Cholesterol - Checking blood pressure at home (%)
Blood Pressure & Cholesterol - Frequently checking blood cholesterol (%)
Blood Pressure & Cholesterol - Has high cholesterol level (%)
Consumer Behavior - Money monthly spent on food at supermarket/grocery store
Consumer Behavior - Money monthly spent on food at other stores
Consumer Behavior - Money monthly spent on eating out
Consumer Behavior - Money monthly spent on carryout/delivered foods
Consumer Behavior - Income spent on food at supermarket/grocery store (%)
Consumer Behavior - Income spent on food at other stores (%)
Consumer Behavior - Income spent on eating out (%)
Consumer Behavior - Income spent on carryout/delivered foods (%)
Current Health Status - General health condition (%)
Current Health Status - Blood donors (%)
Current Health Status - Has blood ever tested for HIV virus (%)
Current Health Status - Left-handed people (%)
Dermatology - People using sunscreen (%)
Diabetes - Diabetics (%)
Diabetes - Had a blood test for high blood sugar (%)
Diabetes - People taking insulin (%)
Diet Behavior & Nutrition - Diet health (%)
Diet Behavior & Nutrition - Milk product consumption (# of products/month)
Diet Behavior & Nutrition - Meals not home prepared (#/week)
Diet Behavior & Nutrition - Meals from fast food or pizza place (#/week)
Diet Behavior & Nutrition - Ready-to-eat foods (#/month)
Diet Behavior & Nutrition - Frozen meals/pizza (#/month)
Drug Use - People that ever used marijuana or hashish (%)
Drug Use - Ever used hard drugs (%)
Drug Use - Ever used any form of cocaine (%)
Drug Use - Ever used heroin (%)
Drug Use - Ever used methamphetamine (%)
Health Insurance - People covered by health insurance (%)
Kidney Conditions-Urology - Avg. # of times urinating at night
Medical Conditions - People with asthma (%)
Medical Conditions - People with anemia (%)
Medical Conditions - People with psoriasis (%)
Medical Conditions - People with overweight (%)
Medical Conditions - Elderly people having difficulties in thinking or remembering (%)
Medical Conditions - People who ever received blood transfusion (%)
Medical Conditions - People having trouble seeing even with glass/contacts (%)
Medical Conditions - People with arthritis (%)
Medical Conditions - People with gout (%)
Medical Conditions - People with congestive heart failure (%)
Medical Conditions - People with coronary heart disease (%)
Medical Conditions - People with angina pectoris (%)
Medical Conditions - People who ever had heart attack (%)
Medical Conditions - People who ever had stroke (%)
Medical Conditions - People with emphysema (%)
Medical Conditions - People with thyroid problem (%)
Medical Conditions - People with chronic bronchitis (%)
Medical Conditions - People with any liver condition (%)
Medical Conditions - People who ever had cancer or malignancy (%)
Mental Health - People who have little interest in doing things (%)
Mental Health - People feeling down, depressed, or hopeless (%)
Mental Health - People who have trouble sleeping or sleeping too much (%)
Mental Health - People feeling tired or having little energy (%)
Mental Health - People with poor appetite or overeating (%)
Mental Health - People feeling bad about themself (%)
Mental Health - People who have trouble concentrating on things (%)
Mental Health - People moving or speaking slowly or too fast (%)
Mental Health - People having thoughts they would be better off dead (%)
Oral Health - Average years since last visit a dentist
Oral Health - People embarrassed because of mouth (%)
Oral Health - People with gum disease (%)
Oral Health - General health of teeth and gums (%)
Oral Health - Average days a week using dental floss/device
Oral Health - Average days a week using mouthwash for dental problem
Oral Health - Average number of teeth
Pesticide Use - Households using pesticides to control insects (%)
Pesticide Use - Households using pesticides to kill weeds (%)
Physical Activity - People doing vigorous-intensity work activities (%)
Physical Activity - People doing moderate-intensity work activities (%)
Physical Activity - People walking or bicycling (%)
Physical Activity - People doing vigorous-intensity recreational activities (%)
Physical Activity - People doing moderate-intensity recreational activities (%)
Physical Activity - Average hours a day doing sedentary activities
Physical Activity - Average hours a day watching TV or videos
Physical Activity - Average hours a day using computer
Physical Functioning - People having limitations keeping them from working (%)
Physical Functioning - People limited in amount of work they can do (%)
Physical Functioning - People that need special equipment to walk (%)
Physical Functioning - People experiencing confusion/memory problems (%)
Physical Functioning - People requiring special healthcare equipment (%)
Prescription Medications - Average number of prescription medicines taking
Preventive Aspirin Use - Adults 40+ taking low-dose aspirin (%)
Reproductive Health - Vaginal deliveries (%)
Reproductive Health - Cesarean deliveries (%)
Reproductive Health - Deliveries resulted in a live birth (%)
Reproductive Health - Pregnancies resulted in a delivery (%)
Reproductive Health - Women breastfeeding newborns (%)
Reproductive Health - Women that had a hysterectomy (%)
Reproductive Health - Women that had both ovaries removed (%)
Reproductive Health - Women that have ever taken birth control pills (%)
Reproductive Health - Women taking birth control pills (%)
Reproductive Health - Women that have ever used Depo-Provera or injectables (%)
Reproductive Health - Women that have ever used female hormones (%)
Sexual Behavior - People 18+ that ever had sex (vaginal, anal, or oral) (%)
Sexual Behavior - Males 18+ that ever had vaginal sex with a woman (%)
Sexual Behavior - Males 18+ that ever performed oral sex on a woman (%)
Sexual Behavior - Males 18+ that ever had anal sex with a woman (%)
Sexual Behavior - Males 18+ that ever had any sex with a man (%)
Sexual Behavior - Females 18+ that ever had vaginal sex with a man (%)
Sexual Behavior - Females 18+ that ever performed oral sex on a man (%)
Sexual Behavior - Females 18+ that ever had anal sex with a man (%)
Sexual Behavior - Females 18+ that ever had any kind of sex with a woman (%)
Sexual Behavior - Average age people first had sex
Sexual Behavior - Average number of female sex partners in lifetime (males 18+)
Sexual Behavior - Average number of female vaginal sex partners in lifetime (males 18+)
Sexual Behavior - Average age people first performed oral sex on a woman (18+)
Sexual Behavior - Average number of woman performed oral sex on in lifetime (18+)
Sexual Behavior - Average number of male sex partners in lifetime (males 18+)
Sexual Behavior - Average number of male anal sex partners in lifetime (males 18+)
Sexual Behavior - Average age people first performed oral sex on a man (18+)
Sexual Behavior - Average number of male oral sex partners in lifetime (18+)
Sexual Behavior - People using protection when performing oral sex (%)
Sexual Behavior - Average number of times people have vaginal or anal sex a year
Sexual Behavior - People having sex without condom (%)
Sexual Behavior - Average number of male sex partners in lifetime (females 18+)
Sexual Behavior - Average number of male vaginal sex partners in lifetime (females 18+)
Sexual Behavior - Average number of female sex partners in lifetime (females 18+)
Sexual Behavior - Circumcised males 18+ (%)
Sleep Disorders - Average hours sleeping at night
Sleep Disorders - People that has trouble sleeping (%)
Smoking-Cigarette Use - People smoking cigarettes (%)
Taste & Smell - People 40+ having problems with smell (%)
Taste & Smell - People 40+ having problems with taste (%)
Taste & Smell - People 40+ that ever had wisdom teeth removed (%)
Taste & Smell - People 40+ that ever had tonsils teeth removed (%)
Taste & Smell - People 40+ that ever had a loss of consciousness because of a head injury (%)
Taste & Smell - People 40+ that ever had a broken nose or other serious injury to face or skull (%)
Taste & Smell - People 40+ that ever had two or more sinus infections (%)
Weight - Average height (inches)
Weight - Average weight (pounds)
Weight - Average BMI
Weight - People that are obese (%)
Weight - People that ever were obese (%)
Weight - People trying to lose weight (%)
56,407 61.5% White alone 19,598 21.4% Hispanic 10,475 11.4% Asian alone 3,873 4.2% Two or more races 1,040 1.1% Black alone 362 0.4% Other race alone 20 0.02% American Indian alone
According to our research of California and other state lists, there were 29 registered sex offenders living in Mission Viejo, California as of April 27, 2024 . The ratio of all residents to sex offenders in Mission Viejo is 3,359 to 1.The ratio of registered sex offenders to all residents in this city is much lower than the state average.
Officers per 1,000 residents here:
0.01California average:
1.98
Latest news from Mission Viejo, CA collected exclusively by city-data.com from local newspapers, TV, and radio stations
Mission Viejo, CA City Guides: Ancestries: American (6.5%), Iranian (5.7%), German (5.3%), English (5.0%), European (4.6%), Irish (4.3%).
Current Local Time:
Land area: 18.7 square miles.
Population density: 4,919 people per square mile (average).
21,012 residents are foreign born (12.1% Asia , 5.6% Latin America , 3.0% Europe ).
This city:
22.7%California:
26.5%
Median real estate property taxes paid for housing units with mortgages in 2022: $5,827 (0.6%)Median real estate property taxes paid for housing units with no mortgage in 2022: $3,984 (0.4%)
Nearest city with pop. 200,000+: South Coast, CA (7.0 miles
Nearest city with pop. 1,000,000+: Los Angeles, CA
Nearest cities:
Latitude: 33.61 N, Longitude: 117.66 W
Daytime population change due to commuting: -4,924 (-5.4%)Workers who live and work in this city: 17,631 (38.7%)
Area code commonly used in this area: 949
Mission Viejo tourist attractions:
Single-family new house construction building permits:
2022: 34 buildings , average cost: $269,9002021: 32 buildings , average cost: $316,5002020: 14 buildings , average cost: $315,8002018: 16 buildings , average cost: $282,0002017: 37 buildings , average cost: $372,1002016: 32 buildings , average cost: $324,8002014: 2 buildings , average cost: $425,0002013: 36 buildings , average cost: $131,2002012: 66 buildings , average cost: $143,1002011: 42 buildings , average cost: $136,8002010: 1 building , cost: $800,0002006: 1 building , cost: $460,0002001: 43 buildings , average cost: $237,5002000: 156 buildings , average cost: $187,7001999: 456 buildings , average cost: $227,3001998: 73 buildings , average cost: $257,8001997: 420 buildings , average cost: $216,900Unemployment in December 2023: Population change in the 1990s: +12,557 (+15.6%).
Most common occupations in Mission Viejo, CA (%)
Both Males Females
Other management occupations, except farmers and farm managers (8.5%)
Retail sales workers, except cashiers (4.6%)
Cooks and food preparation workers (4.4%)
Computer specialists (4.4%)
Engineers (3.5%)
Top executives (3.0%)
Sales representatives, services, wholesale and manufacturing (2.4%)
Other management occupations, except farmers and farm managers (10.1%)
Engineers (6.1%)
Computer specialists (5.8%)
Top executives (4.2%)
Retail sales workers, except cashiers (4.1%)
Cooks and food preparation workers (4.0%)
Sales representatives, services, wholesale and manufacturing (2.9%)
Other management occupations, except farmers and farm managers (6.6%)
Retail sales workers, except cashiers (5.2%)
Cooks and food preparation workers (4.9%)
Registered nurses (4.5%)
Secretaries and administrative assistants (4.2%)
Information and record clerks, except customer service representatives (3.3%)
Customer service representatives (3.1%)
Earthquake activity:
Mission Viejo-area historical earthquake activity is significantly above California state average. It is 6767% greater than the overall U.S. average. On 6/28/1992 at 11:57:34, a magnitude 7.6 (6.2 MB, 7.6 MS, 7.3 MW, Depth: 0.7 mi, Class: Major, Intensity: VIII - XII) earthquake occurred 75.7 miles away from the city center, causing 3 deaths ( 1 shaking deaths, 2 other deaths) and 400 injuries, causing $100,000,000 total damage and $40,000,000 insured lossesOn 7/21/1952 at 11:52:14, a magnitude 7.7 (7.7 UK) earthquake occurred 122.9 miles away from the city center, causing $50,000,000 total damage On 10/16/1999 at 09:46:44, a magnitude 7.4 (6.3 MB, 7.4 MS, 7.2 MW, 7.3 ML) earthquake occurred 93.8 miles away from the city center On 5/19/1940 at 04:36:40, a magnitude 7.2 (7.2 UK) earthquake occurred 116.3 miles away from the city center, causing $33,000,000 total damage On 4/21/1918 at 22:32:30, a magnitude 6.8 (6.8 UK, Class: Strong, Intensity: VII - IX) earthquake occurred 18.6 miles away from Mission Viejo center On 6/28/1992 at 15:05:30, a magnitude 6.9 (6.3 MB, 6.7 MS, 6.5 MW, 6.9 ME, Depth: 3.1 mi) earthquake occurred 67.1 miles away from the city center Magnitude types: body-wave magnitude (MB), energy magnitude (ME), local magnitude (ML), surface-wave magnitude (MS), moment magnitude (MW) Natural disasters: The number of natural disasters in Orange County (32) is a lot greater than the US average (15).Major Disasters (Presidential) Declared: 22Emergencies Declared: 2Floods: 15, Fires: 13, Storms: 9, Landslides: 6, Winter Storms: 6, Mudslides: 5, Earthquakes: 2, Heavy Rain: 1, Hurricane: 1, Snow: 1, Tornado: 1, Wind: 1, Other: 1 (Note: some incidents may be assigned to more than one category). Hospitals in Mission Viejo: ALICIA PARKWAY GUEST HOME (24152 ADONIS STREET) ARGUS HOME (24821 ARGUS DRIVE) ARTEMIA HOUSE (24531 ARTEMIA STREET) CAMPINA HOME (25242 CAMPINA STREET) CHARTER BEHAVIORAL HLTH SYS OF CA ATMV (provides emergency services, 23228 MADERO ST) CORONEL HOME (23851 CORONEL DRIVE) GOOD SHEPHERD - PAPAGAYO (26372 PAPAGAYO DRIVE) LONIKA HOME - APHENA (24336 APHENA AVE) LONIKA'S HOME (24371 SPARTAN STREET) MISSION HOSPITAL REGIONAL MED CENTER (Voluntary non-profit - Private, 27700 MEDICAL CENTER RD) QUALITY CARE HOME (26242 AVENIDA CALIDAD) Heliports located in Mission Viejo: Amtrak stations near Mission Viejo: 8 miles: IRVINE (15215 BARRANCA PKWY.) Services: ticket office, fully wheelchair accessible, enclosed waiting area, public restrooms, public payphones, snack bar, free short-term parking, free long-term parking, call for taxi service, intercity bus service, public transit connection.
8 miles: SAN JUAN CAPISTRANO (LEE HALL, MONTEREY AVE. & SAN GORGONIO WAY) Services: ticket office, fully wheelchair accessible, enclosed waiting area, public restrooms, public payphones, full-service food facilities, paid short-term parking, paid long-term parking, call for taxi service, intercity bus service, public transit connection.
9 miles: LAGUNA BEACH (TRANSIT DEPOT, BROADWAY BTW. BEACH & FOR) - Bus Station Operable nuclear power plants near Mission Viejo:
13 miles: San Onofre 2 and 3 in San Clemente, CA.
Colleges/Universities in Mission Viejo: Saddleback College Full-time enrollment: 13,716; Location: 28000 Marguerite Pky; Public; Website: www.saddleback.edu)
South Orange County Community College District Location: 28000 Marguerite Pky; Public; Website: www.socccd.edu)
Other colleges/universities with over 2000 students near Mission Viejo:
Brandman University (about 8 miles; Irvine, CA ; Full-time enrollment: 6,027)
Irvine Valley College (about 9 miles; Irvine, CA ; FT enrollment: 8,005)
Concordia University-Irvine (about 10 miles; Irvine, CA ; FT enrollment: 3,284)
University of California-Irvine (about 11 miles; Irvine, CA ; FT enrollment: 28,587)
Coastline Community College (about 12 miles; Fountain Valley, CA ; FT enrollment: 4,591)
University of Phoenix-Southern California Campus (about 15 miles; Costa Mesa, CA ; FT enrollment: 8,110)
Santiago Canyon College (about 15 miles; Orange, CA ; FT enrollment: 6,050)
Public high schools in Mission Viejo: TRABUCO HILLS HIGH Students: 2,373, Location: 27501 CORDOVA RD., Grades: 9-12)CAPISTRANO VALLEY HIGH Students: 2,018, Location: 26301 VIA ESCOLAR, Grades: 9-12)SILVERADO HIGH Students: 194, Location: 25632 PETER A. HARTMAN WAY, Grades: 9-12)ESPERANZA Students: 24, Location: 25121 PRADERA DR., Grades: 7-12)MIRA MONTE HIGH (ALTERNATIVE) Students: 22, Location: 25632 DISENO DR., Grades: 9-12)MISSION VIEJO HIGH Location: 25025 CHRISANTA DR., Grades: 9-12)
Private high schools in Mission Viejo: HERITAGE CHRISTIAN SCHOOL Students: 156, Location: 24162 ALICIA PKWY, Grades: PK-12)
HALSTROM HIGH-MISSION VIEJO Students: 117, Location: 26440 LA ALAMEDA STE 150, Grades: 9-12)
AGAPE ACADEMY Students: 48, Location: 23632 VIA CALZADA, Grades: KG-12)
FUSION ACADEMY - MISSION VIEJO Students: 31, Location: 23456 MADERO STE 140, Grades: 6-12)
Biggest public elementary/middle schools in Mission Viejo: NEWHART MIDDLE Students: 1,571, Location: 25001 VETERANS WAY, Grades: 6-8)LA PAZ INTERMEDIATE Students: 1,077, Location: 25151 PRADERA DR., Grades: 7-8)LOS ALISOS INTERMEDIATE Students: 1,025, Location: 25171 MOOR AVE., Grades: 7-8)BATHGATE ELEMENTARY Students: 455, Location: 27642 NAPOLI WAY, Grades: KG-5)CASTILLE ELEMENTARY Students: 430, Location: 24042 VIA LA CORUNA, Grades: KG-5)DE PORTOLA ELEMENTARY Students: 426, Location: 27031 PRECIADOS DR., Grades: KG-6)CORDILLERA ELEMENTARY Students: 408, Location: 25952 CORDILLERA DR., Grades: KG-6)LINDA VISTA ELEMENTARY Students: 370, Location: 25222 PERICIA DR., Grades: KG-6)DEL CERRO ELEMENTARY Students: 360, Location: 24382 REGINA ST., Grades: KG-6)DEL LAGO ELEMENTARY Students: 352, Location: 27181 ENTIDAD ST., Grades: KG-6)Private elementary/middle schools in Mission Viejo: MISSION VIEJO CHRISTIAN SCHOOL Students: 198, Location: 27192 JERONIMO RD, Grades: KG-8)CARDEN ACADEMY OF BASIC EDUCATION Students: 195, Location: 24741 CHRISANTA DR, Grades: KG-8)
LEPORT SCHOOLS - MISSION VIEJO Students: 111, Location: 22081 HIDALGO, Grades: PK-8)
MISSION VIEJO MONTESSORI Students: 61, Location: 23581 MADERO STE 108, Grades: PK-3)
PILLARS ACADEMY Students: 60, Location: 23581 MADERO STE 104, Grades: PK-5)
CORNERSTONE COMMUNITY SCHOOL Students: 36, Location: 23331 MOULTON PKWY, Grades: KG-8)
SONRISA SCHOOL Students: 10, Location: 26502 PEPITA DR, Grades: 1-8)
See full list of schools located in Mission Viejo Library in Mission Viejo: MISSION VIEJO LIBRARY Operating income: $3,005,379; Location: 100 CIVIC CENTER; 153,142 books ; 445 e-books ; 5,606 audio materials ; 7,075 video materials ; 30 local licensed databases ; 1 state licensed databases ; 230 print serial subscriptions )
User-submitted facts and corrections:
The Learning Experience Early Education Center is no longer on Alicia Parkway. It is now located at23421 Madero, Mission Viejo 92691
Notable locations in Mission Viejo: (A) , Casta Del Sol Golf Course (B) , Mission Viejo Golf Club (C) , Mission Viejo Branch Orange County Public Library (D) , Medix Ambulance Service (E) , Orange County Fire Authority Station 9 (F) , Orange County Fire Authority Station 24 (G) , Orange County Fire Authority Station 31 (H) . Display/hide their locations on the map
Shopping Centers: (1) , Gateway Shopping Center (2) , Market on the Lake Shopping Center (3) . Display/hide their locations on the map
Reservoirs: (A) , Oso Creek Dam (B) , Lake Mission Viejo (C) , Upper Oso Reservoir (D) . Display/hide their locations on the map
Parks in Mission Viejo include: (1) , Crucero Park (2) , Flamenco Park (3) , Melinda Park (4) , Minaya Park (5) , Mission Viejo Youth Athletic Park (6) , Pebble Creek Park (7) , Seville Park (8) , Vista del Lago Park (9) . Display/hide their locations on the map
Tourist attraction: (1) . Display/hide its approximate location on the map
Hotel: (1) . Display/hide its approximate location on the map
Birthplace of: Phil Hughes - Baseball player, Jordan Harvey - Soccer player, Chris Sulages - College football player, David Henrie - Actor, Brian Finneran - 2005 NFL player (Atlanta Falcons, born : Jan 31, 1976), Matt Sorum - Heavy metal drummer, Kristy Swanson - Actress, Kaitlin Sandeno - Swimmer, Cameron Tringale - Professional golfer, Casey Cordray - Soccer player.
Orange County has a predicted average indoor radon screening level less than 2 pCi/L (pico curies per liter) - Low Potential Drinking water stations with addresses in Mission Viejo and their reported violations in the past:
BRICKERHAVEN SUBDIVISION (Serves UT, Population served: 150, Groundwater):
Past monitoring violations:
Failure To Address Deficiency - In MAR-20-2013, Contaminant: GROUNDWATER RULE. Follow-up actions: St Public Notif requested (JAN-30-2014), St Formal NOV issued (JAN-30-2014), St Public Notif requested (JAN-30-2014), St Formal NOV issued (JAN-30-2014)
Failure To Address Deficiency - In MAR-20-2013, Contaminant: GROUNDWATER RULE. Follow-up actions: St Public Notif requested (JAN-30-2014), St Formal NOV issued (JAN-30-2014), St Public Notif requested (JAN-30-2014), St Formal NOV issued (JAN-30-2014)
Failure To Address Deficiency - In MAR-20-2013, Contaminant: GROUNDWATER RULE. Follow-up actions: St Formal NOV issued (2 times from JAN-30-2014 to JAN-30-2014), St Public Notif requested (2 times from JAN-30-2014 to JAN-30-2014), St Compliance achieved (MAR-20-2014)
Failure To Address Deficiency - In MAR-20-2013, Contaminant: GROUNDWATER RULE. Follow-up actions: St Public Notif requested (JAN-30-2014), St Formal NOV issued (JAN-30-2014), St Public Notif requested (JAN-30-2014), St Formal NOV issued (JAN-30-2014)
Failure To Address Deficiency - In FEB-24-2010, Contaminant: GROUNDWATER RULE. Follow-up actions: St Public Notif requested (JAN-30-2014), St Formal NOV issued (JAN-30-2014), St Public Notif requested (JAN-30-2014), St Formal NOV issued (JAN-30-2014)
One routine major monitoring violation
One regular monitoring violation
Population served: 25, Groundwater):
Past monitoring violations:
One regular monitoring violation
Average household size: This city:
2.8 peopleCalifornia:
2.9 people
Percentage of family households: This city:
75.5%Whole state:
68.7%
Percentage of households with unmarried partners: This city:
4.3%Whole state:
7.2%
Likely homosexual households (counted as self-reported same-sex unmarried-partner households)
Lesbian couples: 0.4% of all households Gay men: 0.3% of all households
People in group quarters in Mission Viejo in 2010:
639 people in group homes intended for adults
183 people in workers' group living quarters and job corps centers
66 people in nursing facilities/skilled-nursing facilities
19 people in residential treatment centers for adults
18 people in other noninstitutional facilities
10 people in residential treatment centers for juveniles (non-correctional)
7 people in group homes for juveniles (non-correctional)
People in group quarters in Mission Viejo in 2000:
940 people in other noninstitutional group quarters
68 people in homes for the mentally retarded
32 people in nursing homes
13 people in homes for the physically handicapped
11 people in other group homes
Banks with most branches in Mission Viejo (2011 data):
Wells Fargo Bank, National Association: Lake Mission Viejo Branch, Mission Viejo Branch, Gateway Center Business Center, Marguerite Parkway Branch, Mission Viejo Market Place. Info updated 2011/04/05: Bank assets: $1,161,490.0 mil, Deposits: $905,653.0 mil, headquarters in Sioux Falls, SD, positive income , 6395 total offices , Holding Company: Wells Fargo & Company
JPMorgan Chase Bank, National Association: Mission Viejo Branch, 27752 Vista Del Lago Branch, Mission Viejo/Gateway Center Branch, Muirlands Blvd Albertsons Banking Ce, Mission Viejo/Crown Valley Branch. Info updated 2011/11/10: Bank assets: $1,811,678.0 mil, Deposits: $1,190,738.0 mil, headquarters in Columbus, OH, positive income , International Specialization, 5577 total offices , Holding Company: Jpmorgan Chase & Co.
Bank of America, National Association: Crown Valley Center Branch, Mission Viejo Branch, Oso Marguerite Branch. Info updated 2009/11/18: Bank assets: $1,451,969.3 mil, Deposits: $1,077,176.8 mil, headquarters in Charlotte, NC, positive income , 5782 total offices , Holding Company: Bank Of America Corporation
U.S. Bank National Association: Crown Valley Center Branch, Mission Viejo Branch, Mission Viejo Vons Branch. Info updated 2012/01/30: Bank assets: $330,470.8 mil, Deposits: $236,091.5 mil, headquarters in Cincinnati, OH, positive income , 3121 total offices , Holding Company: U.S. Bancorp
Union Bank, National Association: North Mission Viejo Branch at 25276 Santa Marguerite Parkway, branch established on 1997/08/18; North Mission Viejo Instore Branch at 27730 Santa Margarita Pkwy, branch established on 1992/11/20. Info updated 2011/09/01: Bank assets: $88,967.5 mil, Deposits: $65,286.4 mil, headquarters in San Francisco, CA, positive income , Commercial Lending Specialization, 403 total offices , Holding Company: Mitsubishi Ufj Financial Group, Inc.
OneWest Bank, FSB: Mission Viejo Branch at 23072 Alicia Parkway, branch established on 2008/02/29; Mission Viejo Branch at 28311 Marguerite Parkway Ste B, branch established on 2007/03/19. Info updated 2011/07/21: Bank assets: $26,181.3 mil, Deposits: $15,408.4 mil, headquarters in Pasadena, CA, positive income , 79 total offices
First-Citizens Bank & Trust Company: Mission Viejo Branch at 26980 Crown Valley Parkway, branch established on 2003/11/10. Info updated 2011/10/11: Bank assets: $20,566.4 mil, Deposits: $17,596.8 mil, headquarters in Raleigh, NC, positive income , Commercial Lending Specialization, 433 total offices , Holding Company: First Citizens Bancshares, Inc.
Citibank, National Association: Mission Viejo Branch at 25330-C Marguerite Parkway, branch established on 1934/12/17. Info updated 2012/01/10: Bank assets: $1,288,658.0 mil, Deposits: $882,541.0 mil, headquarters in Sioux Falls, SD, positive income , International Specialization, 1048 total offices , Holding Company: Citigroup Inc.
Bank of the West: Mission Viejo Branch at 26941 Crown Valley Parkway, branch established on 1979/11/26. Info updated 2009/11/16: Bank assets: $62,408.3 mil, Deposits: $43,995.2 mil, headquarters in San Francisco, CA, positive income , 647 total offices , Holding Company: Bnp Paribas
2 other banks with 2 local branches
For population 15 years and over in Mission Viejo:
Never married: 28.7%Now married: 55.1%Separated: 1.2%Widowed: 5.2%Divorced: 9.8% For population 25 years and over in Mission Viejo:
High school or higher: 91.7%Bachelor's degree or higher: 50.9%Graduate or professional degree: 18.4%Unemployed: 3.3%Mean travel time to work (commute): 20.0 minutes
Education Gini index (Inequality in education) Here:
12.8California average:
15.5
Religion statistics for Mission Viejo, CA (based on Orange County data)
Religion Adherents Congregations Catholic 797,473 67 Evangelical Protestant 345,893 894 Other 141,815 329 Mainline Protestant 76,574 202 Orthodox 13,406 19 Black Protestant 2,424 8 None 1,632,647 -
Source: Clifford Grammich, Kirk Hadaway, Richard Houseal, Dale E.Jones, Alexei Krindatch, Richie Stanley and Richard H.Taylor. 2012. 2010 U.S.Religion Census: Religious Congregations & Membership Study. Association of Statisticians of American Religious Bodies. Jones, Dale E., et al. 2002. Congregations and Membership in the United States 2000. Nashville, TN: Glenmary Research Center. Graphs represent county-level data
Food Environment Statistics: Number of grocery stores : 530Orange County :
1.78 / 10,000 pop.California :
2.14 / 10,000 pop.
Number of supercenters and club stores : 18This county :
0.06 / 10,000 pop.California :
0.04 / 10,000 pop.
Number of convenience stores (no gas) : 147This county :
0.49 / 10,000 pop.California :
0.62 / 10,000 pop.
Number of convenience stores (with gas) : 434This county :
1.46 / 10,000 pop.California :
1.49 / 10,000 pop.
Number of full-service restaurants : 2,438Orange County :
8.19 / 10,000 pop.California :
7.42 / 10,000 pop.
Adult diabetes rate : Orange County :
6.3%California :
7.3%
Adult obesity rate : This county :
18.5%California :
21.3%
Low-income preschool obesity rate : This county :
16.4%California :
17.9%
Health and Nutrition: Healthy diet rate : Mission Viejo:
53.7%California:
49.4%
Average overall health of teeth and gums : This city:
53.0%California:
48.0%
Average BMI : This city:
28.0California:
28.1
People feeling badly about themselves : Mission Viejo:
19.3%California:
20.2%
People not drinking alcohol at all : Mission Viejo:
9.6%California:
11.2%
Average hours sleeping at night : Mission Viejo:
6.9California:
6.8
Overweight people : Mission Viejo:
33.6%State:
31.5%
General health condition : Mission Viejo:
60.1%California:
56.4%
Average condition of hearing : Mission Viejo:
80.9%State:
80.9%
More about Health and Nutrition of Mission Viejo, CA Residents
Local government employment and payroll (March 2022)
Function
Full-time employees
Monthly full-time payroll
Average yearly full-time wage
Part-time employees
Monthly part-time payroll
Other Government Administration
22 $175,039 $95,476 5 $14,858 Health
21 $118,889 $67,937 6 $7,347 Parks and Recreation
21 $144,301 $82,458 54 $63,171 Financial Administration
20 $163,769 $98,261 1 $1,670 Local Libraries
17 $119,782 $84,552 52 $114,275 Streets and Highways
14 $128,575 $110,207 0 $0 Other and Unallocable
5 $42,993 $103,183 2 $6,898
Totals for Government
120 $893,347 $89,335 120 $208,218
Mission Viejo government finances - Expenditure in 2021 (per resident):
Construction - Regular Highways: $5,228,000 ($56.96)
Parks and Recreation: $901,000 ($9.82)General - Other: $61,000 ($0.66)Current Operations - Police Protection: $20,721,000 ($225.78)
Parks and Recreation: $16,332,000 ($177.96)Central Staff Services: $10,463,000 ($114.01)Regular Highways: $9,273,000 ($101.04)Health - Other: $3,625,000 ($39.50)Libraries: $3,177,000 ($34.62)General - Other: $3,004,000 ($32.73)Protective Inspection and Regulation - Other: $2,731,000 ($29.76)Housing and Community Development: $2,701,000 ($29.43)Financial Administration: $1,464,000 ($15.95)Judicial and Legal Services: $320,000 ($3.49)Transit Utilities: $169,000 ($1.84)Miscellaneous Commercial Activities - Other: $145,000 ($1.58)General - Interest on Debt: $2,212,000 ($24.10)
Other Capital Outlay - General - Other: $933,000 ($10.17)
Police Protection: $121,000 ($1.32)Parks and Recreation: $22,000 ($0.24)
Mission Viejo government finances - Revenue in 2021 (per resident):
Charges - Other: $6,930,000 ($75.51)
Parks and Recreation: $4,007,000 ($43.66)Miscellaneous Commercial Activities: $476,000 ($5.19)Federal Intergovernmental - Other: $1,638,000 ($17.85)
Housing and Community Development: $1,112,000 ($12.12)Miscellaneous - Special Assessments: $4,455,000 ($48.54)
General Revenue - Other: $3,162,000 ($34.45)Rents: $2,421,000 ($26.38)Fines and Forfeits: $385,000 ($4.19)Sale of Property: $205,000 ($2.23)Donations From Private Sources: $191,000 ($2.08)Interest Earnings: $187,000 ($2.04)State Intergovernmental - Highways: $3,861,000 ($42.07)
Other: $929,000 ($10.12)General Local Government Support: $122,000 ($1.33)Tax - Property: $37,695,000 ($410.73)
General Sales and Gross Receipts: $20,743,000 ($226.02)Public Utilities Sales: $2,861,000 ($31.17)Other License: $2,417,000 ($26.34)Documentary and Stock Transfer: $930,000 ($10.13)Other Selective Sales: $635,000 ($6.92)
Mission Viejo government finances - Debt in 2021 (per resident):
Long Term Debt - Beginning Outstanding - Unspecified Public Purpose: $63,973,000 ($697.06)
Outstanding Unspecified Public Purpose: $57,893,000 ($630.81)Retired Unspecified Public Purpose: $6,094,000 ($66.40)Issue, Unspecified Public Purpose: $13,000 ($0.14)
Mission Viejo government finances - Cash and Securities in 2021 (per resident):
Bond Funds - Cash and Securities: $3,640,000 ($39.66)
Other Funds - Cash and Securities: $61,797,000 ($673.35)
Sinking Funds - Cash and Securities: $5,388,000 ($58.71)
4.86% of this county's 2021 resident taxpayers lived in other counties in 2020 ($95,983 average adjusted gross income )
Here:
4.86%California average:
5.19%
0.01% of residents moved from foreign countries ($132 average AGI )Orange County:
0.01%California average:
0.03%
Top counties from which taxpayers relocated into this county between 2020 and 2021:
5.71% of this county's 2020 resident taxpayers moved to other counties in 2021 ($106,828 average adjusted gross income )
Here:
5.71%California average:
6.14%
0.01% of residents moved to foreign countries ($180 average AGI )Orange County:
0.01%California average:
0.02%
Top counties to which taxpayers relocated from this county between 2020 and 2021:
Businesses in Mission Viejo, CA
Name Count Name Count
24 Hour Fitness 1 Justice 1 7-Eleven 1 Kincaid 1 ALDO 1 Kroger 3 AT&T 1 LA Fitness 1 Abercrombie & Fitch 1 La-Z-Boy 1 Ace Hardware 1 Lane Bryant 1 Aeropostale 1 LensCrafters 1 Albertsons 2 Little Caesars Pizza 1 American Eagle Outfitters 1 Macy's 1 Ann Taylor 2 Marriott 1 Apple Store 1 McDonald's 3 Audi 1 Men's Wearhouse 1 AutoZone 1 Motherhood Maternity 2 Baja Fresh Mexican Grill 2 New Balance 4 Banana Republic 1 Nike 15 Baskin-Robbins 2 Nordstrom 1 Bath & Body Works 1 OfficeMax 1 Bebe 1 Old Navy 1 Bed Bath & Beyond 1 Pac Sun 1 Blockbuster 1 Panda Express 2 Brookstone 1 Papa John's Pizza 1 Buffalo Wild Wings 1 Payless 1 CVS 5 Pier 1 Imports 1 Cache 1 Pizza Hut 2 Carl\s Jr. 2 Pottery Barn 1 Charlotte Russe 1 Pottery Barn Kids 1 Chico's 1 SONIC Drive-In 1 Circle K 2 Safeway 2 Cold Stone Creamery 1 Sephora 1 Coldwater Creek 1 Skechers USA 1 DHL 2 Spencer Gifts 1 Dairy Queen 1 Starbucks 9 Dennys 1 T-Mobile 3 Discount Tire 2 T.J.Maxx 1 Domino's Pizza 2 Taco Bell 3 El Pollo Loco 1 Talbots 1 Express 1 Target 2 FedEx 12 The Cheesecake Factory 1 Forever 21 1 Toys"R"Us 1 GNC 2 Trader Joe's 1 GameStop 2 True Value 2 Gap 2 U-Haul 1 Gymboree 1 UPS 13 H&M 1 Vans 2 H&R Block 2 Victoria's Secret 1 Haagen-Dazs 1 Vons 2 Home Depot 1 Walgreens 2 J.Crew 1 Wet Seal 1 Jamba Juice 2 YMCA 1 Jones New York 4 Z Gallerie 1
Strongest AM radio stations in Mission Viejo:
KPLS (830 AM; 50 kW; ORANGE, CA; Owner: CRN LICENSES, LLC)
KFI (640 AM; 50 kW; LOS ANGELES, CA; Owner: CAPSTAR TX LIMITED PARTNERSHIP)
KLAC (570 AM; 50 kW; LOS ANGELES, CA; Owner: AMFM RADIO LICENSES, L.L.C.)
KTNQ (1020 AM; 50 kW; LOS ANGELES, CA; Owner: KTNQ-AM LICENSE CORP.)
KXTA (1150 AM; 50 kW; LOS ANGELES, CA; Owner: CITICASTERS LICENSES, L.P.)
KDIS (1110 AM; 50 kW; PASADENA, CA; Owner: ABC,INC.)
KFWB (980 AM; 50 kW; LOS ANGELES, CA; Owner: INFINITY BROADCASTING OPERATIONS, INC.)
KNX (1070 AM; 50 kW; LOS ANGELES, CA; Owner: INFINITY BROADCASTING OPERATIONS, INC.)
KSPN (710 AM; 50 kW; LOS ANGELES, CA; Owner: KABC-AM RADIO, INC.)
KMPC (1540 AM; 50 kW; LOS ANGELES, CA; Owner: ROSE CITY RADIO CORPORATION)
KFMB (760 AM; 50 kW; SAN DIEGO, CA; Owner: MIDWEST TELEVISION, INC.)
KBLA (1580 AM; 50 kW; SANTA MONICA, CA)
KVNR (1480 AM; 5 kW; SANTA ANA, CA; Owner: LBI RADIO LICENSE CORP.)
Strongest FM radio stations in Mission Viejo:
KWVE (107.9 FM; SAN CLEMENTE, CA; Owner: CALVARY CHAPEL OF COSTA MESA)
KSBR (88.5 FM; MISSION VIEJO, CA; Owner: SADDLEBACK COMMUNITY COLLEGE DIST.)
KRTM (88.9 FM; TEMECULA, CA; Owner: PENFOLD COMMUNICATIONS, INC.)
KDLE (103.1 FM; NEWPORT BEACH, CA; Owner: ENTRAVISION HOLDINGS, LLC.)
KLRD (90.1 FM; YUCAIPA, CA; Owner: EDUCATIONAL MEDIA FOUNDATION)
KCBS-FM (93.1 FM; LOS ANGELES, CA; Owner: INFINITY BROADCASTING OPERATIONS, INC.)
KUOR-FM (89.1 FM; REDLANDS, CA; Owner: UNIVERSITY OF REDLANDS)
KSCA (101.9 FM; GLENDALE, CA; Owner: HBC LICENSE CORPORATION)
KLOS (95.5 FM; LOS ANGELES, CA; Owner: KLOS-FM RADIO, INC.)
K212FA (90.3 FM; TEMPLE CITY, CA; Owner: EDUCATIONAL MEDIA FOUNDATION)
KOST (103.5 FM; LOS ANGELES, CA; Owner: CAPSTAR TX LIMITED PARTNERSHIP)
KZLA-FM (93.9 FM; LOS ANGELES, CA; Owner: EMMIS RADIO LICENSE CORPORATION)
KPWR (105.9 FM; LOS ANGELES, CA; Owner: EMMIS RADIO LICENSE CORPORATION)
KLVE (107.5 FM; LOS ANGELES, CA; Owner: KLVE-FM LICENSE CORP.)
KIIS-FM (102.7 FM; LOS ANGELES, CA; Owner: CITICASTERS LICENSES, L.P.)
KLSX (97.1 FM; LOS ANGELES, CA; Owner: INFINITY BROADCASTING OPERATIONS, INC.)
KPCC (89.3 FM; PASADENA, CA; Owner: PASADENA AREA COMMUNITY COLLEGE DISTRICT)
KHHT (92.3 FM; LOS ANGELES, CA; Owner: AMFM RADIO LICENSES, L.L.C.)
KBIG-FM (104.3 FM; LOS ANGELES, CA; Owner: AMFM RADIO LICENSES, L.L.C.)
KUSC (91.5 FM; LOS ANGELES, CA; Owner: UNIVERSITY OF SOUTHERN CALIFORNIA)
TV broadcast stations around Mission Viejo:
KTRO-LP (Channel 50; LANCASTER, CA; Owner: ROBERT D. ADELMAN)
Home Mortgage Disclosure Act Aggregated Statistics For Year 2009(Based on 14 full and 10 partial tracts) A) FHA, FSA/RHS & VA B) Conventional C) Refinancings D) Home Improvement Loans F) Non-occupant Loans on G) Loans On Manufactured Number Average Value Number Average Value Number Average Value Number Average Value Number Average Value Number Average Value
LOANS ORIGINATED 293 $403,379 582 $351,414 3,154 $324,462 123 $244,449 156 $254,982 0 $0 APPLICATIONS APPROVED, NOT ACCEPTED 22 $366,860 65 $376,083 369 $355,476 17 $166,575 9 $227,961 1 $136,990 APPLICATIONS DENIED 51 $380,188 111 $329,809 797 $369,494 45 $183,950 62 $267,784 0 $0 APPLICATIONS WITHDRAWN 50 $391,103 84 $364,782 552 $351,246 23 $264,710 33 $269,467 0 $0 FILES CLOSED FOR INCOMPLETENESS 10 $298,725 24 $332,014 165 $364,809 3 $247,127 8 $284,925 0 $0
Aggregated Statistics For Year 2008(Based on 14 full and 10 partial tracts) A) FHA, FSA/RHS & VA B) Conventional C) Refinancings D) Home Improvement Loans F) Non-occupant Loans on G) Loans On Manufactured Number Average Value Number Average Value Number Average Value Number Average Value Number Average Value Number Average Value
LOANS ORIGINATED 147 $428,343 711 $357,944 1,240 $334,570 135 $150,730 131 $263,717 3 $78,253 APPLICATIONS APPROVED, NOT ACCEPTED 18 $428,856 133 $360,076 255 $352,028 30 $163,195 32 $290,470 5 $80,582 APPLICATIONS DENIED 32 $396,110 181 $411,965 638 $421,266 103 $161,951 47 $265,991 3 $92,413 APPLICATIONS WITHDRAWN 23 $388,097 138 $342,012 289 $386,919 31 $169,193 26 $287,315 0 $0 FILES CLOSED FOR INCOMPLETENESS 5 $272,152 39 $433,709 93 $369,040 14 $194,165 11 $266,819 0 $0
Aggregated Statistics For Year 2007(Based on 14 full and 10 partial tracts) A) FHA, FSA/RHS & VA B) Conventional C) Refinancings D) Home Improvement Loans E) Loans on Dwellings For 5+ Families F) Non-occupant Loans on G) Loans On Manufactured Number Average Value Number Average Value Number Average Value Number Average Value Number Average Value Number Average Value Number Average Value
LOANS ORIGINATED 3 $314,160 1,088 $406,569 2,440 $378,904 310 $225,417 1 $10,000 219 $368,940 4 $138,278 APPLICATIONS APPROVED, NOT ACCEPTED 0 $0 256 $391,996 518 $415,326 66 $229,145 0 $0 51 $378,491 4 $152,620 APPLICATIONS DENIED 1 $260,000 395 $408,084 1,141 $460,651 125 $240,252 0 $0 77 $373,126 7 $106,791 APPLICATIONS WITHDRAWN 2 $201,000 181 $460,883 457 $425,970 61 $272,846 0 $0 34 $390,001 0 $0 FILES CLOSED FOR INCOMPLETENESS 0 $0 41 $437,021 196 $419,077 16 $249,574 0 $0 9 $444,171 0 $0
Aggregated Statistics For Year 2006(Based on 14 full and 10 partial tracts) A) FHA, FSA/RHS & VA B) Conventional C) Refinancings D) Home Improvement Loans F) Non-occupant Loans on G) Loans On Manufactured Number Average Value Number Average Value Number Average Value Number Average Value Number Average Value Number Average Value
LOANS ORIGINATED 1 $242,420 1,723 $397,117 3,357 $397,869 452 $243,846 331 $364,273 6 $84,627 APPLICATIONS APPROVED, NOT ACCEPTED 0 $0 260 $366,429 605 $396,213 65 $246,097 47 $361,871 4 $55,502 APPLICATIONS DENIED 0 $0 531 $388,635 1,176 $434,659 163 $263,761 117 $383,061 3 $59,667 APPLICATIONS WITHDRAWN 0 $0 259 $393,310 790 $408,741 80 $277,244 48 $367,472 0 $0 FILES CLOSED FOR INCOMPLETENESS 0 $0 68 $368,716 238 $383,907 19 $259,905 18 $343,667 0 $0
Aggregated Statistics For Year 2005(Based on 14 full and 10 partial tracts) A) FHA, FSA/RHS & VA B) Conventional C) Refinancings D) Home Improvement Loans F) Non-occupant Loans on G) Loans On Manufactured Number Average Value Number Average Value Number Average Value Number Average Value Number Average Value Number Average Value
LOANS ORIGINATED 3 $179,750 2,406 $384,848 4,163 $378,937 517 $235,433 397 $325,816 3 $188,240 APPLICATIONS APPROVED, NOT ACCEPTED 1 $272,000 397 $345,289 619 $377,069 61 $241,409 80 $327,660 2 $119,000 APPLICATIONS DENIED 0 $0 577 $385,757 1,054 $404,802 186 $208,636 105 $339,598 7 $111,487 APPLICATIONS WITHDRAWN 0 $0 352 $404,054 938 $376,003 142 $237,972 61 $357,627 1 $41,240 FILES CLOSED FOR INCOMPLETENESS 0 $0 102 $378,406 367 $386,500 29 $214,697 18 $366,718 0 $0
Aggregated Statistics For Year 2004(Based on 14 full and 10 partial tracts) A) FHA, FSA/RHS & VA B) Conventional C) Refinancings D) Home Improvement Loans E) Loans on Dwellings For 5+ Families F) Non-occupant Loans on G) Loans On Manufactured Number Average Value Number Average Value Number Average Value Number Average Value Number Average Value Number Average Value Number Average Value
LOANS ORIGINATED 9 $243,838 2,306 $366,639 5,700 $326,368 554 $225,354 2 $10,050,975 498 $287,075 7 $88,021 APPLICATIONS APPROVED, NOT ACCEPTED 1 $194,670 322 $356,166 835 $326,236 74 $174,934 0 $0 78 $303,319 0 $0 APPLICATIONS DENIED 4 $214,225 422 $365,005 1,122 $345,235 194 $162,283 0 $0 90 $314,622 2 $27,975 APPLICATIONS WITHDRAWN 2 $415,930 338 $351,411 1,158 $320,854 122 $187,104 0 $0 60 $258,261 3 $84,017 FILES CLOSED FOR INCOMPLETENESS 0 $0 88 $347,512 322 $336,991 29 $125,318 0 $0 18 $299,191 0 $0
Aggregated Statistics For Year 2003(Based on 14 full and 10 partial tracts) A) FHA, FSA/RHS & VA B) Conventional C) Refinancings D) Home Improvement Loans E) Loans on Dwellings For 5+ Families F) Non-occupant Loans on Number Average Value Number Average Value Number Average Value Number Average Value Number Average Value Number Average Value
LOANS ORIGINATED 48 $211,557 2,823 $291,502 13,068 $252,577 253 $93,177 1 $14,158,800 705 $204,798 APPLICATIONS APPROVED, NOT ACCEPTED 4 $106,132 341 $291,801 1,515 $257,879 54 $112,569 0 $0 106 $251,009 APPLICATIONS DENIED 7 $284,383 381 $276,649 1,659 $272,185 92 $63,429 0 $0 109 $247,100 APPLICATIONS WITHDRAWN 6 $257,532 307 $288,607 1,776 $264,339 46 $92,804 0 $0 73 $215,158 FILES CLOSED FOR INCOMPLETENESS 3 $190,360 107 $319,830 384 $263,027 15 $66,914 0 $0 41 $195,564
Aggregated Statistics For Year 2002(Based on 6 full and 1 partial tracts) A) FHA, FSA/RHS & VA B) Conventional C) Refinancings D) Home Improvement Loans F) Non-occupant Loans on Number Average Value Number Average Value Number Average Value Number Average Value Number Average Value
LOANS ORIGINATED 28 $207,152 927 $242,107 3,259 $227,630 62 $91,143 168 $198,694 APPLICATIONS APPROVED, NOT ACCEPTED 1 $47,000 151 $255,737 430 $227,637 21 $51,550 21 $229,230 APPLICATIONS DENIED 3 $194,190 125 $240,596 410 $230,350 26 $51,638 33 $233,073 APPLICATIONS WITHDRAWN 1 $130,000 102 $245,856 519 $226,603 13 $95,100 19 $192,666 FILES CLOSED FOR INCOMPLETENESS 1 $160,000 53 $260,900 139 $233,270 0 $0 12 $171,982
Aggregated Statistics For Year 2001(Based on 6 full and 1 partial tracts) A) FHA, FSA/RHS & VA B) Conventional C) Refinancings D) Home Improvement Loans E) Loans on Dwellings For 5+ Families F) Non-occupant Loans on Number Average Value Number Average Value Number Average Value Number Average Value Number Average Value Number Average Value
LOANS ORIGINATED 38 $202,648 809 $214,079 2,425 $206,318 95 $49,665 1 $8,400,000 113 $175,729 APPLICATIONS APPROVED, NOT ACCEPTED 2 $196,465 92 $210,120 335 $200,180 18 $56,538 0 $0 15 $191,991 APPLICATIONS DENIED 4 $200,698 136 $217,093 467 $212,619 43 $49,993 0 $0 13 $141,344 APPLICATIONS WITHDRAWN 6 $246,465 75 $210,827 455 $198,852 26 $46,105 0 $0 33 $207,949 FILES CLOSED FOR INCOMPLETENESS 0 $0 22 $211,960 110 $208,096 5 $26,050 0 $0 5 $194,434
Aggregated Statistics For Year 2000(Based on 6 full and 1 partial tracts) A) FHA, FSA/RHS & VA B) Conventional C) Refinancings D) Home Improvement Loans E) Loans on Dwellings For 5+ Families F) Non-occupant Loans on Number Average Value Number Average Value Number Average Value Number Average Value Number Average Value Number Average Value
LOANS ORIGINATED 47 $181,817 991 $211,727 566 $160,092 122 $38,875 1 $3,000,000 51 $177,000 APPLICATIONS APPROVED, NOT ACCEPTED 3 $179,460 188 $222,170 101 $150,198 43 $41,022 0 $0 8 $140,876 APPLICATIONS DENIED 7 $170,799 175 $209,631 230 $153,640 60 $30,899 0 $0 15 $163,647 APPLICATIONS WITHDRAWN 7 $169,723 126 $197,687 147 $134,023 22 $36,551 0 $0 6 $122,333 FILES CLOSED FOR INCOMPLETENESS 2 $95,500 32 $220,561 82 $202,886 8 $26,250 0 $0 3 $161,533
Aggregated Statistics For Year 1999(Based on 7 full and 8 partial tracts) A) FHA, FSA/RHS & VA B) Conventional C) Refinancings D) Home Improvement Loans E) Loans on Dwellings For 5+ Families F) Non-occupant Loans on Number Average Value Number Average Value Number Average Value Number Average Value Number Average Value Number Average Value
LOANS ORIGINATED 327 $148,224 2,501 $194,301 3,318 $176,087 301 $34,835 5 $344,602 265 $142,548 APPLICATIONS APPROVED, NOT ACCEPTED 15 $151,614 295 $207,444 636 $176,204 88 $29,888 0 $0 40 $133,934 APPLICATIONS DENIED 49 $143,701 456 $185,016 944 $166,579 145 $33,289 1 $79,490 64 $144,252 APPLICATIONS WITHDRAWN 35 $135,681 409 $185,507 658 $160,699 27 $45,062 2 $253,305 33 $155,345 FILES CLOSED FOR INCOMPLETENESS 5 $117,328 128 $201,792 255 $172,529 8 $52,834 0 $0 9 $122,350
Detailed mortgage data for all 24 tracts in Mission Viejo, CA
Private Mortgage Insurance Companies Aggregated Statistics For Year 2009(Based on 14 full and 10 partial tracts) A) Conventional B) Refinancings Number Average Value Number Average Value
LOANS ORIGINATED 50 $400,995 17 $403,228 APPLICATIONS APPROVED, NOT ACCEPTED 21 $406,855 19 $393,451 APPLICATIONS DENIED 19 $362,303 11 $368,837 APPLICATIONS WITHDRAWN 11 $399,860 2 $328,335 FILES CLOSED FOR INCOMPLETENESS 1 $415,390 2 $340,530
Aggregated Statistics For Year 2008(Based on 14 full and 9 partial tracts) A) Conventional B) Refinancings C) Non-occupant Loans on Number Average Value Number Average Value Number Average Value
LOANS ORIGINATED 115 $397,465 22 $402,215 2 $448,730 APPLICATIONS APPROVED, NOT ACCEPTED 42 $383,860 19 $456,607 1 $577,800 APPLICATIONS DENIED 22 $419,290 5 $375,428 1 $409,320 APPLICATIONS WITHDRAWN 8 $398,604 4 $549,900 0 $0 FILES CLOSED FOR INCOMPLETENESS 2 $372,460 2 $441,395 2 $441,395
Aggregated Statistics For Year 2007(Based on 13 full and 7 partial tracts) A) Conventional B) Refinancings C) Non-occupant Loans on Number Average Value Number Average Value Number Average Value
LOANS ORIGINATED 39 $458,646 34 $469,847 3 $532,420 APPLICATIONS APPROVED, NOT ACCEPTED 6 $414,257 18 $414,806 3 $399,663 APPLICATIONS DENIED 2 $668,500 14 $660,300 2 $498,500 APPLICATIONS WITHDRAWN 0 $0 7 $381,311 2 $339,500 FILES CLOSED FOR INCOMPLETENESS 0 $0 1 $502,100 0 $0
Aggregated Statistics For Year 2006(Based on 11 full and 9 partial tracts) A) Conventional B) Refinancings C) Non-occupant Loans on Number Average Value Number Average Value Number Average Value
LOANS ORIGINATED 14 $497,059 7 $480,166 1 $431,670 APPLICATIONS APPROVED, NOT ACCEPTED 2 $519,230 4 $544,228 0 $0 APPLICATIONS DENIED 0 $0 7 $622,074 1 $675,000 APPLICATIONS WITHDRAWN 1 $317,430 4 $606,500 2 $634,000 FILES CLOSED FOR INCOMPLETENESS 1 $510,000 0 $0 0 $0
Aggregated Statistics For Year 2005(Based on 11 full and 9 partial tracts) A) Conventional B) Refinancings C) Non-occupant Loans on Number Average Value Number Average Value Number Average Value
LOANS ORIGINATED 16 $461,917 15 $404,735 0 $0 APPLICATIONS APPROVED, NOT ACCEPTED 6 $337,333 6 $419,258 1 $318,260 APPLICATIONS DENIED 0 $0 0 $0 0 $0 APPLICATIONS WITHDRAWN 3 $555,333 2 $472,000 0 $0 FILES CLOSED FOR INCOMPLETENESS 2 $415,660 0 $0 0 $0
Aggregated Statistics For Year 2004(Based on 12 full and 10 partial tracts) A) Conventional B) Refinancings C) Non-occupant Loans on Number Average Value Number Average Value Number Average Value
LOANS ORIGINATED 30 $356,328 15 $381,499 3 $364,237 APPLICATIONS APPROVED, NOT ACCEPTED 17 $319,998 16 $324,404 2 $433,125 APPLICATIONS DENIED 3 $453,577 0 $0 1 $310,000 APPLICATIONS WITHDRAWN 5 $416,700 1 $370,330 1 $111,000 FILES CLOSED FOR INCOMPLETENESS 1 $182,330 0 $0 0 $0
Aggregated Statistics For Year 2003(Based on 14 full and 10 partial tracts) A) Conventional B) Refinancings C) Non-occupant Loans on Number Average Value Number Average Value Number Average Value
LOANS ORIGINATED 119 $310,010 90 $272,146 8 $245,389 APPLICATIONS APPROVED, NOT ACCEPTED 36 $302,499 57 $277,743 3 $279,117 APPLICATIONS DENIED 5 $264,142 1 $500,060 0 $0 APPLICATIONS WITHDRAWN 7 $306,589 10 $277,669 1 $366,770 FILES CLOSED FOR INCOMPLETENESS 1 $116,040 0 $0 0 $0
Aggregated Statistics For Year 2002(Based on 6 full and 1 partial tracts) A) Conventional B) Refinancings C) Non-occupant Loans on Number Average Value Number Average Value Number Average Value
LOANS ORIGINATED 74 $291,719 37 $280,134 1 $284,000 APPLICATIONS APPROVED, NOT ACCEPTED 32 $284,939 29 $257,358 1 $178,000 APPLICATIONS DENIED 1 $282,000 2 $271,110 0 $0 APPLICATIONS WITHDRAWN 1 $272,510 5 $269,184 0 $0 FILES CLOSED FOR INCOMPLETENESS 2 $255,000 0 $0 0 $0
Aggregated Statistics For Year 2001(Based on 6 full and 1 partial tracts) A) Conventional B) Refinancings C) Non-occupant Loans on Number Average Value Number Average Value Number Average Value
LOANS ORIGINATED 123 $277,847 72 $272,759 8 $229,981 APPLICATIONS APPROVED, NOT ACCEPTED 44 $276,647 32 $259,738 3 $197,093 APPLICATIONS DENIED 5 $267,388 6 $287,492 1 $309,000 APPLICATIONS WITHDRAWN 7 $290,980 4 $217,518 0 $0 FILES CLOSED FOR INCOMPLETENESS 3 $271,667 1 $202,540 0 $0
Aggregated Statistics For Year 2000(Based on 6 full and 1 partial tracts) A) Conventional B) Refinancings C) Non-occupant Loans on Number Average Value Number Average Value Number Average Value
LOANS ORIGINATED 186 $259,552 33 $242,334 3 $237,810 APPLICATIONS APPROVED, NOT ACCEPTED 43 $275,180 6 $242,167 1 $83,220 APPLICATIONS DENIED 14 $290,078 4 $234,382 0 $0 APPLICATIONS WITHDRAWN 9 $295,961 3 $234,323 2 $188,795 FILES CLOSED FOR INCOMPLETENESS 2 $186,050 1 $223,000 0 $0
Aggregated Statistics For Year 1999(Based on 7 full and 8 partial tracts) A) Conventional B) Refinancings C) Non-occupant Loans on Number Average Value Number Average Value Number Average Value
LOANS ORIGINATED 479 $224,271 184 $201,172 7 $147,006 APPLICATIONS APPROVED, NOT ACCEPTED 55 $222,684 87 $210,703 5 $128,962 APPLICATIONS DENIED 31 $218,607 23 $216,573 0 $0 APPLICATIONS WITHDRAWN 19 $246,583 7 $220,403 0 $0 FILES CLOSED FOR INCOMPLETENESS 6 $218,120 4 $187,525 0 $0
Fire-safe hotels and motels in Mission Viejo, California:
Ayres Suites Mission Viejo, 28941 Los Alisos Blvd, Mission Viejo, California 92692 Phone: (949) 455-2545, Fax: (949) 455-9885
Ayres Hotel & Spa Mission Viejo, 28951 Los Alisos Blvd, Mission Viejo, California 92692 Phone: (949) 305-7200, Fax: (949) 305-7205
Hampton Inn and Suites Mission Viejo, 28682 Marguerite Pkwy, Mission viejo, California 92692 Phone: (949) 429-5222
All 3 fire-safe hotels and motels in Mission Viejo, California
Most common first names in Mission Viejo, CA among deceased individuals Name Count Lived (average)
John 223 76.4 years Mary 218 79.8 years Robert 216 72.6 years William 168 76.9 years James 151 73.1 years Joseph 121 78.1 years Dorothy 119 83.0 years Helen 118 82.4 years Margaret 114 82.1 years Charles 100 78.1 years
Most common last names in Mission Viejo, CA among deceased individuals Last name Count Lived (average)
Smith 60 73.1 years Johnson 57 81.1 years Miller 49 81.0 years Anderson 31 80.8 years Jones 31 80.5 years Brown 30 79.0 years Davis 28 77.3 years White 26 77.8 years Wilson 25 75.6 years Martin 23 78.4 years
Mission Viejo compared to California state average:
Unemployed percentage significantly below state average. Black race population percentage significantly below state average. Hispanic race population percentage below state average. Median age significantly above state average. Renting percentage below state average. Percentage of population with a bachelor's degree or higher above state average. Mission Viejo, CA compared to other similar cities: Mission Viejo on our top lists :
#13 on the list of "Top 100 safest cities (lowest city-data.com crime index) (pop. 50,000+)"
#15 on the list of "Top 101 cities with the lowest city-data.com crime index (population 50,000+)"
#17 on the list of "Top 101 cities with largest percentage of females in industries: information (population 50,000+)"
#20 on the list of "Top 101 cities with the lowest number of rapes per 100,000 residents (population 50,000+)"
#23 on the list of "Top 101 cities with largest percentage of females in occupations: business and financial operations occupations (population 50,000+)"
#24 on the list of "Top 101 cities with largest percentage of males in occupations: architecture and engineering occupations (population 50,000+)"
#27 on the list of "Top 101 cities with the lowest number of auto thefts per 100,000 residents (population 50,000+)"
#28 on the list of "Top 101 cities with the smallest temperature differences during a year (population 50,000+)"
#29 on the list of "Top 101 cities with the lowest number of thefts per 100,000 residents (population 50,000+)"
#34 on the list of "Top 101 cities with the least people below the poverty level (population 50,000+)"
#37 on the list of "Top 101 cities with the lowest number of burglaries per 100,000 residents (population 50,000+)"
#37 on the list of "Top 100 high-educated but low-earning cities (pop. 50,000+)"
#39 on the list of "Top 101 cities with largest percentage of males in occupations: management occupations (population 50,000+)"
#39 on the list of "Top 101 cities with the lowest number of assaults per 100,000 residents (population 50,000+)"
#48 on the list of "Top 100 cities with highest median household income (pop. 50,000+)"
#50 on the list of "Top 101 cities with largest percentage of males in industries: management of companies and enterprises (population 50,000+)"
#52 on the list of "Top 101 cities with the lowest number of murders per 100,000 residents (population 50,000+)"
#59 on the list of "Top 101 cities with the most residents born in Iran (population 500+)"
#60 on the list of "Top 100 cities with oldest residents (pop. 50,000+)"
#61 on the list of "Top 100 cities with highest median house value (pop. 50,000+)"
#4 on the list of "Top 101 counties with the highest total withdrawal of fresh water for public supply"
#5 on the list of "Top 101 counties with the most Catholic adherents"
#6 on the list of "Top 101 counties with the highest ground withdrawal of fresh water for public supply"
#7 on the list of "Top 101 counties with the most Evangelical Protestant adherents"
#8 on the list of "Top 101 counties with the highest Particulate Matter (PM2.5 ) Annual air pollution readings in 2012 (µg/m3 )"
Top Patent Applicants
Patrick H. Hayes (108)
Yang Gao (67)
Alex Vayser (62)
Bruce Donoho (53)
Thomas F. Fangrow (52)
Ferenc Raksi (39)
Wayne A. Noda (39)
Edmund J. Roschak (39)
Blair Walker (38)
Richard L. Quick (35)
Total of 3192 patent applications in 2008-2024.
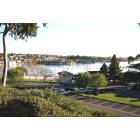
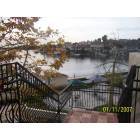
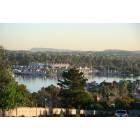
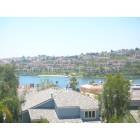
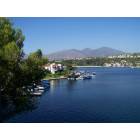
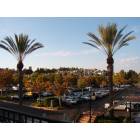
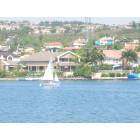
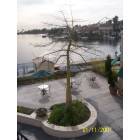
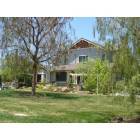
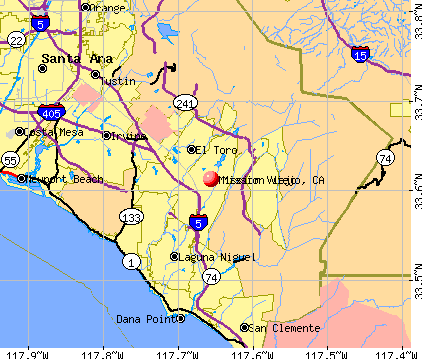


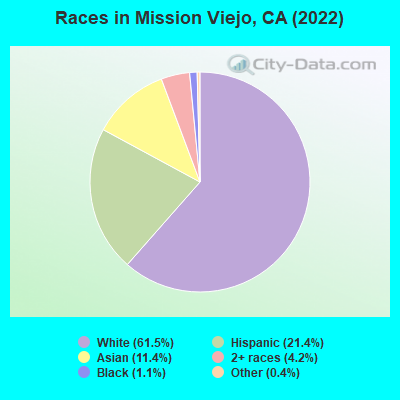
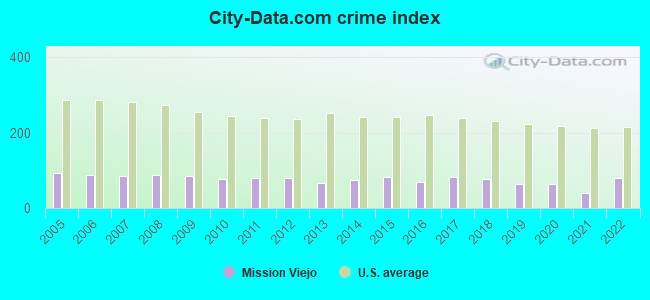
 Recent articles from our blog. Our writers, many of them Ph.D. graduates or candidates, create easy-to-read articles on a wide variety of topics.

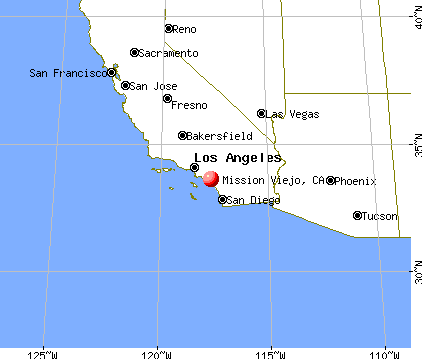
 , pop. 288,147).
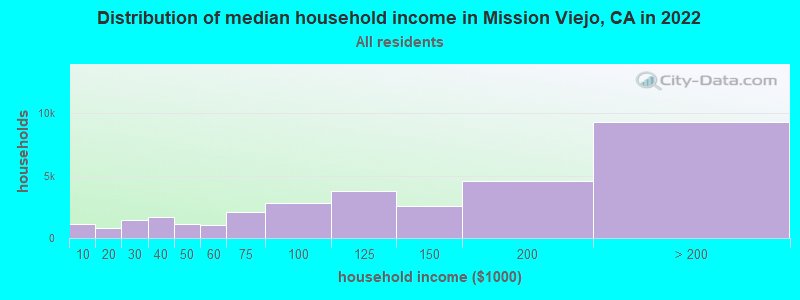
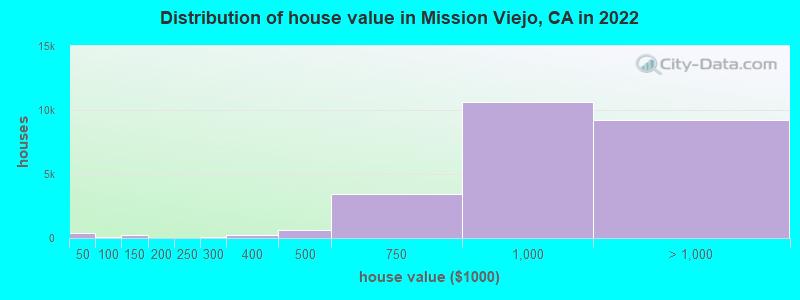
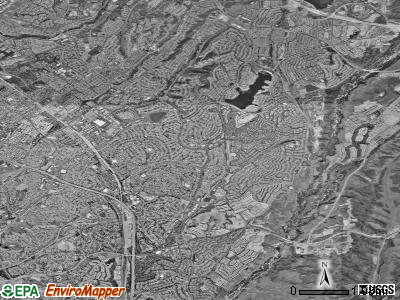
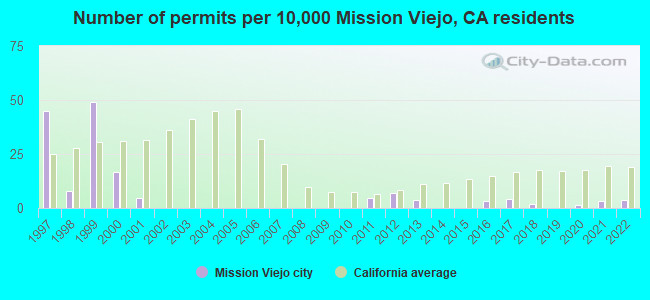
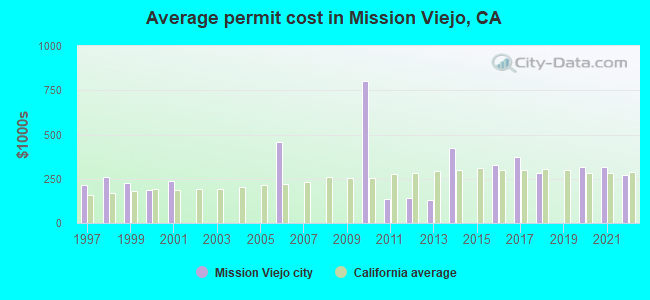
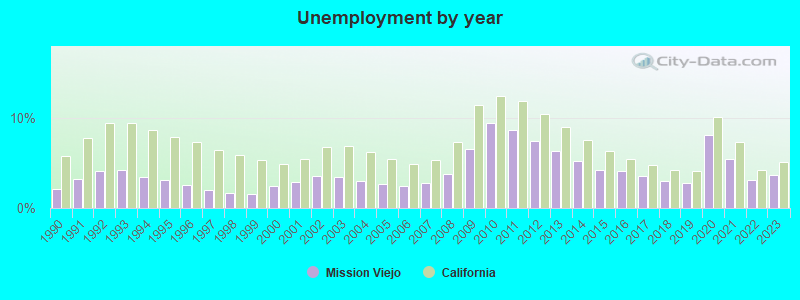
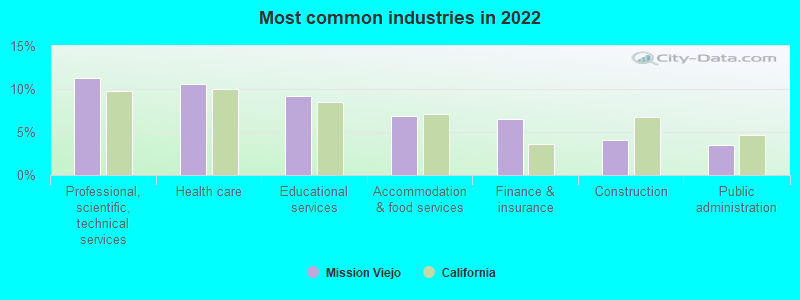
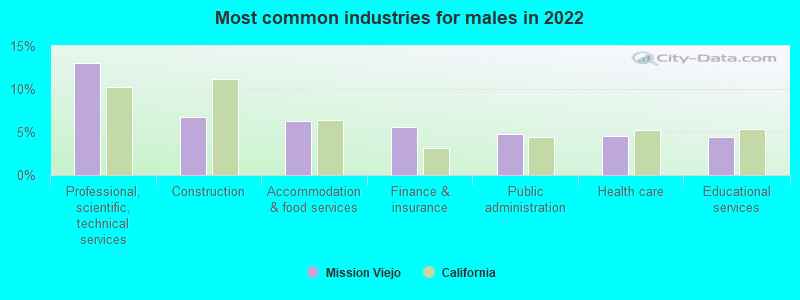
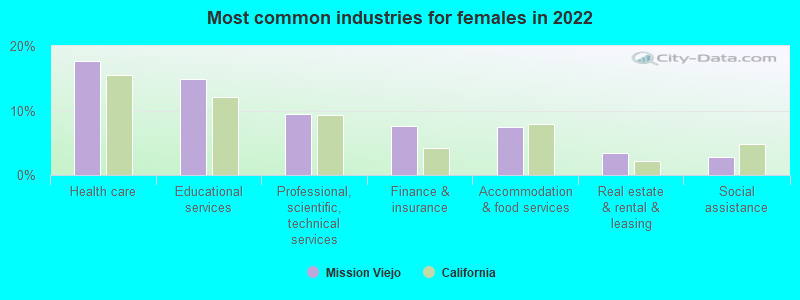
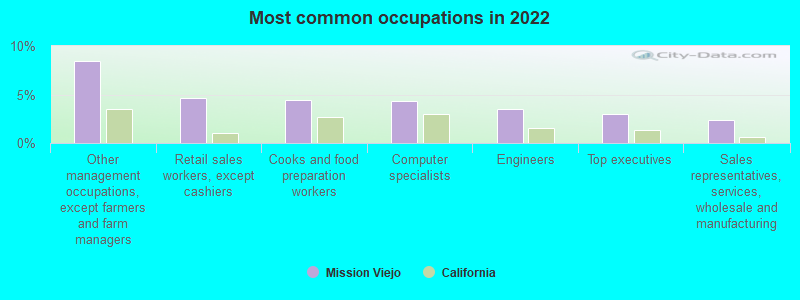
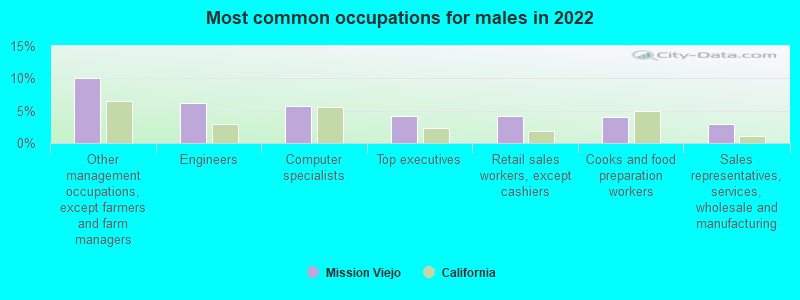
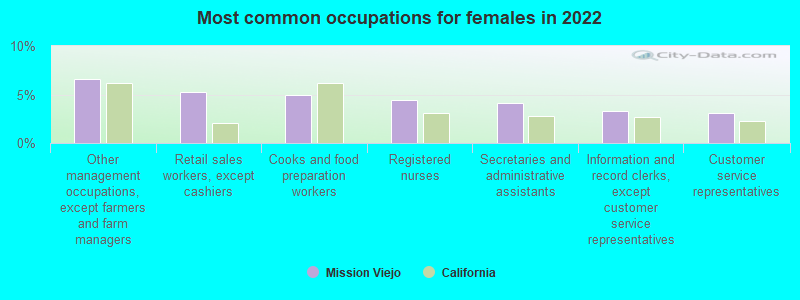
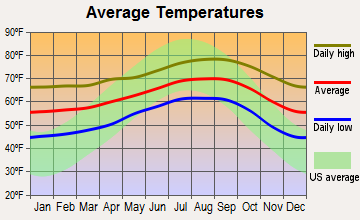
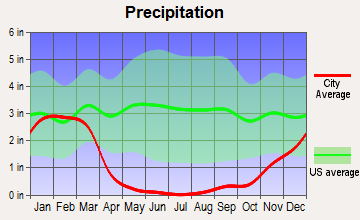
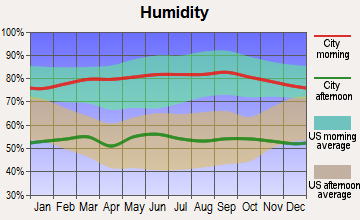
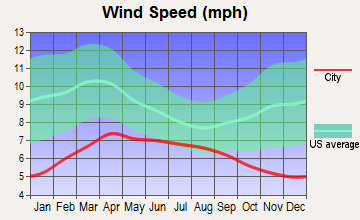
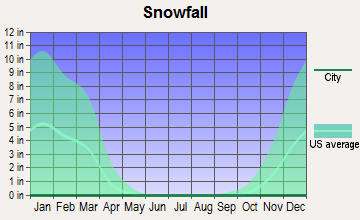
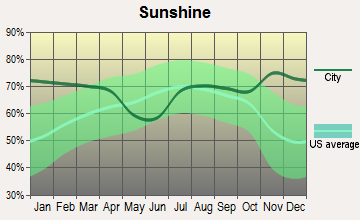
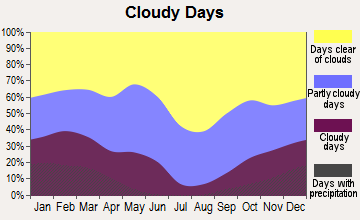
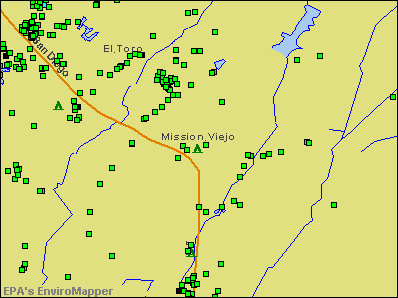

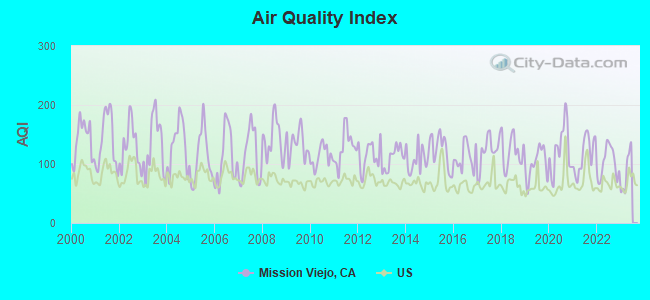
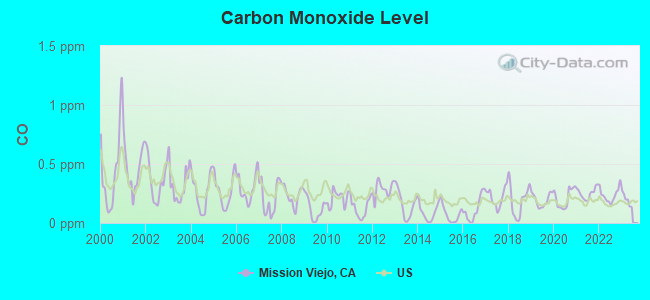
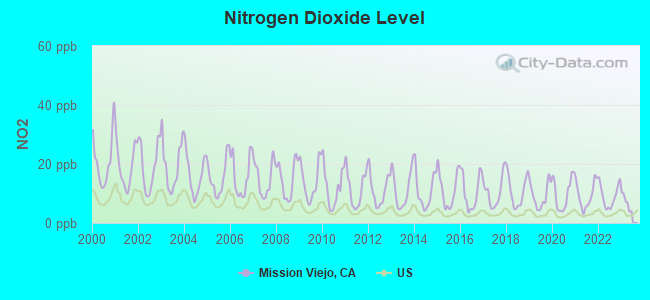
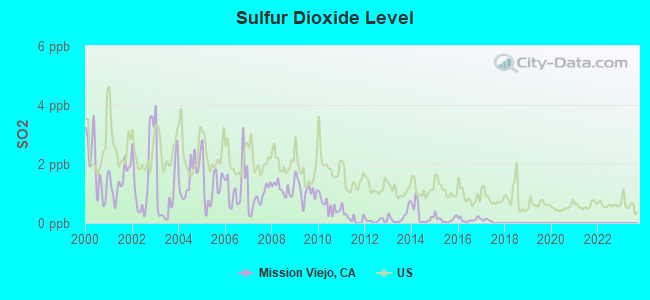
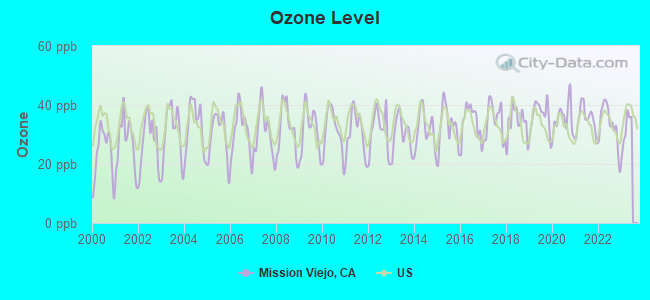
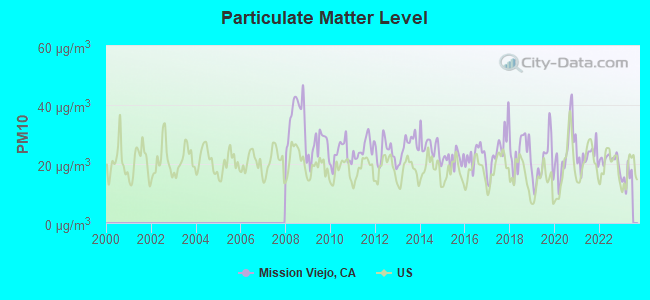
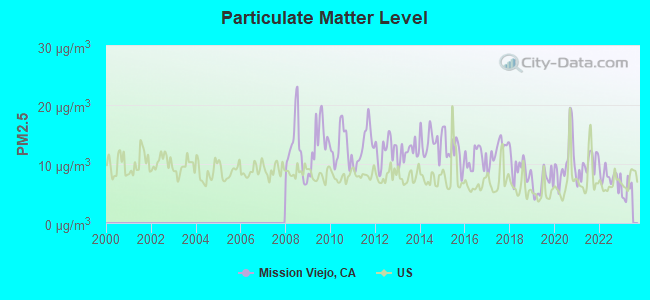
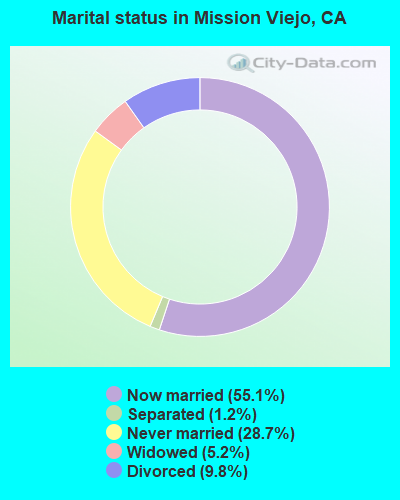
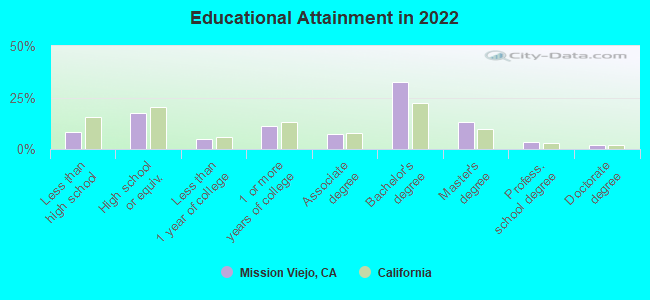
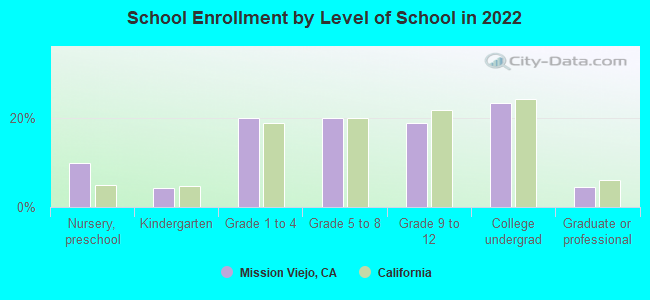
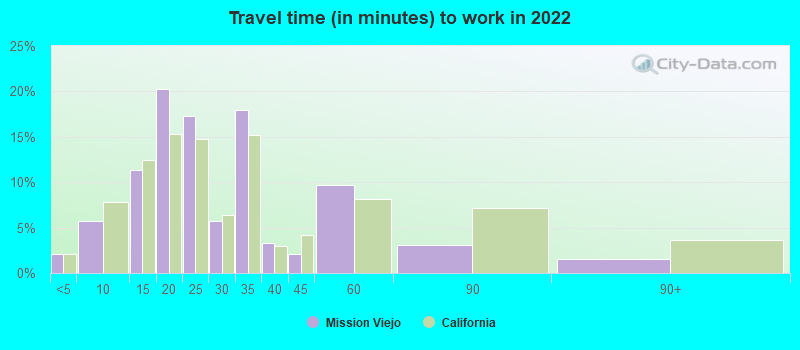
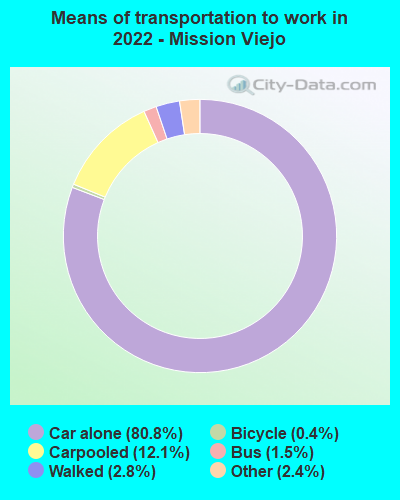


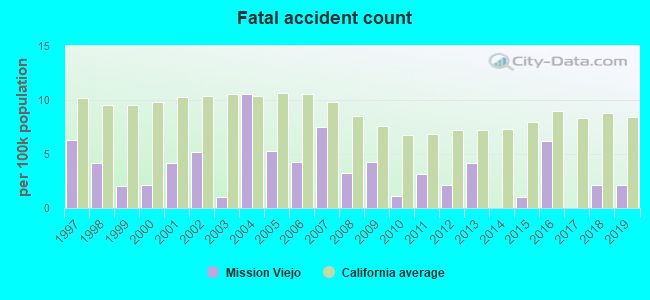
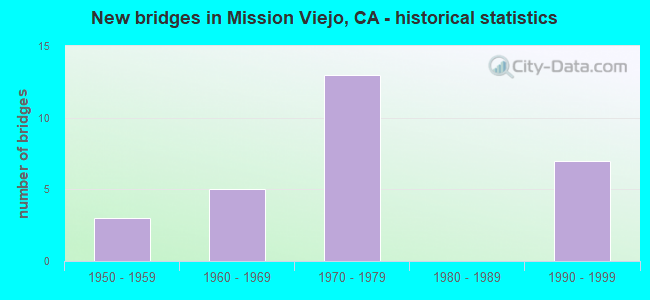
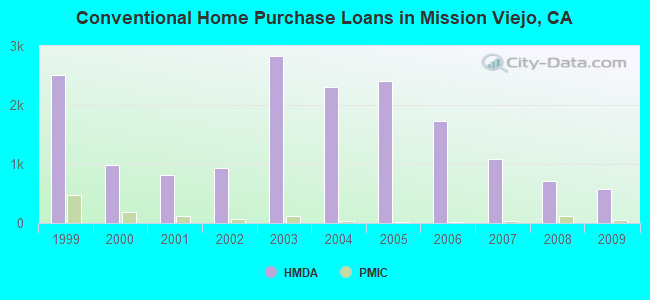
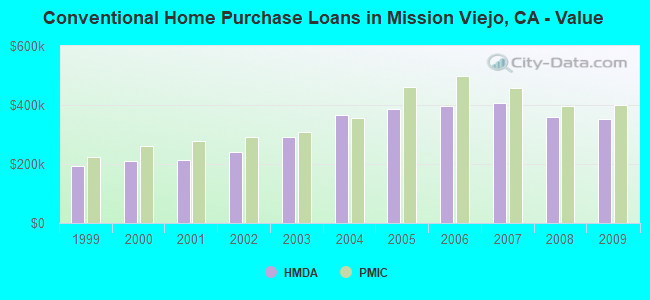
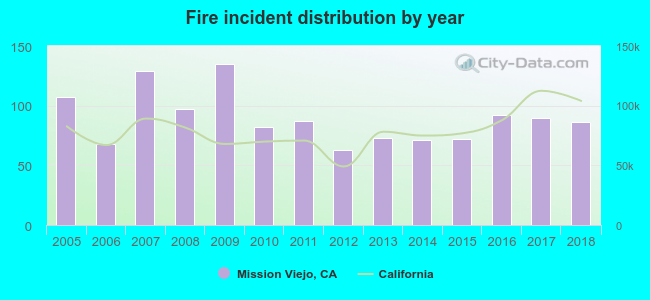 According to the data from the years 2005 - 2018 the average number of fire incidents per year is 89. The highest number of fire incidents - 135 took place in 2009, and the least - 63 in 2012. The data has a declining trend.
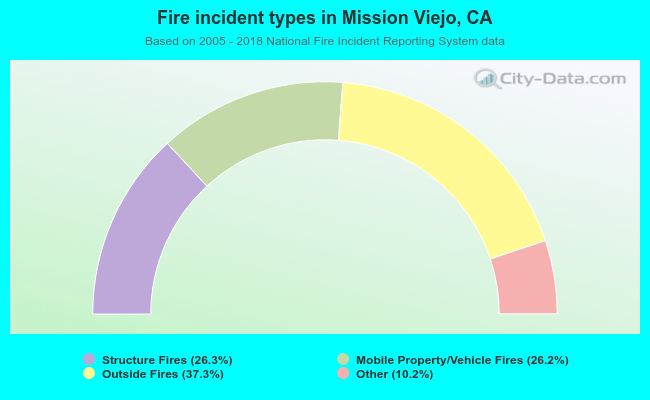 When looking into fire subcategories, the most incidents belonged to: Outside Fires (37.3%), and Structure Fires (26.3%).