Estimated zip code population in 2022: 47,673 Zip code population in 2010: 47,582 Zip code population in 2000: 46,370
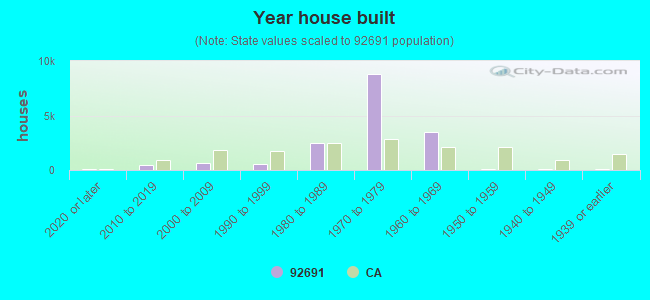
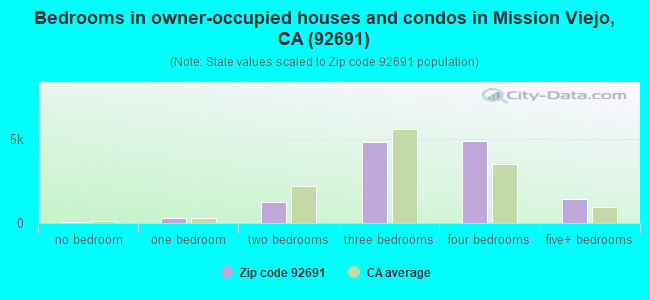
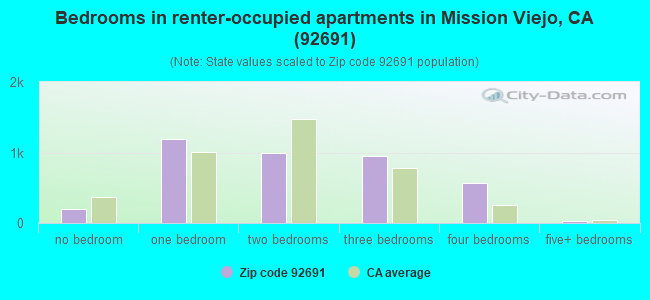
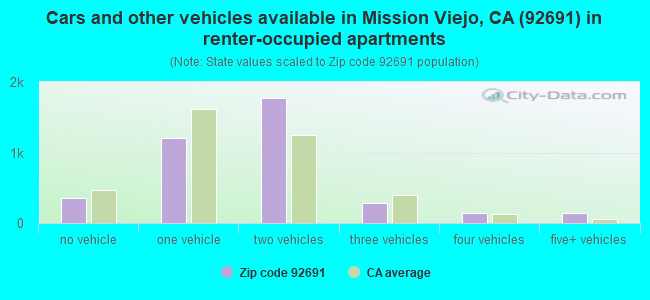
Houses and condos: 17,132 Renter-occupied apartments: 3,937
% of renters here:
24%
State:
44%
March 2022 cost of living index in zip code 92691: 87.0 (less than average, U.S. average is 100)
Land area: 8.8 sq. mi. Water area: 0.0 sq. mi.
Population density: 5,415 people per square mile
(average).
OSM Map
General Map
Google Map
MSN Map
OSM Map
General Map
Google Map
MSN Map
OSM Map
General Map
Google Map
MSN Map
OSM Map
General Map
Google Map
MSN Map
Please wait while loading the map...
Real estate property taxes paid for housing units in 2022:
This zip code:
0.5% ($4,895)
California:
0.7% ($4,831)
Median real estate property taxes paid for housing units with mortgages in 2022: $5,450 (0.6%) Median real estate property taxes paid for housing units with no mortgage in 2022: $3,644 (0.4%)
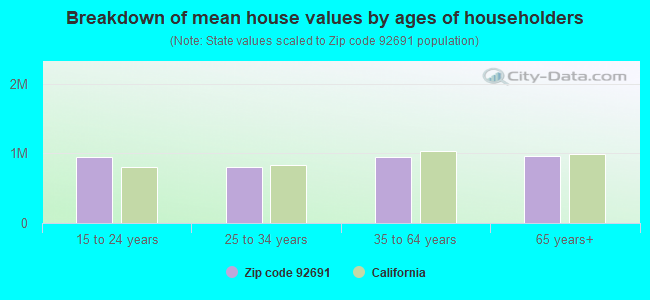
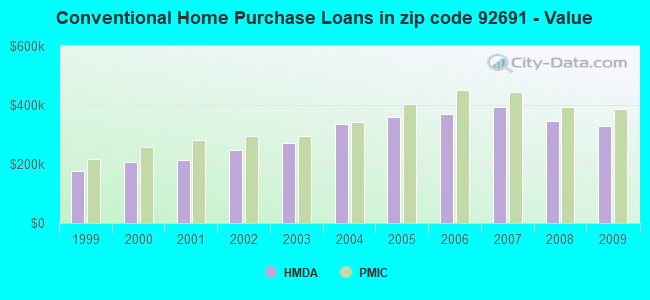
Estimated median house/condo value in 2022: $942,082
92691:
$942,082
California:
$715,900
According to our research of California and other state lists, there were 24 registered sex offenders living in 92691 zip code as of April 27, 2024. The ratio of all residents to sex offenders in zip code 92691 is 2,091 to 1. The ratio of registered sex offenders to all residents in this zip code is much lower than the state average.
Median resident age:
This zip code:
44.7 years
California median age:
37.9 years
Average household size:
This zip code:
2.8 people
California:
2.8 people
Averages for the 2020 tax year for zip code 92691, filed in 2021:
Average Adjusted Gross Income (AGI) in 2020: $94,630 (Individual Income Tax Returns)
Here:
$94,630
State:
$95,910
Salary/wage: $85,587 (reported on 79.1% of returns)
Here:
$85,587
State:
$77,331
(% of AGI for various income ranges: 1244.1% for AGIs below $25k, 3957.1% for AGIs $25k-50k, 7383.7% for AGIs $50k-75k, 10647.6% for AGIs $75k-100k, 21861.1% for AGIs $100k-200k, 75415.9% for AGIs over 200k)
Taxable interest for individuals: $1,202 (reported on 46.4% of returns)
This zip code:
$1,202
California:
$2,294
(% of AGI for various income ranges: 24.4% for AGIs below $25k, 47.8% for AGIs $25k-50k, 58.5% for AGIs $50k-75k, 102.8% for AGIs $75k-100k, 169.1% for AGIs $100k-200k, 518.7% for AGIs over 200k)
Ordinary dividends: $4,730 (reported on 27.1% of returns)
Here:
$4,730
State:
$10,949
(% of AGI for various income ranges: 47.5% for AGIs below $25k, 73.2% for AGIs $25k-50k, 142.8% for AGIs $50k-75k, 200.3% for AGIs $75k-100k, 340.0% for AGIs $100k-200k, 1549.8% for AGIs over 200k)
Net capital gain/loss in AGI: +$16,805 (reported on 26.4% of returns)
Here:
+$16,805
State:
+$49,306
(% of AGI for various income ranges: 17.6% for AGIs below $25k, 49.8% for AGIs $25k-50k, 135.5% for AGIs $50k-75k, 238.6% for AGIs $75k-100k, 566.9% for AGIs $100k-200k, 10092.9% for AGIs over 200k)
Profit/loss from business: +$13,596 (reported on 20.4% of returns)
Here:
+$13,596
State:
+$15,671
(% of AGI for various income ranges: 203.9% for AGIs below $25k, 297.0% for AGIs $25k-50k, 334.0% for AGIs $50k-75k, 455.6% for AGIs $75k-100k, 747.1% for AGIs $100k-200k, 2309.5% for AGIs over 200k)
Taxable individual retirement arrangement distribution: $22,574 (reported on 10.6% of returns)
92691:
$22,574
California:
$23,505
(% of AGI for various income ranges: 74.8% for AGIs below $25k, 163.8% for AGIs $25k-50k, 275.7% for AGIs $50k-75k, 539.8% for AGIs $75k-100k, 967.2% for AGIs $100k-200k, 1532.1% for AGIs over 200k)
Self-employed (Keogh) retirement plans: $25,967 (reported on 0.9% of returns)
92691:
$25,967
California:
$30,163
(% of AGI for various income ranges: 25.8% for AGIs $50k-75k, 50.1% for AGIs $100k-200k, 432.9% for AGIs over 200k)
Total itemized deductions: $33,287 (reported on 24.7% of returns)
Here:
$33,287
State:
$39,517
(% of AGI for various income ranges: 155.4% for AGIs below $25k, 398.5% for AGIs $25k-50k, 851.0% for AGIs $50k-75k, 1544.1% for AGIs $75k-100k, 3113.2% for AGIs $100k-200k, 7747.8% for AGIs over 200k)
Charity contributions: $6,005 (reported on 21.1% of returns)
Here:
$6,005
State:
$12,598
(% of AGI for various income ranges: 7.0% for AGIs below $25k, 34.7% for AGIs $25k-50k, 78.5% for AGIs $50k-75k, 160.1% for AGIs $75k-100k, 449.2% for AGIs $100k-200k, 1696.0% for AGIs over 200k)
Taxes paid: $8,737 (reported on 24.6% of returns)
92691:
$8,737
State:
$8,807
(% of AGI for various income ranges: 28.2% for AGIs below $25k, 78.1% for AGIs $25k-50k, 202.7% for AGIs $50k-75k, 428.0% for AGIs $75k-100k, 894.9% for AGIs $100k-200k, 1931.4% for AGIs over 200k)
Earned income credit: $1,533 (reported on 7.3% of returns)
Here:
$1,533
State:
$2,074
(% of AGI for various income ranges: 43.0% for AGIs below $25k, 37.7% for AGIs $25k-50k, 0.8% for AGIs $50k-75k)
Percentage of individuals using paid preparers for their 2020 taxes: 92.2%
Here:
92%
State:
92%
(% for various income ranges: 90.0% for AGIs below $25k, 92.3% for AGIs $25k-50k, 92.5% for AGIs $50k-75k, 92.6% for AGIs $75k-100k, 92.9% for AGIs $100k-200k, 95.1% for AGIs over 200k)
Averages for the 2012 tax year for zip code 92691, filed in 2013:
Average Adjusted Gross Income (AGI) in 2012: $75,019 (Individual Income Tax Returns)
Here:
$75,019
State:
$72,726
Salary/wage: $67,071 (reported on 82.2% of returns)
Here:
$67,071
State:
$59,079
(% of AGI for various income ranges: 72.0% for AGIs below $25k, 75.6% for AGIs $25k-50k, 74.2% for AGIs $50k-75k, 74.9% for AGIs $75k-100k, 79.3% for AGIs $100k-200k, 62.9% for AGIs over 200k)
Taxable interest for individuals: $1,069 (reported on 45.8% of returns)
This zip code:
$1,069
California:
$2,146
(% of AGI for various income ranges: 1.4% for AGIs below $25k, 0.9% for AGIs $25k-50k, 0.8% for AGIs $50k-75k, 0.6% for AGIs $75k-100k, 0.5% for AGIs $100k-200k, 0.6% for AGIs over 200k)
Ordinary dividends: $4,183 (reported on 24.6% of returns)
Here:
$4,183
State:
$9,308
(% of AGI for various income ranges: 1.9% for AGIs below $25k, 1.5% for AGIs $25k-50k, 1.1% for AGIs $50k-75k, 1.3% for AGIs $75k-100k, 0.9% for AGIs $100k-200k, 2.1% for AGIs over 200k)
Net capital gain/loss in AGI: +$8,471 (reported on 21.4% of returns)
Here:
+$8,471
State:
+$30,460
(% of AGI for various income ranges: 0.1% for AGIs $25k-50k, 0.3% for AGIs $50k-75k, 0.4% for AGIs $75k-100k, 0.7% for AGIs $100k-200k, 8.5% for AGIs over 200k)
Profit/loss from business: +$16,156 (reported on 20.7% of returns)
Here:
+$16,156
State:
+$17,064
(% of AGI for various income ranges: 12.6% for AGIs below $25k, 7.5% for AGIs $25k-50k, 5.3% for AGIs $50k-75k, 3.8% for AGIs $75k-100k, 3.3% for AGIs $100k-200k, 3.5% for AGIs over 200k)
Taxable individual retirement arrangement distribution: $18,531 (reported on 11.5% of returns)
92691:
$18,531
California:
$19,557
(% of AGI for various income ranges: 3.8% for AGIs below $25k, 3.4% for AGIs $25k-50k, 3.6% for AGIs $50k-75k, 3.2% for AGIs $75k-100k, 3.0% for AGIs $100k-200k, 1.7% for AGIs over 200k)
Self-employment retirement plans: $16,309 (reported on 0.9% of returns)
92691:
$16,309
California:
$24,530
(% of AGI for various income ranges: 0.1% for AGIs $25k-50k, 0.1% for AGIs $75k-100k, 0.2% for AGIs $100k-200k, 0.4% for AGIs over 200k)
Total itemized deductions: $29,236 (24% of AGI, reported on 48.8% of returns)
Here:
$29,236
State:
$34,004
Here:
24.4% of AGI
State:
22.7% of AGI
(% of AGI for various income ranges: 17.3% for AGIs below $25k, 17.3% for AGIs $25k-50k, 19.9% for AGIs $50k-75k, 20.5% for AGIs $75k-100k, 20.9% for AGIs $100k-200k, 15.9% for AGIs over 200k)
Charity contributions: $3,367 (reported on 42.5% of returns)
Here:
$3,367
State:
$4,659
(% of AGI for various income ranges: 1.0% for AGIs below $25k, 1.4% for AGIs $25k-50k, 1.7% for AGIs $50k-75k, 2.2% for AGIs $75k-100k, 2.2% for AGIs $100k-200k, 1.8% for AGIs over 200k)
Taxes paid: $10,433 (reported on 48.6% of returns)
92691:
$10,433
State:
$14,448
(% of AGI for various income ranges: 2.9% for AGIs below $25k, 3.5% for AGIs $25k-50k, 5.0% for AGIs $50k-75k, 5.9% for AGIs $75k-100k, 7.6% for AGIs $100k-200k, 8.7% for AGIs over 200k)
Earned income credit: $1,808 (reported on 9.3% of returns)
Here:
$1,808
State:
$2,286
(% of AGI for various income ranges: 3.3% for AGIs below $25k, 0.7% for AGIs $25k-50k)
Percentage of individuals using paid preparers for their 2012 taxes: 60.2%
Here:
60%
State:
64%
(% for various income ranges: 54.6% for AGIs below $25k, 60.8% for AGIs $25k-50k, 62.8% for AGIs $50k-75k, 63.5% for AGIs $75k-100k, 62.6% for AGIs $100k-200k, 69.7% for AGIs over 200k)
Averages for the 2004 tax year for zip code 92691, filed in 2005:
Average Adjusted Gross Income (AGI) in 2004: $62,467 (Individual Income Tax Returns)
Here:
$62,467
State:
$58,600
Salary/wage: $58,362 (reported on 84.3% of returns)
Here:
$58,362
State:
$49,455
(% of AGI for various income ranges: 183.8% for AGIs below $10k, 74.1% for AGIs $10k-25k, 78.4% for AGIs $25k-50k, 78.6% for AGIs $50k-75k, 82.4% for AGIs $75k-100k, 77.0% for AGIs over 100k)
Taxable interest for individuals: $1,423 (reported on 57.6% of returns)
This zip code:
$1,423
California:
$2,365
(% of AGI for various income ranges: 11.1% for AGIs below $10k, 2.5% for AGIs $10k-25k, 1.6% for AGIs $25k-50k, 1.1% for AGIs $50k-75k, 1.1% for AGIs $75k-100k, 1.2% for AGIs over 100k)
Taxable dividends: $2,335 (reported on 29.3% of returns)
Here:
$2,335
State:
$4,746
(% of AGI for various income ranges: 7.9% for AGIs below $10k, 1.8% for AGIs $10k-25k, 1.1% for AGIs $25k-50k, 0.9% for AGIs $50k-75k, 0.8% for AGIs $75k-100k, 1.1% for AGIs over 100k)
Net capital gain/loss: +$6,474 (reported on 25.3% of returns)
Here:
+$6,474
State:
+$23,418
(% of AGI for various income ranges: -6.0% for AGIs below $10k, -0.0% for AGIs $10k-25k, 0.3% for AGIs $25k-50k, 0.5% for AGIs $50k-75k, 0.5% for AGIs $75k-100k, 4.8% for AGIs over 100k)
Profit/loss from business: +$15,454 (reported on 21.2% of returns)
Here:
+$15,454
State:
+$16,826
(% of AGI for various income ranges: 12.9% for AGIs below $10k, 10.8% for AGIs $10k-25k, 7.8% for AGIs $25k-50k, 5.9% for AGIs $50k-75k, 4.4% for AGIs $75k-100k, 4.2% for AGIs over 100k)
IRA payment deduction: $3,322 (reported on 3.8% of returns)
92691:
$3,322
California:
$3,192
(% of AGI for various income ranges: 0.5% for AGIs below $10k, 0.3% for AGIs $10k-25k, 0.4% for AGIs $25k-50k, 0.3% for AGIs $50k-75k, 0.2% for AGIs $75k-100k, 0.1% for AGIs over 100k)
Self-employed pension: $13,726 (reported on 1.8% of returns)
Here:
$13,726
California:
$17,688
(% of AGI for various income ranges: 0.2% for AGIs $10k-25k, 0.2% for AGIs $25k-50k, 0.2% for AGIs $50k-75k, 0.3% for AGIs $75k-100k, 0.5% for AGIs over 100k)
Total itemized deductions: $27,027 (29% of AGI, reported on 54.9% of returns)
Here:
$27,027
State:
$28,113
Here:
28.8% of AGI
State:
25.3% of AGI
(% of AGI for various income ranges: 61.5% for AGIs below $10k, 21.6% for AGIs $10k-25k, 28.0% for AGIs $25k-50k, 26.1% for AGIs $50k-75k, 25.7% for AGIs $75k-100k, 21.2% for AGIs over 100k)
Charity contributions deductions: $3,389 (3% of AGI, reported on 49.9% of returns)
Here:
$3,389
State:
$3,923
Here:
3.5% of AGI
State:
3.3% of AGI
(% of AGI for various income ranges: 2.2% for AGIs below $10k, 1.4% for AGIs $10k-25k, 2.2% for AGIs $25k-50k, 2.7% for AGIs $50k-75k, 2.9% for AGIs $75k-100k, 2.9% for AGIs over 100k)
Total tax: $9,135 (reported on 82.4% of returns)
92691:
$9,135
State:
$10,761
(% of AGI for various income ranges: 8.3% for AGIs below $10k, 5.4% for AGIs $10k-25k, 7.5% for AGIs $25k-50k, 8.6% for AGIs $50k-75k, 9.4% for AGIs $75k-100k, 15.6% for AGIs over 100k)
Earned income credit: $1,398 (reported on 6.8% of returns)
Here:
$1,398
State:
$1,763
Percentage of individuals using paid preparers for their 2004 taxes: 61.4%
Here:
61%
State:
66%
(% for various income ranges: 49.0% for AGIs below $10k, 58.7% for AGIs $10k-25k, 61.4% for AGIs $25k-50k, 67.4% for AGIs $50k-75k, 64.4% for AGIs $75k-100k, 67.3% for AGIs over 100k)
Likely homosexual households (counted as self-reported same-sex unmarried-partner households)
Lesbian couples: 0.0% of all households
Gay men: 0.0% of all households
Household received Food Stamps/SNAP in the past 12 months: 851 Household did not receive Food Stamps/SNAP in the past 12 months: 15,461
Women who had a birth in the past 12 months: 502 (457 now married, 43 unmarried) Women who did not have a birth in the past 12 months: 9,022 (4,623 now married, 4,354 unmarried)
Housing units in zip code 92691 with a mortgage: 9,612 (1,263 second mortgage, 28 home equity loan, 1,149 both second mortgage and home equity loan) Houses without a mortgage: 371
Median monthly owner costs for units with a mortgage: $2,942 Median monthly owner costs for units without a mortgage: $691
Residents with income below the poverty level in 2022:
This zip code:
5.3%
Whole state:
12.2%
Residents with income below 50% of the poverty level in 2022:
This zip code:
2.0%
Whole state:
6.2%
Median number of rooms in houses and condos:
Here:
6.6
State:
6.0
Median number of rooms in apartments:
Here:
4.2
State:
3.9
Notable locations in this zip code not listed on our city pages
Notable locations in zip code 92691: Mission Viejo Golf Club (A), Mission Viejo Branch Orange County Public Library (B), Medix Ambulance Service (C), Orange County Fire Authority Station 9 (D). Display/hide their locations on the map
Parks in zip code 92691 include: Barcelona Park (1), Crucero Park (2), Minaya Park (3), Seville Park (4), Vista del Lago Park (5), Wilderness Glen Park (6), Aegean Hills Park (7), Alicia Park (8), Aurora Park (9). Display/hide their locations on the map
7,481 married couples with children.
968 single-parent households (333 men, 635 women).
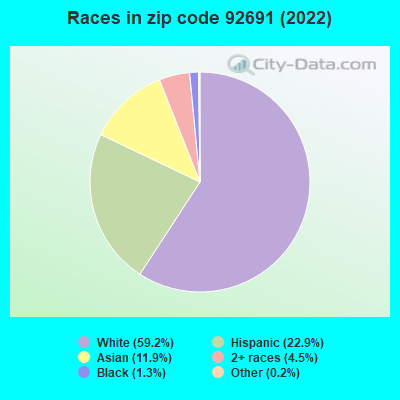
70.4% of residents of 92691 zip code speak English at home.
13.9% of residents speak Spanish at home (64% very well, 20% well, 14% not well, 2% not at all).
7.0% of residents speak other Indo-European language at home (72% very well, 22% well, 6% not well).
8.2% of residents speak Asian or Pacific Island language at home (63% very well, 22% well, 13% not well, 1% not at all).
0.7% of residents speak other language at home (85% very well, 10% well, 4% not well).
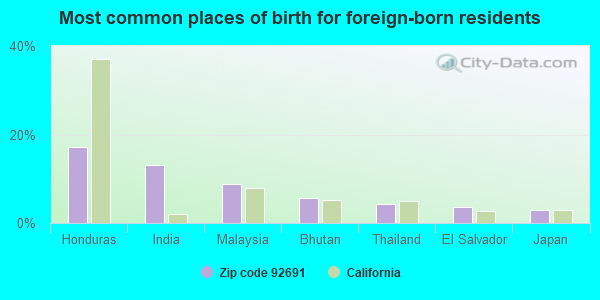
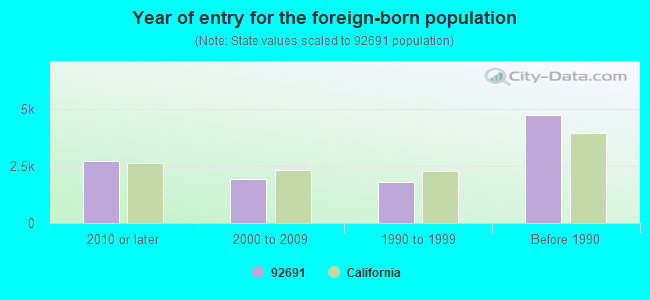
Foreign born population: 10,322 (21.7%) (70.3% of them are naturalized citizens)
Major facilities with environmental interests located in this zip code:
ECONO LUBE N TUNE (25902 EL PASEO in MISSION VIEJO, CA)
STATE MASTER (California - Hazardous Waste Tracking) - HAZARDOU WASTE PROGRAM Small Quantity Generators, between 100 kg and 1000 kg of hazardous waste/month (Resource Conservation and Recovery Act (tracking hazardous waste)) - notification STATE MASTER (California - Used Oil Recycling System ) - USED OIL RECYCLING STATE MASTER (California - Used Oil Recycling System ) - USED OIL RECYCLING, USED OIL PROGRAM Organizations: RONALD NASH (CONTACT/OWNER)
Alternative names: ECONO LUBE N TUNE #214
CHEVRON STATION 90297 (27742 CROWN VALLEY PKWY in MISSION VIEJO, CA)
STATE MASTER (California - Hazardous Waste Tracking) - HAZARDOU WASTE PROGRAM Small Quantity Generators, between 100 kg and 1000 kg of hazardous waste/month (Resource Conservation and Recovery Act (tracking hazardous waste)) - notification STATE MASTER (California - Used Oil Recycling System ) - USED OIL RECYCLING Organizations: CHEVRON PRODUCTS CO (CONTACT/OWNER)
Alternative names: MISSION VIEJO CHEVRON
CHEVRON STATION NO 202017 (27650 SANTA MARGARITA PARKWAY in MISSION VIEJO, CA)
STATE MASTER (California - Hazardous Waste Tracking) - HAZARDOU WASTE PROGRAM Large Quantity Generators, more that 1000 kg of hazardous waste/month (Resource Conservation and Recovery Act (tracking hazardous waste)) Organizations: CHEVRON PRODUCTS CO. (CONTACT/OPERATOR)
MISSION VIEJO COUNTRY CLUB (26332 OSO PKY in MISSION VIEJO, CA)
STATE MASTER (California - Hazardous Waste Tracking) - HAZARDOU WASTE PROGRAM Small Quantity Generators, between 100 kg and 1000 kg of hazardous waste/month (Resource Conservation and Recovery Act (tracking hazardous waste)) - notification
ALICIA FOREIGN CAR SERVICE INC (24002 VIA FABRICANTE NO 505 in MISSION VIEJO, CA)
STATE MASTER (California - Hazardous Waste Tracking) - HAZARDOU WASTE PROGRAM Small Quantity Generators, between 100 kg and 1000 kg of hazardous waste/month (Resource Conservation and Recovery Act (tracking hazardous waste)) - notification Business NAICS classification: GENERAL AUTOMOTIVE REPAIR. Organizations: ALICIA FOREIGN CAR SVC (CONTACT/OWNER)
Alternative names: ALICIA AUTO SERVICE INC DBA SHELBI'S AUTO BODY
ELITE MOTORS INC (23725 VIA FABRICANTE STE F in MISSION VIEJO, CA)
STATE MASTER (California - Hazardous Waste Tracking) - HAZARDOU WASTE PROGRAM Small Quantity Generators, between 100 kg and 1000 kg of hazardous waste/month (Resource Conservation and Recovery Act (tracking hazardous waste)) - notification
ACADEMY AUTOMOTIVE INC (23854 VIA FABRICANTE UNIT G1 in MISSION VIEJO, CA)
STATE MASTER (California - Hazardous Waste Tracking) - HAZARDOU WASTE PROGRAM Small Quantity Generators, between 100 kg and 1000 kg of hazardous waste/month (Resource Conservation and Recovery Act (tracking hazardous waste)) - notification Organizations: FABRICANTE ASSOCIATES LTD (CONTACT/OWNER)
FOTO GRAFIX (27760 SANTA MARGARITA PARK WY in MISSION VIEJO, CA)
STATE MASTER (California - Hazardous Waste Tracking) - HAZARDOU WASTE PROGRAM Small Quantity Generators, between 100 kg and 1000 kg of hazardous waste/month (Resource Conservation and Recovery Act (tracking hazardous waste))
LA TIERRA ELEMENTARY (24150 LINDLEY ST. in MISSION VIEJO, CA)
(National Center for Education Statistics) - STATE ID-6098545 Organizations: SADDLEBACK VALLEY UNIFIED (SCHOOL DISTRICT)
LINDA VISTA ELEMENTARY (25222 PERICIA DR. in MISSION VIEJO, CA)
(National Center for Education Statistics) - STATE ID-6030159 Organizations: SADDLEBACK VALLEY UNIFIED (SCHOOL DISTRICT)
CASTILLE ELEMENTARY (24042 VIA LA CORUNA in MISSION VIEJO, CA)
(National Center for Education Statistics) - STATE ID-6089452 Organizations: CAPISTRANO UNIFIED (SCHOOL DISTRICT)
LOS ALISOS INTERMEDIATE (25171 MOOR AVE. in MISSION VIEJO, CA)
(National Center for Education Statistics) - STATE ID-6071161 Organizations: SADDLEBACK VALLEY UNIFIED (SCHOOL DISTRICT)
BARCELONA HILLS ELEMENTARY (23000 VIA SANTA MARIA in MISSION VIEJO, CA)
(National Center for Education Statistics) - STATE ID-6096093 Organizations: CAPISTRANO UNIFIED (SCHOOL DISTRICT)
Housing units lacking complete plumbing facilities: 0.2% Housing units lacking complete kitchen facilities: 1.6%
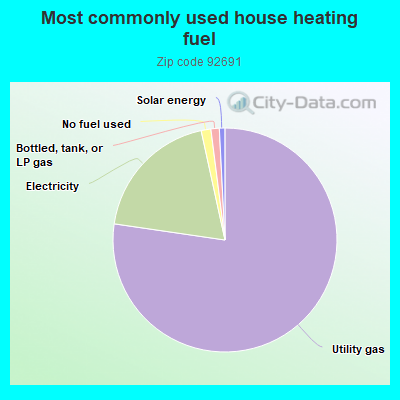
77.0%Utility gas
19.2%Electricity
1.4%No fuel used
1.2%Bottled, tank, or LP gas
0.8%Solar energy
Population in 1990: 48,832.
Place of birth for U.S.-born residents:
This state: 27,062
Northeast: 2,601
Midwest: 3,793
South: 1,686
West: 1,242
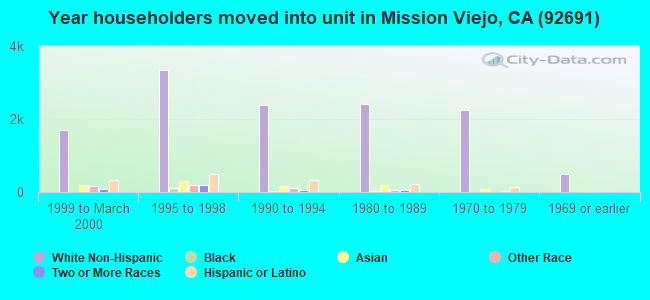
58% of the 92691 zip code residents lived in the same house 5 years ago. Out of people who lived in different houses, 71% lived in this county. Out of people who lived in different counties, 50% lived in California.
92% of the 92691 zip code residents lived in the same house 1 year ago. Out of people who lived in different houses, 66% moved from this county. Out of people who lived in different houses, 16% moved from different county within same state. Out of people who lived in different houses, 11% moved from different state. Out of people who lived in different houses, 8% moved from abroad.
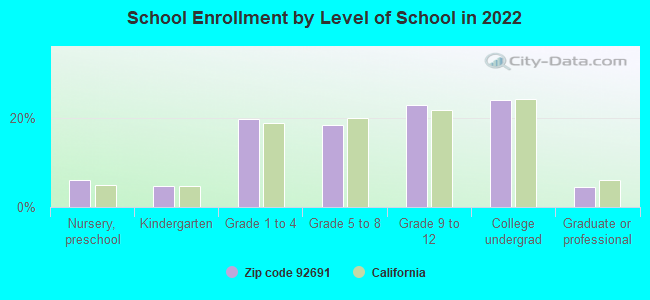
Private vs. public school enrollment:
Students in private schools in grades 1 to 8 (elementary and middle school): 448
Here:
11.5%
California:
10.5%
Students in private schools in grades 9 to 12 (high school): 318
Here:
13.6%
California:
8.5%
Students in private undergraduate colleges: 428
Here:
17.6%
California:
15.9%
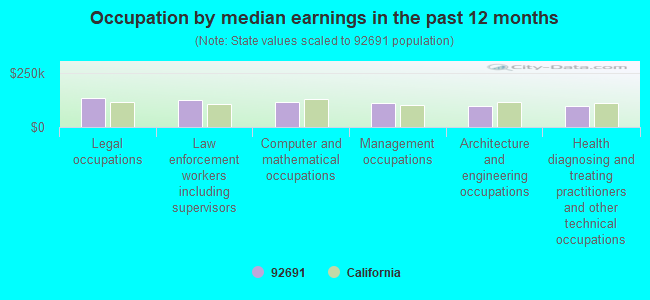
Occupation by median earnings in the past 12 months ($)
136,102Legal occupations
125,992Law enforcement workers including supervisors
113,926Computer and mathematical occupations
110,338Management occupations
96,590Architecture and engineering occupations
95,808Health diagnosing and treating practitioners and other technical occupations
Companies with biggest federal contracts located in this zip code:
STRAUB PACIFIC LLC (26054 ACERO in MISSION VIEJO, CA; small business) : $99,734,072 in 239 contractsfrom 2000 to 2006
Contracts for Construction of Structures and Facilities -- Other Administrative Facilities and Service Buildings, Construction of Structures and Facilities -- Family Housing Facilities, Maintenance, Repair or Alteration of Real Property -- Miscellaneous Buildings, Construction of Structures and Facilities -- Air Traffic Control Training Facilities, and moreby Army, U.S. Army Corps of Engineers - civil program financing only Signed by year:2000: $24,862,475; 2001: $16,351,654; 2002: $16,824,712; 2003: $2,107,419; 2004: $3,271,651; 2005: $25,397,605; 2006: $10,918,556.
Biggest contracts:
$16,131,000 with Army for Construction of Structures and Facilities -- Other Administrative Facilities and Service Buildings. Signed on 2000-09-20. Completion date: 2001-12-14.
$13,334,265 with Army for Construction of Structures and Facilities -- Family Housing Facilities. Taking place in AZ. Signed on 2005-06-29. Completion date: 2006-10-13.
$12,599,000 with Army for Maintenance, Repair or Alteration of Real Property -- Miscellaneous Buildings. Taking place in NV. Signed on 2001-09-26. Completion date: 2001-09-26.
$11,925,000 with Army for Construction of Structures and Facilities -- Air Traffic Control Training Facilities. Signed on 2002-09-17. Completion date: 2003-12-31.
REGAL TECHNOLOGY PARTNERS, INC (23362 MADERO STE F in MISSION VIEJO, CA; small business) : $1,658,119 in 30 contractsfrom 2000 to 2006
Contracts for Maintenance, Repair and Rebuilding of Equipment -- Miscellaneous, Electrical and Electronic assemblies, Boards, Cards, and Associated Hardware, ADP Input/Output and Storage Devices, Batteries, Rechargeable by Air Force Signed by year:2000: $136,200; 2001: $233,035; 2002: $134,785; 2003: $248,480; 2004: $354,599; 2005: $122,387; 2006: $428,633.
Biggest contracts:
$220,512 with Air Force for Maintenance, Repair and Rebuilding of Equipment -- Miscellaneous. Signed on 2006-05-31. Completion date: 2006-07-31.
$218,294 with Air Force for Electrical and Electronic assemblies, Boards, Cards, and Associated Hardware. Signed on 2003-07-28. Completion date: 2003-11-30.
$155,313, same as above.Signed on 2006-01-05. Completion date: 2006-03-06.
$113,003, same as above.Signed on 2004-06-25. Completion date: 2004-11-30.
FOUNDSTONE, INC (27201 PUERTA REAL in MISSION VIEJO, CA; small business) : $654,757 in 9 contractsfrom 2001 to 2004
Contracts for Expert Witness, ADP Software, Equipment, and Telecommunications Training, ADP Software by Offices, Boards and Divisions (includes Attorney General, Deputy Attorney General, etc.), U.S. Secret Service (disused code: now 7009), EXECUTIVE OFFICE OF THE PRESIDENT, Army, and others Signed by year:2000: $0; 2001: $416,000; 2002: $200,134; 2003: $11,156; 2004: $27,467; 2005: $0; 2006: $0.
Biggest contracts:
$416,000 with Offices, Boards and Divisions (includes Attorney General, Deputy Attorney General, etc.) for Expert Witness. Taking place in NJ. Signed on 2001-10-15. Completion date: 2002-02-15.
$100,000 with U.S. Secret Service (disused code: now 7009) for ADP Software, Equipment, and Telecommunications Training. Taking place in DC. Signed on 2002-08-15. Completion date: 2002-08-15.
$50,000, same as above.Signed on 2002-09-15. Completion date: 2002-10-15.
$50,000, same as above.Signed on 2002-09-15. Completion date: 2002-10-15.
K. Jones (27201 Puerta Real in Mission Viejo, CA; small business) : $62,285 in 3 contractsfrom 2003 to 2005
$44,000 with Offices, Boards and Divisions (includes Attorney General, Deputy Attorney General, etc.) for Expert Witness. Signed on 2003-10-01. Completion date: 2004-09-30.
$44,000 with Offices, Boards and Divisions (includes Attorney General, Deputy Attorney General, etc.) for Expert Witness. Taking place in NJ. Signed on 2003-06-15. Completion date: 2004-06-15.
-$25,715 with Offices, Boards and Divisions (includes Attorney General, Deputy Attorney General, etc.) for Expert Witness. Signed on 2005-02-01. Completion date: 2005-02-01.
SHERRY A CARAVEO, RDHBS (27471 CABEZA in MISSION VIEJO, CA; small business)
$59,800 with Navy for Dentistry Services. Signed on 2000-10-01. Completion date: 2001-09-30.
TRIAD MARKETING AND ASSO (23971 LA CHIQUITA DR in MISSION VIEJO, CA; small business) : $58,282 in 2 contractsfrom 1999 to 2000
$30,578 with Department of Defense for Food Items For Resale. Signed on 2000-04-30. Completion date: 2000-04-30.
$27,704, same as above.Signed on 1999-12-31. Completion date: 2000-01-31.
PHI APPLIED PHYSICAL SCIENCES (21911 BACALAR in MISSION VIEJO, CA; small business)
$37,730 with Army for Other Defense -- Applied Research and Exploratory Development (R&D). Signed on 2005-05-12. Completion date: 2005-11-16.
VASCULAR RESOURCE INC (22972 ARIJA CT in MISSION VIEJO, CA) : $6,605 in 2 contractsin 2004
$6,580 with Navy for Medical and Surgical Instruments, Equipment, and Supplies. Signed on 2004-04-21. Completion date: 2004-04-29.
$25, same as above.Signed on 2004-06-16. Completion date: 2004-04-29.
TRI-TEMP REFRIGERATION (22701 VIA TERCERO in MISSION VIEJO, CA; small business)
$6,240 with Navy for Maintenance, Repair and Rebuilding of Equipment -- Refrigeration, Air Conditioning, and Air Circulating Equipment. Signed on 2003-12-11. Completion date: 2004-09-30.
INTERNATIONAL COMPUTER PRODUCT (23332 MADERO STE H in MISSION VIEJO, CA; small business)
$5,885 with Air Force for ADP Input/Output and Storage Devices. Signed on 2005-03-08. Completion date: 2005-03-25.
Top industries in this zip code by the number of employees in 2005:
Health Care and Social Assistance: General Medical and Surgical Hospitals (over 1000 employees: 1 establishment)
Health Care and Social Assistance: Offices of Physicians (except Mental Health Specialists) (100-249: 1, 50-99: 2, 20-49: 9, 10-19: 16, 5-9: 33, 1-4: 62)


 Nearest zip codes: 92692, 92653, 92630, 92688, 92679, 92637.