Laguna Hills, California Submit your own pictures of this city and show them to the world
OSM Map
General Map
Google Map
MSN Map
OSM Map
General Map
Google Map
MSN Map
OSM Map
General Map
Google Map
MSN Map
OSM Map
General Map
Google Map
MSN Map
Please wait while loading the map...
Population in 2022: 30,568 (100% urban, 0% rural). Population change since 2000: -2.0%Males: 14,862 Females: 15,706
March 2022 cost of living index in Laguna Hills: 88.2 (less than average, U.S. average is 100) Percentage of residents living in poverty in 2022: 8.3%for White Non-Hispanic residents , 9.2% for Hispanic or Latino residents , 16.7% for American Indian residents , 11.9% for other race residents , 9.3% for two or more races residents )
Profiles of local businesses
Business Search - 14 Million verified businesses
Data:
Median household income ($)
Median household income (% change since 2000)
Household income diversity
Ratio of average income to average house value (%)
Ratio of average income to average rent
Median household income ($) - White
Median household income ($) - Black or African American
Median household income ($) - Asian
Median household income ($) - Hispanic or Latino
Median household income ($) - American Indian and Alaska Native
Median household income ($) - Multirace
Median household income ($) - Other Race
Median household income for houses/condos with a mortgage ($)
Median household income for apartments without a mortgage ($)
Races - White alone (%)
Races - White alone (% change since 2000)
Races - Black alone (%)
Races - Black alone (% change since 2000)
Races - American Indian alone (%)
Races - American Indian alone (% change since 2000)
Races - Asian alone (%)
Races - Asian alone (% change since 2000)
Races - Hispanic (%)
Races - Hispanic (% change since 2000)
Races - Native Hawaiian and Other Pacific Islander alone (%)
Races - Native Hawaiian and Other Pacific Islander alone (% change since 2000)
Races - Two or more races (%)
Races - Two or more races (% change since 2000)
Races - Other race alone (%)
Races - Other race alone (% change since 2000)
Racial diversity
Unemployment (%)
Unemployment (% change since 2000)
Unemployment (%) - White
Unemployment (%) - Black or African American
Unemployment (%) - Asian
Unemployment (%) - Hispanic or Latino
Unemployment (%) - American Indian and Alaska Native
Unemployment (%) - Multirace
Unemployment (%) - Other Race
Population density (people per square mile)
Population - Males (%)
Population - Females (%)
Population - Males (%) - White
Population - Males (%) - Black or African American
Population - Males (%) - Asian
Population - Males (%) - Hispanic or Latino
Population - Males (%) - American Indian and Alaska Native
Population - Males (%) - Multirace
Population - Males (%) - Other Race
Population - Females (%) - White
Population - Females (%) - Black or African American
Population - Females (%) - Asian
Population - Females (%) - Hispanic or Latino
Population - Females (%) - American Indian and Alaska Native
Population - Females (%) - Multirace
Population - Females (%) - Other Race
Coronavirus confirmed cases (Apr 27, 2024)
Deaths caused by coronavirus (Apr 27, 2024)
Coronavirus confirmed cases (per 100k population) (Apr 27, 2024)
Deaths caused by coronavirus (per 100k population) (Apr 27, 2024)
Daily increase in number of cases (Apr 27, 2024)
Weekly increase in number of cases (Apr 27, 2024)
Cases doubled (in days) (Apr 27, 2024)
Hospitalized patients (Apr 18, 2022)
Negative test results (Apr 18, 2022)
Total test results (Apr 18, 2022)
COVID Vaccine doses distributed (per 100k population) (Sep 19, 2023)
COVID Vaccine doses administered (per 100k population) (Sep 19, 2023)
COVID Vaccine doses distributed (Sep 19, 2023)
COVID Vaccine doses administered (Sep 19, 2023)
Likely homosexual households (%)
Likely homosexual households (% change since 2000)
Likely homosexual households - Lesbian couples (%)
Likely homosexual households - Lesbian couples (% change since 2000)
Likely homosexual households - Gay men (%)
Likely homosexual households - Gay men (% change since 2000)
Cost of living index
Median gross rent ($)
Median contract rent ($)
Median monthly housing costs ($)
Median house or condo value ($)
Median house or condo value ($ change since 2000)
Mean house or condo value by units in structure - 1, detached ($)
Mean house or condo value by units in structure - 1, attached ($)
Mean house or condo value by units in structure - 2 ($)
Mean house or condo value by units in structure by units in structure - 3 or 4 ($)
Mean house or condo value by units in structure - 5 or more ($)
Mean house or condo value by units in structure - Boat, RV, van, etc. ($)
Mean house or condo value by units in structure - Mobile home ($)
Median house or condo value ($) - White
Median house or condo value ($) - Black or African American
Median house or condo value ($) - Asian
Median house or condo value ($) - Hispanic or Latino
Median house or condo value ($) - American Indian and Alaska Native
Median house or condo value ($) - Multirace
Median house or condo value ($) - Other Race
Median resident age
Resident age diversity
Median resident age - Males
Median resident age - Females
Median resident age - White
Median resident age - Black or African American
Median resident age - Asian
Median resident age - Hispanic or Latino
Median resident age - American Indian and Alaska Native
Median resident age - Multirace
Median resident age - Other Race
Median resident age - Males - White
Median resident age - Males - Black or African American
Median resident age - Males - Asian
Median resident age - Males - Hispanic or Latino
Median resident age - Males - American Indian and Alaska Native
Median resident age - Males - Multirace
Median resident age - Males - Other Race
Median resident age - Females - White
Median resident age - Females - Black or African American
Median resident age - Females - Asian
Median resident age - Females - Hispanic or Latino
Median resident age - Females - American Indian and Alaska Native
Median resident age - Females - Multirace
Median resident age - Females - Other Race
Commute - mean travel time to work (minutes)
Travel time to work - Less than 5 minutes (%)
Travel time to work - Less than 5 minutes (% change since 2000)
Travel time to work - 5 to 9 minutes (%)
Travel time to work - 5 to 9 minutes (% change since 2000)
Travel time to work - 10 to 19 minutes (%)
Travel time to work - 10 to 19 minutes (% change since 2000)
Travel time to work - 20 to 29 minutes (%)
Travel time to work - 20 to 29 minutes (% change since 2000)
Travel time to work - 30 to 39 minutes (%)
Travel time to work - 30 to 39 minutes (% change since 2000)
Travel time to work - 40 to 59 minutes (%)
Travel time to work - 40 to 59 minutes (% change since 2000)
Travel time to work - 60 to 89 minutes (%)
Travel time to work - 60 to 89 minutes (% change since 2000)
Travel time to work - 90 or more minutes (%)
Travel time to work - 90 or more minutes (% change since 2000)
Marital status - Never married (%)
Marital status - Now married (%)
Marital status - Separated (%)
Marital status - Widowed (%)
Marital status - Divorced (%)
Median family income ($)
Median family income (% change since 2000)
Median non-family income ($)
Median non-family income (% change since 2000)
Median per capita income ($)
Median per capita income (% change since 2000)
Median family income ($) - White
Median family income ($) - Black or African American
Median family income ($) - Asian
Median family income ($) - Hispanic or Latino
Median family income ($) - American Indian and Alaska Native
Median family income ($) - Multirace
Median family income ($) - Other Race
Median year house/condo built
Median year apartment built
Year house built - Built 2005 or later (%)
Year house built - Built 2000 to 2004 (%)
Year house built - Built 1990 to 1999 (%)
Year house built - Built 1980 to 1989 (%)
Year house built - Built 1970 to 1979 (%)
Year house built - Built 1960 to 1969 (%)
Year house built - Built 1950 to 1959 (%)
Year house built - Built 1940 to 1949 (%)
Year house built - Built 1939 or earlier (%)
Average household size
Household density (households per square mile)
Average household size - White
Average household size - Black or African American
Average household size - Asian
Average household size - Hispanic or Latino
Average household size - American Indian and Alaska Native
Average household size - Multirace
Average household size - Other Race
Occupied housing units (%)
Vacant housing units (%)
Owner occupied housing units (%)
Renter occupied housing units (%)
Vacancy status - For rent (%)
Vacancy status - For sale only (%)
Vacancy status - Rented or sold, not occupied (%)
Vacancy status - For seasonal, recreational, or occasional use (%)
Vacancy status - For migrant workers (%)
Vacancy status - Other vacant (%)
Residents with income below the poverty level (%)
Residents with income below 50% of the poverty level (%)
Children below poverty level (%)
Poor families by family type - Married-couple family (%)
Poor families by family type - Male, no wife present (%)
Poor families by family type - Female, no husband present (%)
Poverty status for native-born residents (%)
Poverty status for foreign-born residents (%)
Poverty among high school graduates not in families (%)
Poverty among people who did not graduate high school not in families (%)
Residents with income below the poverty level (%) - White
Residents with income below the poverty level (%) - Black or African American
Residents with income below the poverty level (%) - Asian
Residents with income below the poverty level (%) - Hispanic or Latino
Residents with income below the poverty level (%) - American Indian and Alaska Native
Residents with income below the poverty level (%) - Multirace
Residents with income below the poverty level (%) - Other Race
Air pollution - Air Quality Index (AQI)
Air pollution - CO
Air pollution - NO2
Air pollution - SO2
Air pollution - Ozone
Air pollution - PM10
Air pollution - PM25
Air pollution - Pb
Crime - Murders per 100,000 population
Crime - Rapes per 100,000 population
Crime - Robberies per 100,000 population
Crime - Assaults per 100,000 population
Crime - Burglaries per 100,000 population
Crime - Thefts per 100,000 population
Crime - Auto thefts per 100,000 population
Crime - Arson per 100,000 population
Crime - City-data.com crime index
Crime - Violent crime index
Crime - Property crime index
Crime - Murders per 100,000 population (5 year average)
Crime - Rapes per 100,000 population (5 year average)
Crime - Robberies per 100,000 population (5 year average)
Crime - Assaults per 100,000 population (5 year average)
Crime - Burglaries per 100,000 population (5 year average)
Crime - Thefts per 100,000 population (5 year average)
Crime - Auto thefts per 100,000 population (5 year average)
Crime - Arson per 100,000 population (5 year average)
Crime - City-data.com crime index (5 year average)
Crime - Violent crime index (5 year average)
Crime - Property crime index (5 year average)
1996 Presidential Elections Results (%) - Democratic Party (Clinton)
1996 Presidential Elections Results (%) - Republican Party (Dole)
1996 Presidential Elections Results (%) - Other
2000 Presidential Elections Results (%) - Democratic Party (Gore)
2000 Presidential Elections Results (%) - Republican Party (Bush)
2000 Presidential Elections Results (%) - Other
2004 Presidential Elections Results (%) - Democratic Party (Kerry)
2004 Presidential Elections Results (%) - Republican Party (Bush)
2004 Presidential Elections Results (%) - Other
2008 Presidential Elections Results (%) - Democratic Party (Obama)
2008 Presidential Elections Results (%) - Republican Party (McCain)
2008 Presidential Elections Results (%) - Other
2012 Presidential Elections Results (%) - Democratic Party (Obama)
2012 Presidential Elections Results (%) - Republican Party (Romney)
2012 Presidential Elections Results (%) - Other
2016 Presidential Elections Results (%) - Democratic Party (Clinton)
2016 Presidential Elections Results (%) - Republican Party (Trump)
2016 Presidential Elections Results (%) - Other
2020 Presidential Elections Results (%) - Democratic Party (Biden)
2020 Presidential Elections Results (%) - Republican Party (Trump)
2020 Presidential Elections Results (%) - Other
Ancestries Reported - Arab (%)
Ancestries Reported - Czech (%)
Ancestries Reported - Danish (%)
Ancestries Reported - Dutch (%)
Ancestries Reported - English (%)
Ancestries Reported - French (%)
Ancestries Reported - French Canadian (%)
Ancestries Reported - German (%)
Ancestries Reported - Greek (%)
Ancestries Reported - Hungarian (%)
Ancestries Reported - Irish (%)
Ancestries Reported - Italian (%)
Ancestries Reported - Lithuanian (%)
Ancestries Reported - Norwegian (%)
Ancestries Reported - Polish (%)
Ancestries Reported - Portuguese (%)
Ancestries Reported - Russian (%)
Ancestries Reported - Scotch-Irish (%)
Ancestries Reported - Scottish (%)
Ancestries Reported - Slovak (%)
Ancestries Reported - Subsaharan African (%)
Ancestries Reported - Swedish (%)
Ancestries Reported - Swiss (%)
Ancestries Reported - Ukrainian (%)
Ancestries Reported - United States (%)
Ancestries Reported - Welsh (%)
Ancestries Reported - West Indian (%)
Ancestries Reported - Other (%)
Educational Attainment - No schooling completed (%)
Educational Attainment - Less than high school (%)
Educational Attainment - High school or equivalent (%)
Educational Attainment - Less than 1 year of college (%)
Educational Attainment - 1 or more years of college (%)
Educational Attainment - Associate degree (%)
Educational Attainment - Bachelor's degree (%)
Educational Attainment - Master's degree (%)
Educational Attainment - Professional school degree (%)
Educational Attainment - Doctorate degree (%)
School Enrollment - Nursery, preschool (%)
School Enrollment - Kindergarten (%)
School Enrollment - Grade 1 to 4 (%)
School Enrollment - Grade 5 to 8 (%)
School Enrollment - Grade 9 to 12 (%)
School Enrollment - College undergrad (%)
School Enrollment - Graduate or professional (%)
School Enrollment - Not enrolled in school (%)
School enrollment - Public schools (%)
School enrollment - Private schools (%)
School enrollment - Not enrolled (%)
Median number of rooms in houses and condos
Median number of rooms in apartments
Housing units lacking complete plumbing facilities (%)
Housing units lacking complete kitchen facilities (%)
Density of houses
Urban houses (%)
Rural houses (%)
Households with people 60 years and over (%)
Households with people 65 years and over (%)
Households with people 75 years and over (%)
Households with one or more nonrelatives (%)
Households with no nonrelatives (%)
Population in households (%)
Family households (%)
Nonfamily households (%)
Population in families (%)
Family households with own children (%)
Median number of bedrooms in owner occupied houses
Mean number of bedrooms in owner occupied houses
Median number of bedrooms in renter occupied houses
Mean number of bedrooms in renter occupied houses
Median number of vehichles in owner occupied houses
Mean number of vehichles in owner occupied houses
Median number of vehichles in renter occupied houses
Mean number of vehichles in renter occupied houses
Mortgage status - with mortgage (%)
Mortgage status - with second mortgage (%)
Mortgage status - with home equity loan (%)
Mortgage status - with both second mortgage and home equity loan (%)
Mortgage status - without a mortgage (%)
Average family size
Average family size - White
Average family size - Black or African American
Average family size - Asian
Average family size - Hispanic or Latino
Average family size - American Indian and Alaska Native
Average family size - Multirace
Average family size - Other Race
Geographical mobility - Same house 1 year ago (%)
Geographical mobility - Moved within same county (%)
Geographical mobility - Moved from different county within same state (%)
Geographical mobility - Moved from different state (%)
Geographical mobility - Moved from abroad (%)
Place of birth - Born in state of residence (%)
Place of birth - Born in other state (%)
Place of birth - Native, outside of US (%)
Place of birth - Foreign born (%)
Housing units in structures - 1, detached (%)
Housing units in structures - 1, attached (%)
Housing units in structures - 2 (%)
Housing units in structures - 3 or 4 (%)
Housing units in structures - 5 to 9 (%)
Housing units in structures - 10 to 19 (%)
Housing units in structures - 20 to 49 (%)
Housing units in structures - 50 or more (%)
Housing units in structures - Mobile home (%)
Housing units in structures - Boat, RV, van, etc. (%)
House/condo owner moved in on average (years ago)
Renter moved in on average (years ago)
Year householder moved into unit - Moved in 1999 to March 2000 (%)
Year householder moved into unit - Moved in 1995 to 1998 (%)
Year householder moved into unit - Moved in 1990 to 1994 (%)
Year householder moved into unit - Moved in 1980 to 1989 (%)
Year householder moved into unit - Moved in 1970 to 1979 (%)
Year householder moved into unit - Moved in 1969 or earlier (%)
Means of transportation to work - Drove car alone (%)
Means of transportation to work - Carpooled (%)
Means of transportation to work - Public transportation (%)
Means of transportation to work - Bus or trolley bus (%)
Means of transportation to work - Streetcar or trolley car (%)
Means of transportation to work - Subway or elevated (%)
Means of transportation to work - Railroad (%)
Means of transportation to work - Ferryboat (%)
Means of transportation to work - Taxicab (%)
Means of transportation to work - Motorcycle (%)
Means of transportation to work - Bicycle (%)
Means of transportation to work - Walked (%)
Means of transportation to work - Other means (%)
Working at home (%)
Industry diversity
Most Common Industries - Agriculture, forestry, fishing and hunting, and mining (%)
Most Common Industries - Agriculture, forestry, fishing and hunting (%)
Most Common Industries - Mining, quarrying, and oil and gas extraction (%)
Most Common Industries - Construction (%)
Most Common Industries - Manufacturing (%)
Most Common Industries - Wholesale trade (%)
Most Common Industries - Retail trade (%)
Most Common Industries - Transportation and warehousing, and utilities (%)
Most Common Industries - Transportation and warehousing (%)
Most Common Industries - Utilities (%)
Most Common Industries - Information (%)
Most Common Industries - Finance and insurance, and real estate and rental and leasing (%)
Most Common Industries - Finance and insurance (%)
Most Common Industries - Real estate and rental and leasing (%)
Most Common Industries - Professional, scientific, and management, and administrative and waste management services (%)
Most Common Industries - Professional, scientific, and technical services (%)
Most Common Industries - Management of companies and enterprises (%)
Most Common Industries - Administrative and support and waste management services (%)
Most Common Industries - Educational services, and health care and social assistance (%)
Most Common Industries - Educational services (%)
Most Common Industries - Health care and social assistance (%)
Most Common Industries - Arts, entertainment, and recreation, and accommodation and food services (%)
Most Common Industries - Arts, entertainment, and recreation (%)
Most Common Industries - Accommodation and food services (%)
Most Common Industries - Other services, except public administration (%)
Most Common Industries - Public administration (%)
Occupation diversity
Most Common Occupations - Management, business, science, and arts occupations (%)
Most Common Occupations - Management, business, and financial occupations (%)
Most Common Occupations - Management occupations (%)
Most Common Occupations - Business and financial operations occupations (%)
Most Common Occupations - Computer, engineering, and science occupations (%)
Most Common Occupations - Computer and mathematical occupations (%)
Most Common Occupations - Architecture and engineering occupations (%)
Most Common Occupations - Life, physical, and social science occupations (%)
Most Common Occupations - Education, legal, community service, arts, and media occupations (%)
Most Common Occupations - Community and social service occupations (%)
Most Common Occupations - Legal occupations (%)
Most Common Occupations - Education, training, and library occupations (%)
Most Common Occupations - Arts, design, entertainment, sports, and media occupations (%)
Most Common Occupations - Healthcare practitioners and technical occupations (%)
Most Common Occupations - Health diagnosing and treating practitioners and other technical occupations (%)
Most Common Occupations - Health technologists and technicians (%)
Most Common Occupations - Service occupations (%)
Most Common Occupations - Healthcare support occupations (%)
Most Common Occupations - Protective service occupations (%)
Most Common Occupations - Fire fighting and prevention, and other protective service workers including supervisors (%)
Most Common Occupations - Law enforcement workers including supervisors (%)
Most Common Occupations - Food preparation and serving related occupations (%)
Most Common Occupations - Building and grounds cleaning and maintenance occupations (%)
Most Common Occupations - Personal care and service occupations (%)
Most Common Occupations - Sales and office occupations (%)
Most Common Occupations - Sales and related occupations (%)
Most Common Occupations - Office and administrative support occupations (%)
Most Common Occupations - Natural resources, construction, and maintenance occupations (%)
Most Common Occupations - Farming, fishing, and forestry occupations (%)
Most Common Occupations - Construction and extraction occupations (%)
Most Common Occupations - Installation, maintenance, and repair occupations (%)
Most Common Occupations - Production, transportation, and material moving occupations (%)
Most Common Occupations - Production occupations (%)
Most Common Occupations - Transportation occupations (%)
Most Common Occupations - Material moving occupations (%)
People in Group quarters - Institutionalized population (%)
People in Group quarters - Correctional institutions (%)
People in Group quarters - Federal prisons and detention centers (%)
People in Group quarters - Halfway houses (%)
People in Group quarters - Local jails and other confinement facilities (including police lockups) (%)
People in Group quarters - Military disciplinary barracks (%)
People in Group quarters - State prisons (%)
People in Group quarters - Other types of correctional institutions (%)
People in Group quarters - Nursing homes (%)
People in Group quarters - Hospitals/wards, hospices, and schools for the handicapped (%)
People in Group quarters - Hospitals/wards and hospices for chronically ill (%)
People in Group quarters - Hospices or homes for chronically ill (%)
People in Group quarters - Military hospitals or wards for chronically ill (%)
People in Group quarters - Other hospitals or wards for chronically ill (%)
People in Group quarters - Hospitals or wards for drug/alcohol abuse (%)
People in Group quarters - Mental (Psychiatric) hospitals or wards (%)
People in Group quarters - Schools, hospitals, or wards for the mentally retarded (%)
People in Group quarters - Schools, hospitals, or wards for the physically handicapped (%)
People in Group quarters - Institutions for the deaf (%)
People in Group quarters - Institutions for the blind (%)
People in Group quarters - Orthopedic wards and institutions for the physically handicapped (%)
People in Group quarters - Wards in general hospitals for patients who have no usual home elsewhere (%)
People in Group quarters - Wards in military hospitals for patients who have no usual home elsewhere (%)
People in Group quarters - Juvenile institutions (%)
People in Group quarters - Long-term care (%)
People in Group quarters - Homes for abused, dependent, and neglected children (%)
People in Group quarters - Residential treatment centers for emotionally disturbed children (%)
People in Group quarters - Training schools for juvenile delinquents (%)
People in Group quarters - Short-term care, detention or diagnostic centers for delinquent children (%)
People in Group quarters - Type of juvenile institution unknown (%)
People in Group quarters - Noninstitutionalized population (%)
People in Group quarters - College dormitories (includes college quarters off campus) (%)
People in Group quarters - Military quarters (%)
People in Group quarters - On base (%)
People in Group quarters - Barracks, unaccompanied personnel housing (UPH), (Enlisted/Officer), ;and similar group living quarters for military personnel (%)
People in Group quarters - Transient quarters for temporary residents (%)
People in Group quarters - Military ships (%)
People in Group quarters - Group homes (%)
People in Group quarters - Homes or halfway houses for drug/alcohol abuse (%)
People in Group quarters - Homes for the mentally ill (%)
People in Group quarters - Homes for the mentally retarded (%)
People in Group quarters - Homes for the physically handicapped (%)
People in Group quarters - Other group homes (%)
People in Group quarters - Religious group quarters (%)
People in Group quarters - Dormitories (%)
People in Group quarters - Agriculture workers' dormitories on farms (%)
People in Group quarters - Job Corps and vocational training facilities (%)
People in Group quarters - Other workers' dormitories (%)
People in Group quarters - Crews of maritime vessels (%)
People in Group quarters - Other nonhousehold living situations (%)
People in Group quarters - Other noninstitutional group quarters (%)
Residents speaking English at home (%)
Residents speaking English at home - Born in the United States (%)
Residents speaking English at home - Native, born elsewhere (%)
Residents speaking English at home - Foreign born (%)
Residents speaking Spanish at home (%)
Residents speaking Spanish at home - Born in the United States (%)
Residents speaking Spanish at home - Native, born elsewhere (%)
Residents speaking Spanish at home - Foreign born (%)
Residents speaking other language at home (%)
Residents speaking other language at home - Born in the United States (%)
Residents speaking other language at home - Native, born elsewhere (%)
Residents speaking other language at home - Foreign born (%)
Class of Workers - Employee of private company (%)
Class of Workers - Self-employed in own incorporated business (%)
Class of Workers - Private not-for-profit wage and salary workers (%)
Class of Workers - Local government workers (%)
Class of Workers - State government workers (%)
Class of Workers - Federal government workers (%)
Class of Workers - Self-employed workers in own not incorporated business and Unpaid family workers (%)
House heating fuel used in houses and condos - Utility gas (%)
House heating fuel used in houses and condos - Bottled, tank, or LP gas (%)
House heating fuel used in houses and condos - Electricity (%)
House heating fuel used in houses and condos - Fuel oil, kerosene, etc. (%)
House heating fuel used in houses and condos - Coal or coke (%)
House heating fuel used in houses and condos - Wood (%)
House heating fuel used in houses and condos - Solar energy (%)
House heating fuel used in houses and condos - Other fuel (%)
House heating fuel used in houses and condos - No fuel used (%)
House heating fuel used in apartments - Utility gas (%)
House heating fuel used in apartments - Bottled, tank, or LP gas (%)
House heating fuel used in apartments - Electricity (%)
House heating fuel used in apartments - Fuel oil, kerosene, etc. (%)
House heating fuel used in apartments - Coal or coke (%)
House heating fuel used in apartments - Wood (%)
House heating fuel used in apartments - Solar energy (%)
House heating fuel used in apartments - Other fuel (%)
House heating fuel used in apartments - No fuel used (%)
Armed forces status - In Armed Forces (%)
Armed forces status - Civilian (%)
Armed forces status - Civilian - Veteran (%)
Armed forces status - Civilian - Nonveteran (%)
Fatal accidents locations in years 2005-2021
Fatal accidents locations in 2005
Fatal accidents locations in 2006
Fatal accidents locations in 2007
Fatal accidents locations in 2008
Fatal accidents locations in 2009
Fatal accidents locations in 2010
Fatal accidents locations in 2011
Fatal accidents locations in 2012
Fatal accidents locations in 2013
Fatal accidents locations in 2014
Fatal accidents locations in 2015
Fatal accidents locations in 2016
Fatal accidents locations in 2017
Fatal accidents locations in 2018
Fatal accidents locations in 2019
Fatal accidents locations in 2020
Fatal accidents locations in 2021
Alcohol use - People drinking some alcohol every month (%)
Alcohol use - People not drinking at all (%)
Alcohol use - Average days/month drinking alcohol
Alcohol use - Average drinks/week
Alcohol use - Average days/year people drink much
Audiometry - Average condition of hearing (%)
Audiometry - People that can hear a whisper from across a quiet room (%)
Audiometry - People that can hear normal voice from across a quiet room (%)
Audiometry - Ears ringing, roaring, buzzing (%)
Audiometry - Had a job exposure to loud noise (%)
Audiometry - Had off-work exposure to loud noise (%)
Blood Pressure & Cholesterol - Has high blood pressure (%)
Blood Pressure & Cholesterol - Checking blood pressure at home (%)
Blood Pressure & Cholesterol - Frequently checking blood cholesterol (%)
Blood Pressure & Cholesterol - Has high cholesterol level (%)
Consumer Behavior - Money monthly spent on food at supermarket/grocery store
Consumer Behavior - Money monthly spent on food at other stores
Consumer Behavior - Money monthly spent on eating out
Consumer Behavior - Money monthly spent on carryout/delivered foods
Consumer Behavior - Income spent on food at supermarket/grocery store (%)
Consumer Behavior - Income spent on food at other stores (%)
Consumer Behavior - Income spent on eating out (%)
Consumer Behavior - Income spent on carryout/delivered foods (%)
Current Health Status - General health condition (%)
Current Health Status - Blood donors (%)
Current Health Status - Has blood ever tested for HIV virus (%)
Current Health Status - Left-handed people (%)
Dermatology - People using sunscreen (%)
Diabetes - Diabetics (%)
Diabetes - Had a blood test for high blood sugar (%)
Diabetes - People taking insulin (%)
Diet Behavior & Nutrition - Diet health (%)
Diet Behavior & Nutrition - Milk product consumption (# of products/month)
Diet Behavior & Nutrition - Meals not home prepared (#/week)
Diet Behavior & Nutrition - Meals from fast food or pizza place (#/week)
Diet Behavior & Nutrition - Ready-to-eat foods (#/month)
Diet Behavior & Nutrition - Frozen meals/pizza (#/month)
Drug Use - People that ever used marijuana or hashish (%)
Drug Use - Ever used hard drugs (%)
Drug Use - Ever used any form of cocaine (%)
Drug Use - Ever used heroin (%)
Drug Use - Ever used methamphetamine (%)
Health Insurance - People covered by health insurance (%)
Kidney Conditions-Urology - Avg. # of times urinating at night
Medical Conditions - People with asthma (%)
Medical Conditions - People with anemia (%)
Medical Conditions - People with psoriasis (%)
Medical Conditions - People with overweight (%)
Medical Conditions - Elderly people having difficulties in thinking or remembering (%)
Medical Conditions - People who ever received blood transfusion (%)
Medical Conditions - People having trouble seeing even with glass/contacts (%)
Medical Conditions - People with arthritis (%)
Medical Conditions - People with gout (%)
Medical Conditions - People with congestive heart failure (%)
Medical Conditions - People with coronary heart disease (%)
Medical Conditions - People with angina pectoris (%)
Medical Conditions - People who ever had heart attack (%)
Medical Conditions - People who ever had stroke (%)
Medical Conditions - People with emphysema (%)
Medical Conditions - People with thyroid problem (%)
Medical Conditions - People with chronic bronchitis (%)
Medical Conditions - People with any liver condition (%)
Medical Conditions - People who ever had cancer or malignancy (%)
Mental Health - People who have little interest in doing things (%)
Mental Health - People feeling down, depressed, or hopeless (%)
Mental Health - People who have trouble sleeping or sleeping too much (%)
Mental Health - People feeling tired or having little energy (%)
Mental Health - People with poor appetite or overeating (%)
Mental Health - People feeling bad about themself (%)
Mental Health - People who have trouble concentrating on things (%)
Mental Health - People moving or speaking slowly or too fast (%)
Mental Health - People having thoughts they would be better off dead (%)
Oral Health - Average years since last visit a dentist
Oral Health - People embarrassed because of mouth (%)
Oral Health - People with gum disease (%)
Oral Health - General health of teeth and gums (%)
Oral Health - Average days a week using dental floss/device
Oral Health - Average days a week using mouthwash for dental problem
Oral Health - Average number of teeth
Pesticide Use - Households using pesticides to control insects (%)
Pesticide Use - Households using pesticides to kill weeds (%)
Physical Activity - People doing vigorous-intensity work activities (%)
Physical Activity - People doing moderate-intensity work activities (%)
Physical Activity - People walking or bicycling (%)
Physical Activity - People doing vigorous-intensity recreational activities (%)
Physical Activity - People doing moderate-intensity recreational activities (%)
Physical Activity - Average hours a day doing sedentary activities
Physical Activity - Average hours a day watching TV or videos
Physical Activity - Average hours a day using computer
Physical Functioning - People having limitations keeping them from working (%)
Physical Functioning - People limited in amount of work they can do (%)
Physical Functioning - People that need special equipment to walk (%)
Physical Functioning - People experiencing confusion/memory problems (%)
Physical Functioning - People requiring special healthcare equipment (%)
Prescription Medications - Average number of prescription medicines taking
Preventive Aspirin Use - Adults 40+ taking low-dose aspirin (%)
Reproductive Health - Vaginal deliveries (%)
Reproductive Health - Cesarean deliveries (%)
Reproductive Health - Deliveries resulted in a live birth (%)
Reproductive Health - Pregnancies resulted in a delivery (%)
Reproductive Health - Women breastfeeding newborns (%)
Reproductive Health - Women that had a hysterectomy (%)
Reproductive Health - Women that had both ovaries removed (%)
Reproductive Health - Women that have ever taken birth control pills (%)
Reproductive Health - Women taking birth control pills (%)
Reproductive Health - Women that have ever used Depo-Provera or injectables (%)
Reproductive Health - Women that have ever used female hormones (%)
Sexual Behavior - People 18+ that ever had sex (vaginal, anal, or oral) (%)
Sexual Behavior - Males 18+ that ever had vaginal sex with a woman (%)
Sexual Behavior - Males 18+ that ever performed oral sex on a woman (%)
Sexual Behavior - Males 18+ that ever had anal sex with a woman (%)
Sexual Behavior - Males 18+ that ever had any sex with a man (%)
Sexual Behavior - Females 18+ that ever had vaginal sex with a man (%)
Sexual Behavior - Females 18+ that ever performed oral sex on a man (%)
Sexual Behavior - Females 18+ that ever had anal sex with a man (%)
Sexual Behavior - Females 18+ that ever had any kind of sex with a woman (%)
Sexual Behavior - Average age people first had sex
Sexual Behavior - Average number of female sex partners in lifetime (males 18+)
Sexual Behavior - Average number of female vaginal sex partners in lifetime (males 18+)
Sexual Behavior - Average age people first performed oral sex on a woman (18+)
Sexual Behavior - Average number of woman performed oral sex on in lifetime (18+)
Sexual Behavior - Average number of male sex partners in lifetime (males 18+)
Sexual Behavior - Average number of male anal sex partners in lifetime (males 18+)
Sexual Behavior - Average age people first performed oral sex on a man (18+)
Sexual Behavior - Average number of male oral sex partners in lifetime (18+)
Sexual Behavior - People using protection when performing oral sex (%)
Sexual Behavior - Average number of times people have vaginal or anal sex a year
Sexual Behavior - People having sex without condom (%)
Sexual Behavior - Average number of male sex partners in lifetime (females 18+)
Sexual Behavior - Average number of male vaginal sex partners in lifetime (females 18+)
Sexual Behavior - Average number of female sex partners in lifetime (females 18+)
Sexual Behavior - Circumcised males 18+ (%)
Sleep Disorders - Average hours sleeping at night
Sleep Disorders - People that has trouble sleeping (%)
Smoking-Cigarette Use - People smoking cigarettes (%)
Taste & Smell - People 40+ having problems with smell (%)
Taste & Smell - People 40+ having problems with taste (%)
Taste & Smell - People 40+ that ever had wisdom teeth removed (%)
Taste & Smell - People 40+ that ever had tonsils teeth removed (%)
Taste & Smell - People 40+ that ever had a loss of consciousness because of a head injury (%)
Taste & Smell - People 40+ that ever had a broken nose or other serious injury to face or skull (%)
Taste & Smell - People 40+ that ever had two or more sinus infections (%)
Weight - Average height (inches)
Weight - Average weight (pounds)
Weight - Average BMI
Weight - People that are obese (%)
Weight - People that ever were obese (%)
Weight - People trying to lose weight (%)
16,599 53.7% White alone 6,176 20.0% Hispanic 5,370 17.4% Asian alone 2,255 7.3% Two or more races 299 1.0% Black alone 46 0.1% Native Hawaiian and Other 15 0.05% Other race alone
According to our research of California and other state lists, there were 13 registered sex offenders living in Laguna Hills, California as of April 27, 2024 . The ratio of all residents to sex offenders in Laguna Hills is 2,425 to 1.The ratio of registered sex offenders to all residents in this city is much lower than the state average.
Officers per 1,000 residents here:
0.03California average:
1.98
Latest news from Laguna Hills, CA collected exclusively by city-data.com from local newspapers, TV, and radio stations
Laguna Hills, CA City Guides: Ancestries: Iranian (7.5%), German (5.1%), English (5.0%), Irish (3.9%), American (3.3%), Italian (2.9%).
Current Local Time:
Land area: 6.35 square miles.
Population density: 4,815 people per square mile (average).
8,246 residents are foreign born (15.8% Asia , 7.2% Latin America ).
This city:
26.7%California:
26.5%
Median real estate property taxes paid for housing units with mortgages in 2022: $6,031 (0.7%)Median real estate property taxes paid for housing units with no mortgage in 2022: $5,649 (0.6%)
Nearest city with pop. 50,000+: Mission Viejo, CA
Nearest city with pop. 200,000+: South Coast, CA (5.6 miles
Nearest city with pop. 1,000,000+: Los Angeles, CA
Nearest cities:
Latitude: 33.60 N, Longitude: 117.70 W
Daytime population change due to commuting: +2,495 (+8.1%)Workers who live and work in this city: 4,954 (30.8%)
Area code commonly used in this area: 949
Single-family new house construction building permits:
2022: 6 buildings , average cost: $375,2002021: 1 building , cost: $208,9002020: 3 buildings , average cost: $1,045,0002019: 3 buildings , average cost: $73,3002018: 1 building , cost: $1,500,0002016: 1 building , cost: $1,285,0002015: 2 buildings , average cost: $577,6002013: 1 building , cost: $318,8002012: 1 building , cost: $700,0002010: 2 buildings , average cost: $1,040,7002008: 4 buildings , average cost: $658,3002007: 1 building , cost: $1,683,7002006: 1 building , cost: $466,9002005: 1 building , cost: $440,7002004: 22 buildings , average cost: $504,3002003: 35 buildings , average cost: $493,4002001: 2 buildings , average cost: $457,2002000: 3 buildings , average cost: $555,9001999: 4 buildings , average cost: $403,5001998: 6 buildings , average cost: $511,1001997: 3 buildings , average cost: $433,500Unemployment in December 2023: Population change in the 1990s: +3,826 (+14.0%).
Most common occupations in Laguna Hills, CA (%)
Both Males Females
Other sales and related occupations, including supervisors (5.6%)
Other management occupations, except farmers and farm managers (5.5%)
Sales representatives, services, wholesale and manufacturing (4.9%)
Other office and administrative support workers, including supervisors (4.8%)
Top executives (3.8%)
Computer specialists (3.7%)
Retail sales workers, except cashiers (2.9%)
Other management occupations, except farmers and farm managers (6.8%)
Other sales and related occupations, including supervisors (6.3%)
Top executives (5.9%)
Sales representatives, services, wholesale and manufacturing (5.0%)
Computer specialists (4.9%)
Engineers (4.1%)
Other office and administrative support workers, including supervisors (3.2%)
Other office and administrative support workers, including supervisors (6.8%)
Secretaries and administrative assistants (5.0%)
Other sales and related occupations, including supervisors (4.8%)
Sales representatives, services, wholesale and manufacturing (4.7%)
Preschool, kindergarten, elementary, and middle school teachers (4.5%)
Information and record clerks, except customer service representatives (4.3%)
Other management occupations, except farmers and farm managers (3.8%)
Earthquake activity:
Laguna Hills-area historical earthquake activity is significantly above California state average. It is 6733% greater than the overall U.S. average. On 6/28/1992 at 11:57:34, a magnitude 7.6 (6.2 MB, 7.6 MS, 7.3 MW, Depth: 0.7 mi, Class: Major, Intensity: VIII - XII) earthquake occurred 78.3 miles away from Laguna Hills center, causing 3 deaths ( 1 shaking deaths, 2 other deaths) and 400 injuries, causing $100,000,000 total damage and $40,000,000 insured lossesOn 7/21/1952 at 11:52:14, a magnitude 7.7 (7.7 UK) earthquake occurred 122.1 miles away from Laguna Hills center, causing $50,000,000 total damage On 10/16/1999 at 09:46:44, a magnitude 7.4 (6.3 MB, 7.4 MS, 7.2 MW, 7.3 ML) earthquake occurred 96.2 miles away from the city center On 5/19/1940 at 04:36:40, a magnitude 7.2 (7.2 UK) earthquake occurred 118.5 miles away from Laguna Hills center, causing $33,000,000 total damage On 4/21/1918 at 22:32:30, a magnitude 6.8 (6.8 UK, Class: Strong, Intensity: VII - IX) earthquake occurred 21.0 miles away from Laguna Hills center On 11/4/1927 at 13:51:53, a magnitude 7.5 (7.5 UK) earthquake occurred 211.1 miles away from Laguna Hills center Magnitude types: body-wave magnitude (MB), local magnitude (ML), surface-wave magnitude (MS), moment magnitude (MW) Natural disasters: The number of natural disasters in Orange County (32) is a lot greater than the US average (15).Major Disasters (Presidential) Declared: 22Emergencies Declared: 2Floods: 15, Fires: 13, Storms: 9, Landslides: 6, Winter Storms: 6, Mudslides: 5, Earthquakes: 2, Heavy Rain: 1, Hurricane: 1, Snow: 1, Tornado: 1, Wind: 1, Other: 1 (Note: some incidents may be assigned to more than one category). Main business address for: DEL TACO INCOME PROPERTIES IV REAL ESTATE ), DEL TACO RESTAURANT PROPERTIES I REAL ESTATE ), DEL TACO RESTAURANT PROPERTIES II REAL ESTATE ), ELECTROPURE INC PATENT OWNERS & LESSORS ), DEL TACO RESTAURANT PROPERTIES III REAL ESTATE ).
Hospitals and medical centers in Laguna Hills: ANCONA HOME (22682 ANCONA) GOOD SHEPHERD - LAS BOLSAS (25232 LAS BOLSAS) SADDLEBACK MEMORIAL MEDICAL CENTER (Voluntary non-profit - Private, 24451 HEALTH CENTER DRIVE) COUNTRY VILLA LAGUNA HILLS HEALTHCARE CENTER (24452 HEALTH CENTER DRIVE)
PALM TERRACE HEALTHCARE AND REHABILITATION CENTER (24962 CALLE ARAGON)
VILLA VALENCIA HEALTH CARE CENTER (24552 PASEO DE VALENCIA)
SADDLEBACK DIALYSIS (23141 PLAZA POINTE DRIVE)
HOME CARE OF AMERICA, INC (23461 SOUTH POINTE DRIVE, SUITE 155)
MAXIM HEALTHCARE SERVICES INC (23421 SOUTH POINTE DRIVE, SUITE 200)
SADDLEBACK COORDINATED HOME CARE (23521 PASEO DE VALENCIA, STE 100)
Heliports located in Laguna Hills: Amtrak stations near Laguna Hills: 7 miles: LAGUNA BEACH (TRANSIT DEPOT, BROADWAY BTW. BEACH & FOR) - Bus Station 7 miles: IRVINE (15215 BARRANCA PKWY.) Services: ticket office, fully wheelchair accessible, enclosed waiting area, public restrooms, public payphones, snack bar, free short-term parking, free long-term parking, call for taxi service, intercity bus service, public transit connection.
8 miles: SAN JUAN CAPISTRANO (LEE HALL, MONTEREY AVE. & SAN GORGONIO WAY) Services: ticket office, fully wheelchair accessible, enclosed waiting area, public restrooms, public payphones, full-service food facilities, paid short-term parking, paid long-term parking, call for taxi service, intercity bus service, public transit connection.
Operable nuclear power plants near Laguna Hills:
13 miles: San Onofre 2 and 3 in San Clemente, CA.
College/University in Laguna Hills: Allied American University Full-time enrollment: 1,525; Location: 22952 Alcalde Drive; Private, for-profit; Website: allied.edu)
Colleges/universities with over 2000 students nearest to Laguna Hills:
Saddleback College (about 4 miles; Mission Viejo, CA ; Full-time enrollment: 13,716)
Brandman University (about 6 miles; Irvine, CA ; FT enrollment: 6,027)
Irvine Valley College (about 7 miles; Irvine, CA ; FT enrollment: 8,005)
Concordia University-Irvine (about 8 miles; Irvine, CA ; FT enrollment: 3,284)
University of California-Irvine (about 9 miles; Irvine, CA ; FT enrollment: 28,587)
Coastline Community College (about 10 miles; Fountain Valley, CA ; FT enrollment: 4,591)
University of Phoenix-Southern California Campus (about 13 miles; Costa Mesa, CA ; FT enrollment: 8,110)
Public high school in Laguna Hills:
Private high schools in Laguna Hills: NEW VISTA SCHOOL Students: 68, Location: 23092 MILL CREEK DR, Grades: 6-12)
ALLIED NATIONAL HIGH SCHOOL Students: 67, Location: 22981 ALCALDE DR, Grades: 9-12)
Public elementary/middle schools in Laguna Hills: SAN JOAQUIN ELEMENTARY Students: 436, Location: 22182 BARBERA, Grades: KG-6)LOMARENA ELEMENTARY Students: 349, Location: 25100 EARHART RD., Grades: KG-6)VALENCIA ELEMENTARY Location: 25661 PASEO DE VALENCIA, Grades: KG-6)
Private elementary/middle schools in Laguna Hills: CORNERSTONE COMMUNITY SCHOOL Students: 37, Location: 23331 MOULTON PKWY, Grades: KG-8)
PATHWAY SCHOOL Students: 24, Location: 23802 AVENIDA DE LA CARLOTA, Grades: 1-8)
See full list of schools located in Laguna Hills
Notable location: (A) . Display/hide its location on the map
Shopping Centers: (1) , Oakbrook Village Shopping Center (2) , Moulton Parkway Plaza Shopping Center (3) , Mission Hills Plaza Shopping Center (4) , Laguna Hills Plaza Shopping Center (5) , Laguna Hills Mall Shopping Center (6) , Alicia Valencia Plaza Shopping Center (7) . Display/hide their locations on the map
Main business address in Laguna Hills include: (A) , DEL TACO RESTAURANT PROPERTIES I (B) , DEL TACO RESTAURANT PROPERTIES II (C) , ELECTROPURE INC (D) , DEL TACO RESTAURANT PROPERTIES III (E) . Display/hide their locations on the map
Reservoir: (A) . Display/hide its location on the map
Parks in Laguna Hills include: (1) , Veeh Ranch Park (2) , Beckenham Park (3) , Clarington Park (4) , El Conejo Park (5) , Knotty Pine Park (6) , Mackenzie Park (7) , Mandeville Park (8) , Marguerite M O'Neill Park (9) . Display/hide their locations on the map
Tourist attraction:
Court:
Birthplace of: Big Chocolate (musician) - Musician, Mike Hopkins (basketball) - Basketball player-coach, Tayyiba Haneef-Park - Volleyball player, Troy Cole - Soccer player, Chad Carvin - Swimmer.
Orange County has a predicted average indoor radon screening level less than 2 pCi/L (pico curies per liter) - Low Potential Average household size: This city:
2.9 peopleCalifornia:
2.9 people
Percentage of family households: This city:
73.9%Whole state:
68.7%
Percentage of households with unmarried partners: This city:
5.2%Whole state:
7.2%
Likely homosexual households (counted as self-reported same-sex unmarried-partner households)
Lesbian couples: 0.5% of all households Gay men: 0.4% of all households
People in group quarters in Laguna Hills in 2010:
215 people in group homes intended for adults
136 people in nursing facilities/skilled-nursing facilities
11 people in residential treatment centers for adults
7 people in other noninstitutional facilities
People in group quarters in Laguna Hills in 2000:
216 people in other noninstitutional group quarters
185 people in nursing homes
13 people in other nonhousehold living situations
10 people in homes for the mentally retarded
Banks with most branches in Laguna Hills (2011 data):
Bank of America, National Association: Moulton Plaza Branch at 23711 Moulton Parkway, branch established on 1976/12/20; Laguna Hills Branch at 24211 Paseo De Valencia, branch established on 1974/04/01. Info updated 2009/11/18: Bank assets: $1,451,969.3 mil, Deposits: $1,077,176.8 mil, headquarters in Charlotte, NC, positive income , 5782 total offices , Holding Company: Bank Of America Corporation
JPMorgan Chase Bank, National Association: Laguna Hills/Leisure World Branch at 24268 El Toro Road, branch established on 1889/01/01; 24085 El Toro Rd Branch at 24085 El Toro Rd, branch established on 1988/12/27. Info updated 2011/11/10: Bank assets: $1,811,678.0 mil, Deposits: $1,190,738.0 mil, headquarters in Columbus, OH, positive income , International Specialization, 5577 total offices , Holding Company: Jpmorgan Chase & Co.
Wells Fargo Bank, National Association: Aliso Town Center Branch at 25539 Paseo De Valencia, branch established on 1997/12/30; Alicia Town at 25632 Alicia Parkway, branch established on 1912/01/01. Info updated 2011/04/05: Bank assets: $1,161,490.0 mil, Deposits: $905,653.0 mil, headquarters in Sioux Falls, SD, positive income , 6395 total offices , Holding Company: Wells Fargo & Company
California Bank & Trust: Laguna Hills Branch at 24012 Calle De La Plata, #140, branch established on 1979/03/26. Info updated 2009/07/20: Bank assets: $10,894.1 mil, Deposits: $9,193.9 mil, headquarters in San Diego, CA, positive income , Commercial Lending Specialization, 109 total offices , Holding Company: Zions Bancorporation
Gateway Business Bank: Laguna Hills Branch at 23601 Moulton Parkway, Suite E, branch established on 2002/09/13. Info updated 2006/11/03: Bank assets: $201.3 mil, Deposits: $173.3 mil, headquarters in Cerritos, CA, negative income in the last year , Commercial Lending Specialization, 3 total offices , Holding Company: Gateway Bancorp
OneWest Bank, FSB: Alicia Town Center Branch at 25624 Alicia Pkwy, branch established on 1979/01/01. Info updated 2011/07/21: Bank assets: $26,181.3 mil, Deposits: $15,408.4 mil, headquarters in Pasadena, CA, positive income , 79 total offices
Citibank, National Association: 24221 Calle De La Louisa Branch at 24221 Calle De La Louisa, branch established on 1934/10/01. Info updated 2012/01/10: Bank assets: $1,288,658.0 mil, Deposits: $882,541.0 mil, headquarters in Sioux Falls, SD, positive income , International Specialization, 1048 total offices , Holding Company: Citigroup Inc.
Farmers and Merchants Bank of Long Beach: Laguna Hills Branch at 24300 Paseo De Valencia, branch established on 2004/08/16. Info updated 2006/11/03: Bank assets: $4,659.3 mil, Deposits: $3,393.5 mil, headquarters in Long Beach, CA, positive income , Commercial Lending Specialization, 22 total offices , Holding Company: Palomar Enterprises, Llc
U.S. Bank National Association: Laguna Woods Branch at 24340 El Toro Road, branch established on 1998/03/20. Info updated 2012/01/30: Bank assets: $330,470.8 mil, Deposits: $236,091.5 mil, headquarters in Cincinnati, OH, positive income , 3121 total offices , Holding Company: U.S. Bancorp
4 other banks with 4 local branches
For population 15 years and over in Laguna Hills:
Never married: 29.0%Now married: 54.1%Separated: 0.6%Widowed: 4.9%Divorced: 11.3% For population 25 years and over in Laguna Hills:
High school or higher: 93.5%Bachelor's degree or higher: 52.7%Graduate or professional degree: 17.5%Unemployed: 4.5%Mean travel time to work (commute): 19.8 minutes
Education Gini index (Inequality in education) Here:
10.9California average:
15.5
Religion statistics for Laguna Hills, CA (based on Orange County data)
Religion Adherents Congregations Catholic 797,473 67 Evangelical Protestant 345,893 894 Other 141,815 329 Mainline Protestant 76,574 202 Orthodox 13,406 19 Black Protestant 2,424 8 None 1,632,647 -
Source: Clifford Grammich, Kirk Hadaway, Richard Houseal, Dale E.Jones, Alexei Krindatch, Richie Stanley and Richard H.Taylor. 2012. 2010 U.S.Religion Census: Religious Congregations & Membership Study. Association of Statisticians of American Religious Bodies. Jones, Dale E., et al. 2002. Congregations and Membership in the United States 2000. Nashville, TN: Glenmary Research Center. Graphs represent county-level data
Food Environment Statistics: Number of grocery stores : 530Here :
1.78 / 10,000 pop.California :
2.14 / 10,000 pop.
Number of supercenters and club stores : 18This county :
0.06 / 10,000 pop.California :
0.04 / 10,000 pop.
Number of convenience stores (no gas) : 147This county :
0.49 / 10,000 pop.California :
0.62 / 10,000 pop.
Number of convenience stores (with gas) : 434Orange County :
1.46 / 10,000 pop.California :
1.49 / 10,000 pop.
Number of full-service restaurants : 2,438Orange County :
8.19 / 10,000 pop.State :
7.42 / 10,000 pop.
Adult diabetes rate : Orange County :
6.3%California :
7.3%
Adult obesity rate : Orange County :
18.5%California :
21.3%
Low-income preschool obesity rate : This county :
16.4%California :
17.9%
Health and Nutrition: Healthy diet rate : Laguna Hills:
51.5%California:
49.4%
Average overall health of teeth and gums : Laguna Hills:
50.1%California:
48.0%
Average BMI : Laguna Hills:
28.0California:
28.1
People feeling badly about themselves : Laguna Hills:
20.0%California:
20.2%
People not drinking alcohol at all : Laguna Hills:
10.6%California:
11.2%
Average hours sleeping at night : Laguna Hills:
6.8California:
6.8
General health condition : Laguna Hills:
58.1%State:
56.4%
Average condition of hearing : Here:
80.3%California:
80.9%
More about Health and Nutrition of Laguna Hills, CA Residents
Local government employment and payroll (March 2022)
Function
Full-time employees
Monthly full-time payroll
Average yearly full-time wage
Part-time employees
Monthly part-time payroll
Other Government Administration
6 $34,927 $69,854 0 $0 Parks and Recreation
5 $47,206 $113,294 10 $13,662 Housing and Community Development (Local)
5 $43,785 $105,084 2 $8,443 Streets and Highways
4 $41,215 $123,645 0 $0 Financial Administration
4 $38,834 $116,502 0 $0
Totals for Government
24 $205,967 $102,984 12 $22,105
Laguna Hills government finances - Expenditure in 2017 (per resident):
Construction - Regular Highways: $5,431,000 ($177.67)
Parks and Recreation: $281,000 ($9.19)Housing and Community Development: $68,000 ($2.22)Current Operations - Police Protection: $7,725,000 ($252.72)
Parks and Recreation: $6,143,000 ($200.96)Central Staff Services: $4,775,000 ($156.21)Financial Administration: $2,443,000 ($79.92)Regular Highways: $947,000 ($30.98)Health - Other: $250,000 ($8.18)General - Other: $42,000 ($1.37)General - Interest on Debt: $449,000 ($14.69)
Other Capital Outlay - Parks and Recreation: $1,572,000 ($51.43)
General Public Building: $648,000 ($21.20)Police Protection: $68,000 ($2.22)Central Staff Services: $41,000 ($1.34)Financial Administration: $38,000 ($1.24)
Laguna Hills government finances - Revenue in 2017 (per resident):
Charges - Other: $850,000 ($27.81)
Parks and Recreation: $756,000 ($24.73)Federal Intergovernmental - Other: $535,000 ($17.50)
Housing and Community Development: $103,000 ($3.37)Local Intergovernmental - Other: $40,000 ($1.31)
Miscellaneous - Special Assessments: $403,000 ($13.18)
Fines and Forfeits: $229,000 ($7.49)Rents: $108,000 ($3.53)Interest Earnings: $66,000 ($2.16)General Revenue - Other: $1,000 ($0.03)State Intergovernmental - Highways: $602,000 ($19.69)
Other: $451,000 ($14.75)General Local Government Support: $42,000 ($1.37)Tax - Property: $9,770,000 ($319.62)
General Sales and Gross Receipts: $6,512,000 ($213.03)Other Selective Sales: $1,437,000 ($47.01)Public Utilities Sales: $1,192,000 ($39.00)Other License: $780,000 ($25.52)Documentary and Stock Transfer: $253,000 ($8.28)Other: $108,000 ($3.53)
Laguna Hills government finances - Debt in 2017 (per resident):
Long Term Debt - Beginning Outstanding - Unspecified Public Purpose: $10,035,000 ($328.28)
Outstanding Unspecified Public Purpose: $8,731,000 ($285.63)Retired Unspecified Public Purpose: $1,352,000 ($44.23)Issue, Unspecified Public Purpose: $48,000 ($1.57)
Laguna Hills government finances - Cash and Securities in 2017 (per resident):
Other Funds - Cash and Securities: $9,219,000 ($301.59)
Sinking Funds - Cash and Securities: $1,815,000 ($59.38)
4.86% of this county's 2021 resident taxpayers lived in other counties in 2020 ($95,983 average adjusted gross income )
Here:
4.86%California average:
5.19%
0.01% of residents moved from foreign countries ($132 average AGI )Orange County:
0.01%California average:
0.03%
Top counties from which taxpayers relocated into this county between 2020 and 2021:
5.71% of this county's 2020 resident taxpayers moved to other counties in 2021 ($106,828 average adjusted gross income )
Here:
5.71%California average:
6.14%
0.01% of residents moved to foreign countries ($180 average AGI )Orange County:
0.01%California average:
0.02%
Top counties to which taxpayers relocated from this county between 2020 and 2021:
Businesses in Laguna Hills, CA
Name Count Name Count
24 Hour Fitness 1 Mazda 1 7-Eleven 4 McDonald's 1 Baja Fresh Mexican Grill 1 Motherhood Maternity 1 Baskin-Robbins 1 New Balance 3 Bath & Body Works 1 Nike 15 CVS 1 Nordstrom 1 Carl\s Jr. 3 Olive Garden 1 Charlotte Russe 1 Outback 1 Chuck E. Cheese's 1 Outback Steakhouse 1 Cinnabon 1 Papa John's Pizza 1 Circle K 1 Payless 1 Comfort Inn 1 Pizza Hut 1 Curves 1 Quiznos 2 Express 1 RadioShack 1 Famous Footwear 1 SAS Shoes 1 FedEx 9 Safeway 1 Firestone Complete Auto Care 1 Sears 3 Foot Locker 1 Spencer Gifts 1 GNC 2 Sprint Nextel 2 Gymboree 1 Starbucks 3 H&R Block 1 Subway 2 Haagen-Dazs 1 T-Mobile 3 Home Depot 1 The Limited 1 JCPenney 1 The Room Place 1 Jones New York 3 Toys"R"Us 1 Just Tires 1 Trader Joe's 1 Kroger 1 UPS 13 Lane Furniture 2 Vans 2 LensCrafters 1 Victoria's Secret 1 Macy's 1 Vons 1 Marriott 1 Walgreens 1 Marshalls 1 Wendy's 1
Strongest AM radio stations in Laguna Hills:
KPLS (830 AM; 50 kW; ORANGE, CA; Owner: CRN LICENSES, LLC)
KFI (640 AM; 50 kW; LOS ANGELES, CA; Owner: CAPSTAR TX LIMITED PARTNERSHIP)
KLAC (570 AM; 50 kW; LOS ANGELES, CA; Owner: AMFM RADIO LICENSES, L.L.C.)
KTNQ (1020 AM; 50 kW; LOS ANGELES, CA; Owner: KTNQ-AM LICENSE CORP.)
KXTA (1150 AM; 50 kW; LOS ANGELES, CA; Owner: CITICASTERS LICENSES, L.P.)
KDIS (1110 AM; 50 kW; PASADENA, CA; Owner: ABC,INC.)
KNX (1070 AM; 50 kW; LOS ANGELES, CA; Owner: INFINITY BROADCASTING OPERATIONS, INC.)
KFWB (980 AM; 50 kW; LOS ANGELES, CA; Owner: INFINITY BROADCASTING OPERATIONS, INC.)
KSPN (710 AM; 50 kW; LOS ANGELES, CA; Owner: KABC-AM RADIO, INC.)
KMPC (1540 AM; 50 kW; LOS ANGELES, CA; Owner: ROSE CITY RADIO CORPORATION)
KBLA (1580 AM; 50 kW; SANTA MONICA, CA)
KFMB (760 AM; 50 kW; SAN DIEGO, CA; Owner: MIDWEST TELEVISION, INC.)
KVNR (1480 AM; 5 kW; SANTA ANA, CA; Owner: LBI RADIO LICENSE CORP.)
Strongest FM radio stations in Laguna Hills:
KWVE (107.9 FM; SAN CLEMENTE, CA; Owner: CALVARY CHAPEL OF COSTA MESA)
KSBR (88.5 FM; MISSION VIEJO, CA; Owner: SADDLEBACK COMMUNITY COLLEGE DIST.)
KDLE (103.1 FM; NEWPORT BEACH, CA; Owner: ENTRAVISION HOLDINGS, LLC.)
KRTM (88.9 FM; TEMECULA, CA; Owner: PENFOLD COMMUNICATIONS, INC.)
KCBS-FM (93.1 FM; LOS ANGELES, CA; Owner: INFINITY BROADCASTING OPERATIONS, INC.)
KLRD (90.1 FM; YUCAIPA, CA; Owner: EDUCATIONAL MEDIA FOUNDATION)
KSCA (101.9 FM; GLENDALE, CA; Owner: HBC LICENSE CORPORATION)
KLOS (95.5 FM; LOS ANGELES, CA; Owner: KLOS-FM RADIO, INC.)
K212FA (90.3 FM; TEMPLE CITY, CA; Owner: EDUCATIONAL MEDIA FOUNDATION)
KZLA-FM (93.9 FM; LOS ANGELES, CA; Owner: EMMIS RADIO LICENSE CORPORATION)
KOST (103.5 FM; LOS ANGELES, CA; Owner: CAPSTAR TX LIMITED PARTNERSHIP)
KUOR-FM (89.1 FM; REDLANDS, CA; Owner: UNIVERSITY OF REDLANDS)
KPWR (105.9 FM; LOS ANGELES, CA; Owner: EMMIS RADIO LICENSE CORPORATION)
KLSX (97.1 FM; LOS ANGELES, CA; Owner: INFINITY BROADCASTING OPERATIONS, INC.)
KLVE (107.5 FM; LOS ANGELES, CA; Owner: KLVE-FM LICENSE CORP.)
KIIS-FM (102.7 FM; LOS ANGELES, CA; Owner: CITICASTERS LICENSES, L.P.)
KPCC (89.3 FM; PASADENA, CA; Owner: PASADENA AREA COMMUNITY COLLEGE DISTRICT)
KUSC (91.5 FM; LOS ANGELES, CA; Owner: UNIVERSITY OF SOUTHERN CALIFORNIA)
KHHT (92.3 FM; LOS ANGELES, CA; Owner: AMFM RADIO LICENSES, L.L.C.)
KBIG-FM (104.3 FM; LOS ANGELES, CA; Owner: AMFM RADIO LICENSES, L.L.C.)
TV broadcast stations around Laguna Hills:
KTRO-LP (Channel 50; LANCASTER, CA; Owner: ROBERT D. ADELMAN)
National Bridge Inventory (NBI) Statistics 26 Number of bridges282ft / 85.6m Total length2,236,274 Total average daily traffic151,464 Total average daily truck traffic
New bridges - historical statistics
1 1940-1949 4 1950-1959 6 1960-1969 4 1970-1979 6 1980-1989 5 1990-1999
See full National Bridge Inventory statistics for Laguna Hills, CA
Home Mortgage Disclosure Act Aggregated Statistics For Year 2009(Based on 2 full and 7 partial tracts) A) FHA, FSA/RHS & VA B) Conventional C) Refinancings D) Home Improvement Loans E) Loans on Dwellings For 5+ Families F) Non-occupant Loans on G) Loans On Manufactured Number Average Value Number Average Value Number Average Value Number Average Value Number Average Value Number Average Value Number Average Value
LOANS ORIGINATED 49 $407,022 171 $375,853 707 $362,768 25 $259,382 1 $13,502,030 35 $250,373 3 $62,037 APPLICATIONS APPROVED, NOT ACCEPTED 7 $410,106 25 $357,261 85 $362,698 11 $226,110 0 $0 6 $355,643 3 $90,917 APPLICATIONS DENIED 15 $439,613 37 $430,727 186 $422,788 14 $129,120 0 $0 21 $224,040 4 $67,285 APPLICATIONS WITHDRAWN 5 $377,634 29 $394,186 136 $394,006 6 $259,253 0 $0 12 $212,176 0 $0 FILES CLOSED FOR INCOMPLETENESS 2 $333,510 11 $498,058 39 $402,284 3 $335,810 0 $0 4 $190,135 1 $44,990
Aggregated Statistics For Year 2008(Based on 2 full and 7 partial tracts) A) FHA, FSA/RHS & VA B) Conventional C) Refinancings D) Home Improvement Loans F) Non-occupant Loans on G) Loans On Manufactured Number Average Value Number Average Value Number Average Value Number Average Value Number Average Value Number Average Value
LOANS ORIGINATED 23 $348,959 202 $356,951 257 $435,740 28 $185,491 41 $284,940 1 $70,700 APPLICATIONS APPROVED, NOT ACCEPTED 3 $315,027 27 $404,921 71 $349,980 4 $37,782 7 $209,963 2 $67,880 APPLICATIONS DENIED 3 $386,863 52 $393,560 198 $477,595 21 $274,512 22 $317,463 7 $81,866 APPLICATIONS WITHDRAWN 7 $371,759 45 $366,814 90 $446,816 6 $438,865 9 $260,884 0 $0 FILES CLOSED FOR INCOMPLETENESS 1 $572,940 8 $374,436 30 $604,304 2 $295,790 1 $157,870 0 $0
Aggregated Statistics For Year 2007(Based on 2 full and 7 partial tracts) A) FHA, FSA/RHS & VA B) Conventional C) Refinancings D) Home Improvement Loans F) Non-occupant Loans on G) Loans On Manufactured Number Average Value Number Average Value Number Average Value Number Average Value Number Average Value Number Average Value
LOANS ORIGINATED 1 $136,580 321 $427,556 592 $497,848 65 $337,338 69 $323,663 4 $85,005 APPLICATIONS APPROVED, NOT ACCEPTED 0 $0 53 $458,475 124 $491,298 8 $284,680 8 $238,344 5 $92,214 APPLICATIONS DENIED 0 $0 110 $466,042 295 $550,038 34 $195,932 30 $388,877 5 $82,226 APPLICATIONS WITHDRAWN 0 $0 33 $332,522 117 $472,271 14 $237,464 8 $508,088 0 $0 FILES CLOSED FOR INCOMPLETENESS 0 $0 7 $629,751 57 $491,466 2 $465,710 3 $486,467 0 $0
Aggregated Statistics For Year 2006(Based on 2 full and 7 partial tracts) B) Conventional C) Refinancings D) Home Improvement Loans E) Loans on Dwellings For 5+ Families F) Non-occupant Loans on G) Loans On Manufactured Number Average Value Number Average Value Number Average Value Number Average Value Number Average Value Number Average Value
LOANS ORIGINATED 477 $435,302 827 $497,405 100 $370,013 2 $10,540,500 104 $321,488 4 $193,470 APPLICATIONS APPROVED, NOT ACCEPTED 73 $390,791 147 $453,963 19 $340,074 0 $0 22 $281,843 7 $84,431 APPLICATIONS DENIED 143 $411,206 284 $480,525 43 $407,523 0 $0 33 $312,265 9 $77,882 APPLICATIONS WITHDRAWN 82 $481,109 207 $407,672 18 $451,341 0 $0 22 $329,449 0 $0 FILES CLOSED FOR INCOMPLETENESS 22 $360,982 66 $418,942 5 $300,356 0 $0 6 $247,508 0 $0
Aggregated Statistics For Year 2005(Based on 2 full and 7 partial tracts) B) Conventional C) Refinancings D) Home Improvement Loans F) Non-occupant Loans on G) Loans On Manufactured Number Average Value Number Average Value Number Average Value Number Average Value Number Average Value
LOANS ORIGINATED 668 $426,337 991 $467,241 107 $328,781 115 $317,551 10 $116,816 APPLICATIONS APPROVED, NOT ACCEPTED 133 $384,738 121 $416,871 16 $225,962 17 $345,559 9 $89,277 APPLICATIONS DENIED 162 $394,965 261 $479,381 50 $192,742 26 $285,384 12 $114,627 APPLICATIONS WITHDRAWN 103 $442,975 235 $401,434 27 $187,995 18 $439,689 1 $184,800 FILES CLOSED FOR INCOMPLETENESS 28 $422,750 93 $427,178 3 $109,583 8 $427,036 1 $109,180
Aggregated Statistics For Year 2004(Based on 2 full and 7 partial tracts) A) FHA, FSA/RHS & VA B) Conventional C) Refinancings D) Home Improvement Loans F) Non-occupant Loans on G) Loans On Manufactured Number Average Value Number Average Value Number Average Value Number Average Value Number Average Value Number Average Value
LOANS ORIGINATED 1 $236,620 621 $436,648 1,407 $384,472 130 $273,348 122 $278,015 7 $154,110 APPLICATIONS APPROVED, NOT ACCEPTED 0 $0 132 $501,731 224 $344,484 17 $240,288 19 $272,937 4 $117,232 APPLICATIONS DENIED 0 $0 148 $461,574 326 $380,058 49 $168,775 33 $279,409 9 $114,830 APPLICATIONS WITHDRAWN 0 $0 93 $340,737 269 $333,011 32 $181,067 13 $196,928 1 $126,490 FILES CLOSED FOR INCOMPLETENESS 0 $0 15 $608,041 62 $380,781 7 $169,411 6 $289,180 0 $0
Aggregated Statistics For Year 2003(Based on 2 full and 7 partial tracts) A) FHA, FSA/RHS & VA B) Conventional C) Refinancings D) Home Improvement Loans F) Non-occupant Loans on Number Average Value Number Average Value Number Average Value Number Average Value Number Average Value
LOANS ORIGINATED 12 $220,107 654 $352,879 2,996 $307,136 41 $167,981 152 $199,362 APPLICATIONS APPROVED, NOT ACCEPTED 0 $0 98 $377,350 341 $282,190 12 $121,671 25 $223,542 APPLICATIONS DENIED 2 $192,610 106 $405,458 488 $330,583 27 $71,770 32 $249,605 APPLICATIONS WITHDRAWN 0 $0 79 $345,674 401 $289,309 13 $80,865 21 $204,878 FILES CLOSED FOR INCOMPLETENESS 1 $202,430 16 $543,460 116 $313,197 6 $108,370 11 $179,454
Aggregated Statistics For Year 2002(Based on 1 full and 4 partial tracts) A) FHA, FSA/RHS & VA B) Conventional C) Refinancings D) Home Improvement Loans F) Non-occupant Loans on Number Average Value Number Average Value Number Average Value Number Average Value Number Average Value
LOANS ORIGINATED 25 $199,849 320 $192,316 844 $208,019 19 $62,958 72 $156,763 APPLICATIONS APPROVED, NOT ACCEPTED 2 $146,610 50 $220,695 148 $207,149 6 $47,505 7 $168,914 APPLICATIONS DENIED 3 $205,323 67 $175,623 150 $199,155 18 $43,708 10 $181,271 APPLICATIONS WITHDRAWN 1 $269,250 35 $203,902 128 $222,684 7 $55,370 8 $164,180 FILES CLOSED FOR INCOMPLETENESS 1 $241,860 12 $216,247 49 $236,644 0 $0 3 $166,830
Aggregated Statistics For Year 2001(Based on 1 full and 4 partial tracts) A) FHA, FSA/RHS & VA B) Conventional C) Refinancings D) Home Improvement Loans F) Non-occupant Loans on Number Average Value Number Average Value Number Average Value Number Average Value Number Average Value
LOANS ORIGINATED 38 $183,445 260 $175,988 646 $184,858 18 $33,407 54 $125,828 APPLICATIONS APPROVED, NOT ACCEPTED 1 $191,220 47 $162,802 98 $171,436 6 $53,450 8 $146,480 APPLICATIONS DENIED 2 $189,350 43 $137,891 154 $162,199 25 $31,410 10 $160,680 APPLICATIONS WITHDRAWN 4 $220,290 25 $162,337 132 $186,579 7 $23,664 6 $145,718 FILES CLOSED FOR INCOMPLETENESS 0 $0 8 $197,484 25 $166,935 0 $0 1 $100,560
Aggregated Statistics For Year 2000(Based on 1 full and 4 partial tracts) A) FHA, FSA/RHS & VA B) Conventional C) Refinancings D) Home Improvement Loans F) Non-occupant Loans on Number Average Value Number Average Value Number Average Value Number Average Value Number Average Value
LOANS ORIGINATED 36 $153,674 279 $148,934 139 $157,616 32 $35,300 40 $111,348 APPLICATIONS APPROVED, NOT ACCEPTED 3 $155,170 37 $153,334 37 $118,412 10 $25,207 5 $181,156 APPLICATIONS DENIED 4 $144,390 52 $141,671 70 $138,326 23 $44,888 5 $136,006 APPLICATIONS WITHDRAWN 4 $165,215 33 $139,888 31 $93,383 2 $40,330 3 $66,423 FILES CLOSED FOR INCOMPLETENESS 1 $127,490 12 $188,521 16 $188,963 0 $0 0 $0
Aggregated Statistics For Year 1999(Based on 1 full and 7 partial tracts) A) FHA, FSA/RHS & VA B) Conventional C) Refinancings D) Home Improvement Loans E) Loans on Dwellings For 5+ Families F) Non-occupant Loans on Number Average Value Number Average Value Number Average Value Number Average Value Number Average Value Number Average Value
LOANS ORIGINATED 105 $143,458 742 $211,970 853 $212,318 73 $39,976 4 $138,838 70 $128,950 APPLICATIONS APPROVED, NOT ACCEPTED 3 $240,883 73 $236,456 156 $208,745 25 $42,061 0 $0 12 $129,086 APPLICATIONS DENIED 14 $141,676 140 $206,371 244 $190,797 36 $44,201 0 $0 14 $151,832 APPLICATIONS WITHDRAWN 9 $150,446 106 $201,649 167 $184,244 7 $55,779 1 $54,560 15 $172,781 FILES CLOSED FOR INCOMPLETENESS 4 $117,018 35 $196,486 67 $209,371 2 $71,475 0 $0 3 $136,460
Detailed mortgage data for all 9 tracts in Laguna Hills, CA
Private Mortgage Insurance Companies Aggregated Statistics For Year 2009(Based on 2 full and 6 partial tracts) A) Conventional B) Refinancings Number Average Value Number Average Value
LOANS ORIGINATED 10 $394,484 3 $468,663 APPLICATIONS APPROVED, NOT ACCEPTED 3 $167,507 0 $0 APPLICATIONS DENIED 4 $577,665 1 $315,930 APPLICATIONS WITHDRAWN 0 $0 0 $0 FILES CLOSED FOR INCOMPLETENESS 1 $405,000 0 $0
Aggregated Statistics For Year 2008(Based on 2 full and 5 partial tracts) A) Conventional B) Refinancings C) Non-occupant Loans on Number Average Value Number Average Value Number Average Value
LOANS ORIGINATED 32 $317,734 3 $373,427 2 $208,475 APPLICATIONS APPROVED, NOT ACCEPTED 15 $291,145 6 $486,960 1 $211,910 APPLICATIONS DENIED 9 $412,072 1 $247,760 1 $310,560 APPLICATIONS WITHDRAWN 2 $188,055 0 $0 0 $0 FILES CLOSED FOR INCOMPLETENESS 0 $0 0 $0 0 $0
Aggregated Statistics For Year 2007(Based on 2 full and 5 partial tracts) A) Conventional B) Refinancings C) Non-occupant Loans on Number Average Value Number Average Value Number Average Value
LOANS ORIGINATED 24 $238,360 9 $389,474 3 $228,627 APPLICATIONS APPROVED, NOT ACCEPTED 3 $336,743 2 $360,560 1 $150,870 APPLICATIONS DENIED 0 $0 0 $0 0 $0 APPLICATIONS WITHDRAWN 0 $0 0 $0 0 $0 FILES CLOSED FOR INCOMPLETENESS 0 $0 0 $0 0 $0
Aggregated Statistics For Year 2006(Based on 2 full and 6 partial tracts) A) Conventional B) Refinancings C) Non-occupant Loans on Number Average Value Number Average Value Number Average Value
LOANS ORIGINATED 17 $293,616 5 $566,136 1 $166,980 APPLICATIONS APPROVED, NOT ACCEPTED 2 $287,210 2 $553,510 0 $0 APPLICATIONS DENIED 0 $0 1 $789,000 0 $0 APPLICATIONS WITHDRAWN 0 $0 1 $643,060 0 $0 FILES CLOSED FOR INCOMPLETENESS 0 $0 0 $0 0 $0
Aggregated Statistics For Year 2005(Based on 2 full and 6 partial tracts) A) Conventional B) Refinancings C) Non-occupant Loans on Number Average Value Number Average Value Number Average Value
LOANS ORIGINATED 14 $258,470 5 $422,728 2 $163,705 APPLICATIONS APPROVED, NOT ACCEPTED 5 $257,742 1 $481,280 0 $0 APPLICATIONS DENIED 0 $0 1 $415,000 0 $0 APPLICATIONS WITHDRAWN 1 $101,110 1 $401,000 1 $101,110 FILES CLOSED FOR INCOMPLETENESS 0 $0 0 $0 0 $0
Aggregated Statistics For Year 2004(Based on 2 full and 6 partial tracts) A) Conventional B) Refinancings C) Non-occupant Loans on Number Average Value Number Average Value Number Average Value
LOANS ORIGINATED 21 $262,539 4 $474,120 1 $111,530 APPLICATIONS APPROVED, NOT ACCEPTED 3 $375,980 5 $414,794 1 $109,840 APPLICATIONS DENIED 0 $0 0 $0 0 $0 APPLICATIONS WITHDRAWN 2 $184,985 0 $0 0 $0 FILES CLOSED FOR INCOMPLETENESS 1 $280,670 0 $0 0 $0
Aggregated Statistics For Year 2003(Based on 2 full and 7 partial tracts) A) Conventional B) Refinancings C) Non-occupant Loans on Number Average Value Number Average Value Number Average Value
LOANS ORIGINATED 43 $262,113 16 $247,861 3 $198,000 APPLICATIONS APPROVED, NOT ACCEPTED 10 $318,531 19 $281,009 2 $248,625 APPLICATIONS DENIED 0 $0 0 $0 0 $0 APPLICATIONS WITHDRAWN 3 $277,543 2 $396,190 1 $106,110 FILES CLOSED FOR INCOMPLETENESS 0 $0 0 $0 0 $0
Aggregated Statistics For Year 2002(Based on 1 full and 4 partial tracts) A) Conventional B) Refinancings C) Non-occupant Loans on Number Average Value Number Average Value Number Average Value
LOANS ORIGINATED 40 $222,087 16 $273,500 3 $125,760 APPLICATIONS APPROVED, NOT ACCEPTED 7 $199,001 9 $243,184 0 $0 APPLICATIONS DENIED 1 $216,260 1 $121,260 0 $0 APPLICATIONS WITHDRAWN 1 $186,730 3 $198,797 0 $0 FILES CLOSED FOR INCOMPLETENESS 0 $0 1 $317,250 0 $0
Aggregated Statistics For Year 2001(Based on 1 full and 4 partial tracts) A) Conventional B) Refinancings C) Non-occupant Loans on Number Average Value Number Average Value Number Average Value
LOANS ORIGINATED 36 $200,836 27 $239,792 2 $105,925 APPLICATIONS APPROVED, NOT ACCEPTED 8 $242,449 3 $235,193 3 $184,317 APPLICATIONS DENIED 1 $163,240 1 $166,680 0 $0 APPLICATIONS WITHDRAWN 2 $179,150 1 $281,430 0 $0 FILES CLOSED FOR INCOMPLETENESS 0 $0 0 $0 0 $0
Aggregated Statistics For Year 2000(Based on 1 full and 4 partial tracts) A) Conventional B) Refinancings C) Non-occupant Loans on Number Average Value Number Average Value Number Average Value
LOANS ORIGINATED 48 $221,706 9 $189,689 4 $161,460 APPLICATIONS APPROVED, NOT ACCEPTED 14 $217,810 1 $123,220 1 $128,150 APPLICATIONS DENIED 5 $193,060 1 $112,840 0 $0 APPLICATIONS WITHDRAWN 1 $85,180 0 $0 0 $0 FILES CLOSED FOR INCOMPLETENESS 0 $0 0 $0 0 $0
Aggregated Statistics For Year 1999(Based on 1 full and 7 partial tracts) A) Conventional B) Refinancings C) Non-occupant Loans on Number Average Value Number Average Value Number Average Value
LOANS ORIGINATED 118 $211,981 45 $185,577 2 $105,465 APPLICATIONS APPROVED, NOT ACCEPTED 23 $218,246 14 $199,994 1 $187,550 APPLICATIONS DENIED 10 $200,836 3 $163,093 1 $122,230 APPLICATIONS WITHDRAWN 4 $217,888 4 $185,782 0 $0 FILES CLOSED FOR INCOMPLETENESS 1 $385,800 0 $0 0 $0
Most common first names in Laguna Hills, CA among deceased individuals Name Count Lived (average)
John 581 80.9 years William 530 81.1 years Mary 479 83.6 years Robert 466 79.1 years Helen 458 83.7 years Dorothy 382 83.1 years Ruth 355 83.8 years Charles 348 81.4 years George 316 82.0 years Margaret 304 84.1 years
Most common last names in Laguna Hills, CA among deceased individuals Last name Count Lived (average)
Smith 230 83.6 years Johnson 145 81.8 years Miller 138 82.4 years Brown 130 82.1 years Anderson 119 83.0 years Jones 102 82.0 years Davis 91 82.2 years Williams 73 81.1 years Wilson 65 81.8 years Nelson 64 83.9 years
Laguna Hills compared to California state average:
Unemployed percentage significantly below state average. Black race population percentage significantly below state average. Hispanic race population percentage below state average. Median age significantly above state average. Renting percentage below state average. Length of stay since moving in significantly above state average. Percentage of population with a bachelor's degree or higher above state average. Laguna Hills on our top lists :
#52 on the list of "Top 101 cities with the most residents born in Iran (population 500+)"
#88 on the list of "Top 101 cities with the highest cost per building permit(population 5,000+)"
#4 on the list of "Top 101 counties with the highest total withdrawal of fresh water for public supply"
#5 on the list of "Top 101 counties with the most Catholic adherents"
#6 on the list of "Top 101 counties with the highest ground withdrawal of fresh water for public supply"
#7 on the list of "Top 101 counties with the most Evangelical Protestant adherents"
#8 on the list of "Top 101 counties with the highest Particulate Matter (PM2.5 ) Annual air pollution readings in 2012 (µg/m3 )"
Top Patent Applicants
Scott Pool (56)
Scott M. Whitcup (51)
Afshin Momtaz (42)
Walter M. Weber (41)
Mehdi M. Jafari (34)
Brima B. Ibrahim (30)
Robert T. Lyons (29)
Christopher M. Varga (28)
Ieon C. Chen (25)
Nicholas J. Witchey (24)
Total of 1388 patent applications in 2008-2024.


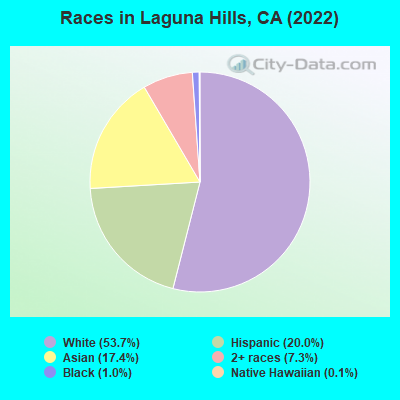
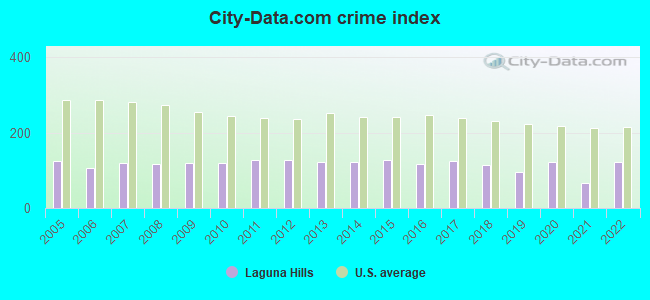
 Recent articles from our blog. Our writers, many of them Ph.D. graduates or candidates, create easy-to-read articles on a wide variety of topics.

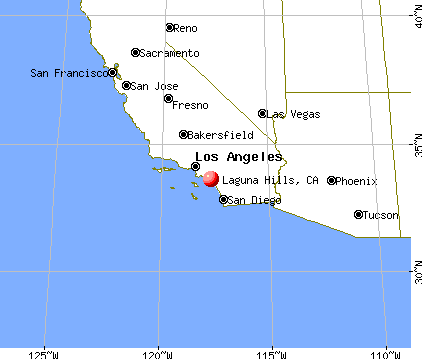
 (2.7 miles
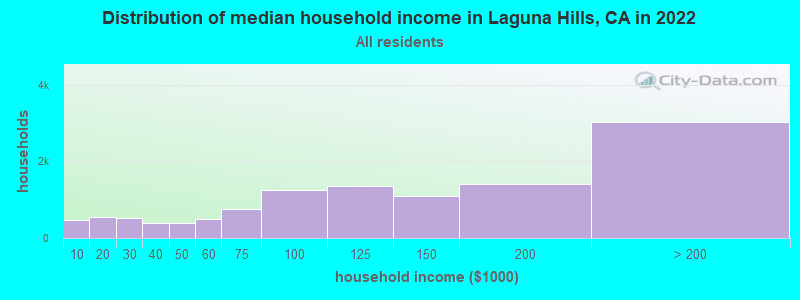
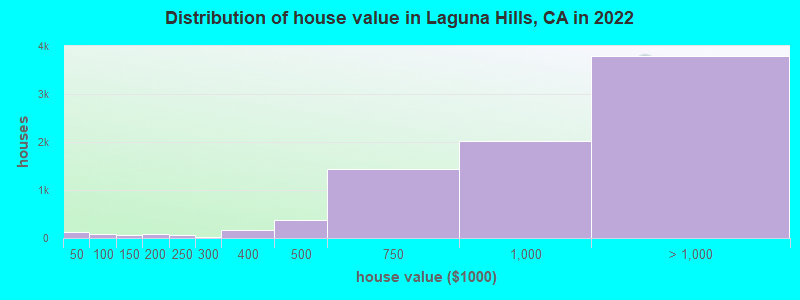
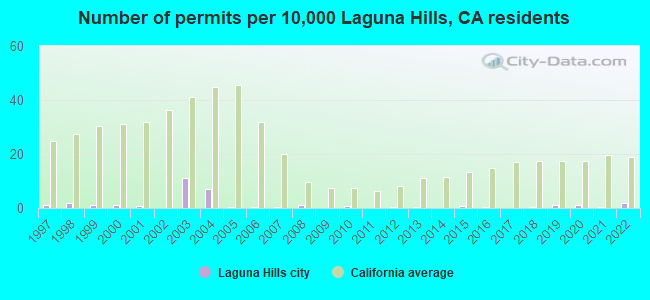
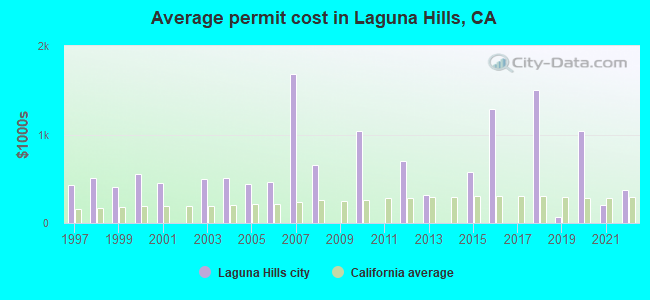
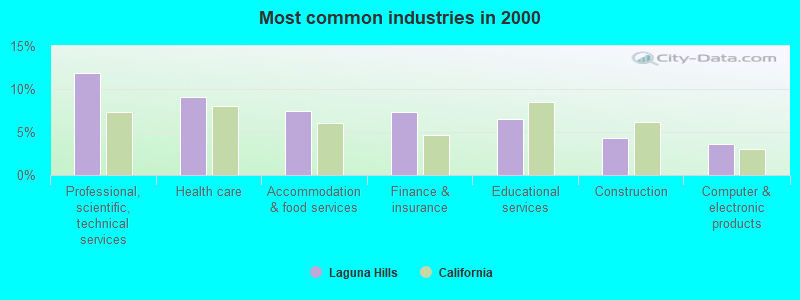
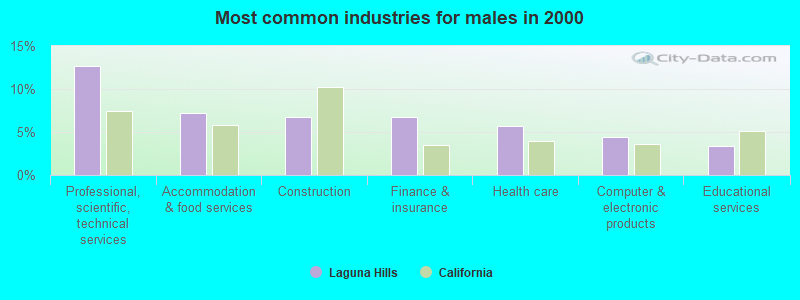
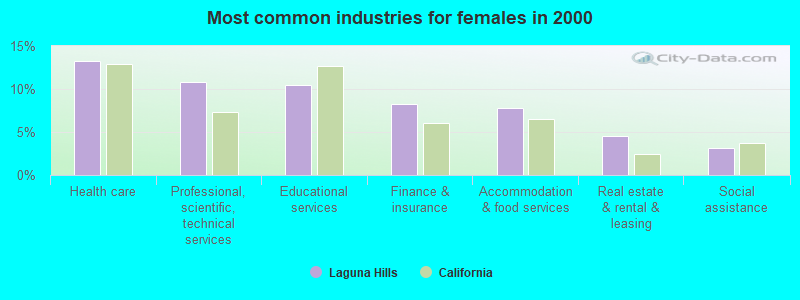
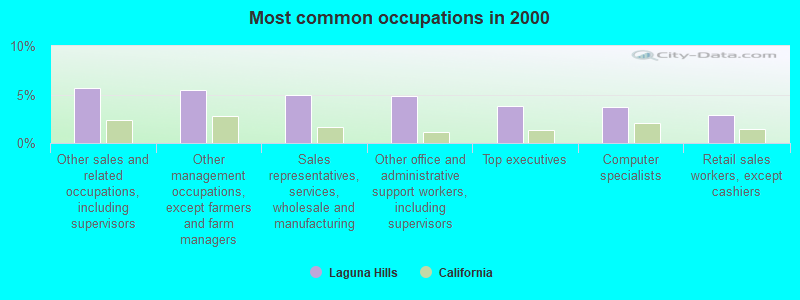
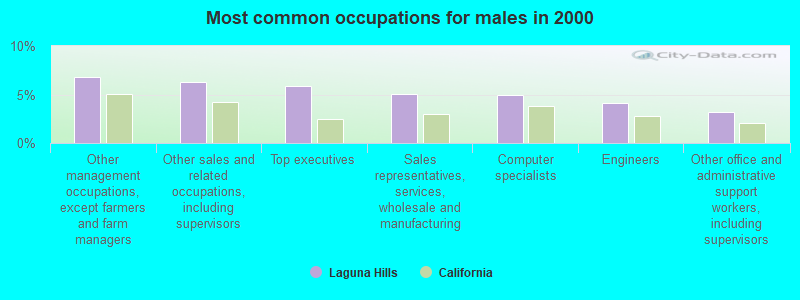
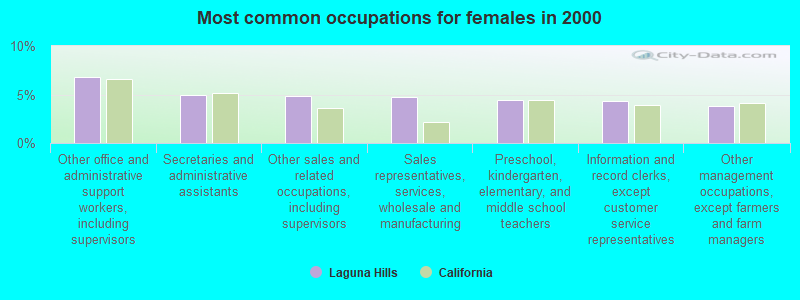
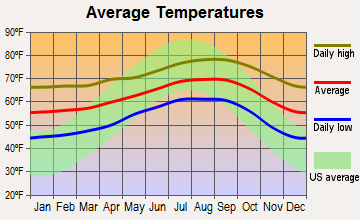
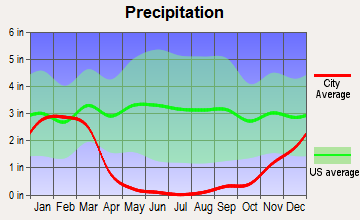
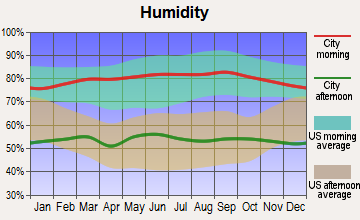
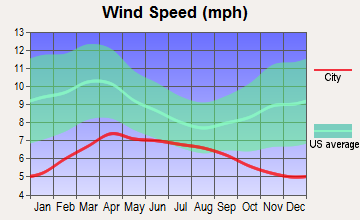
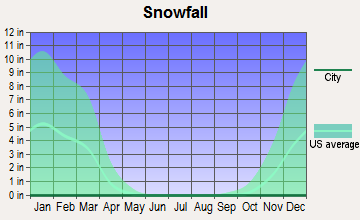
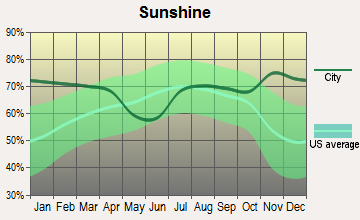
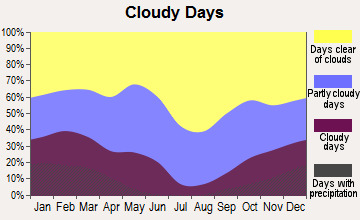
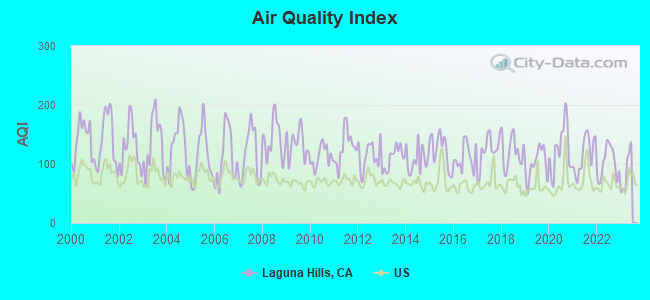
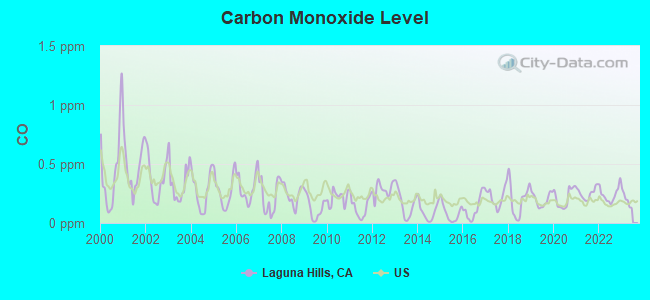
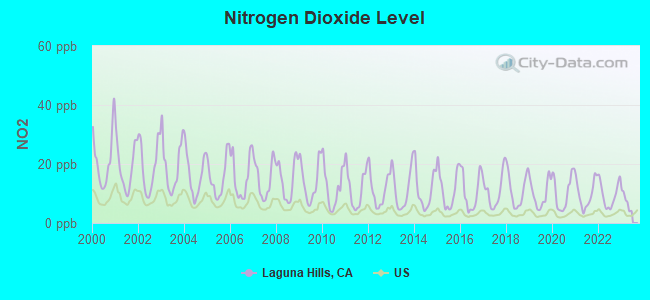
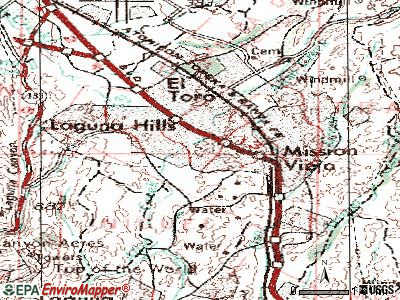
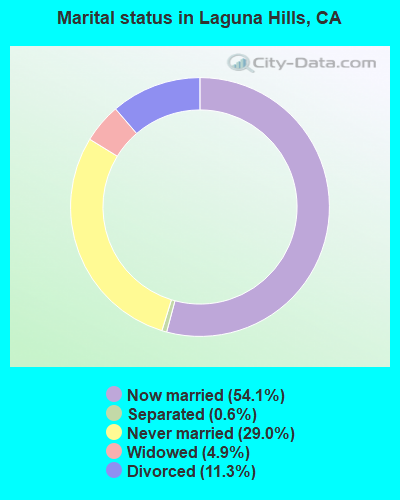
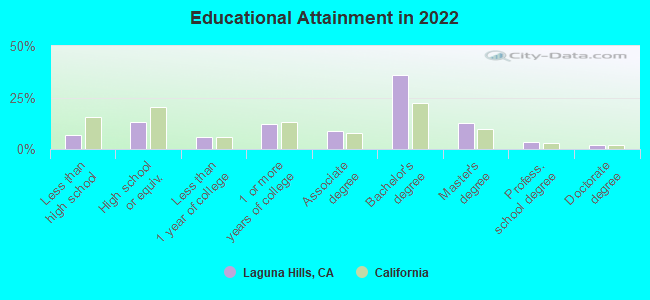
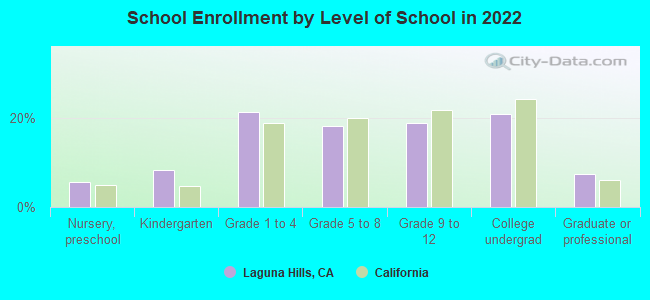
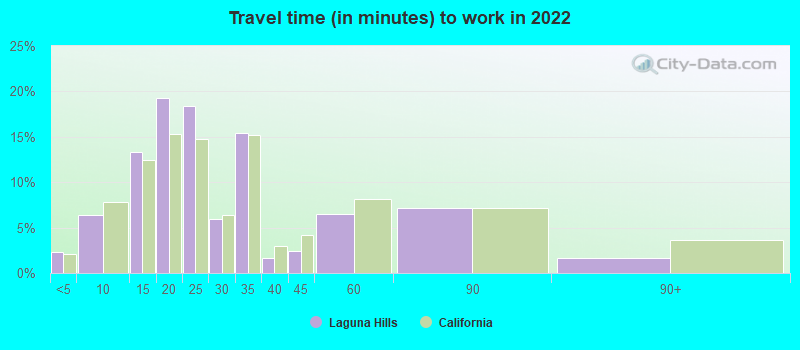
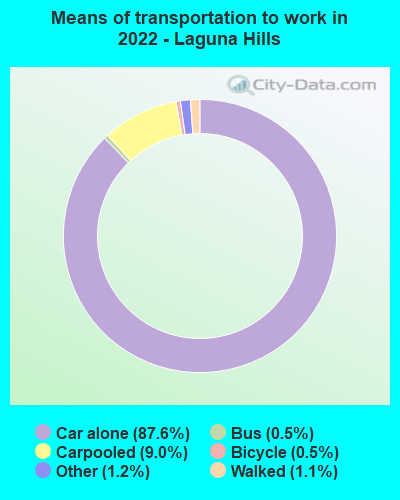


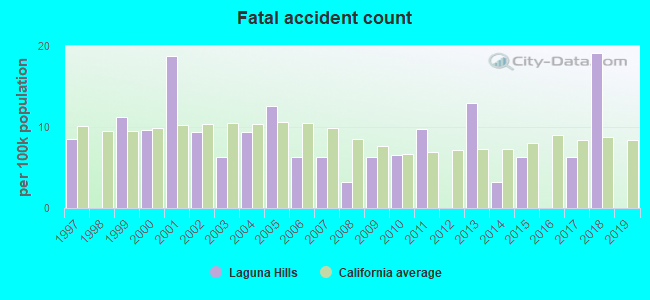
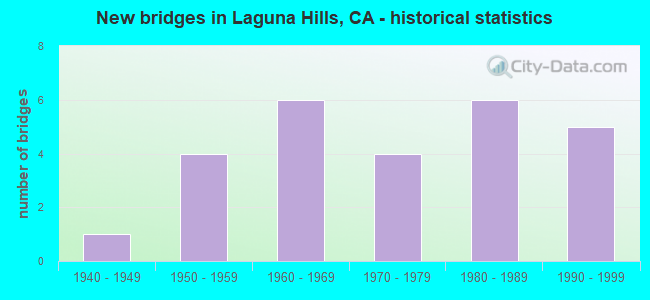
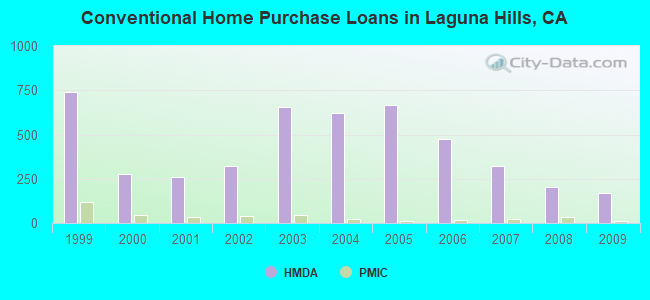
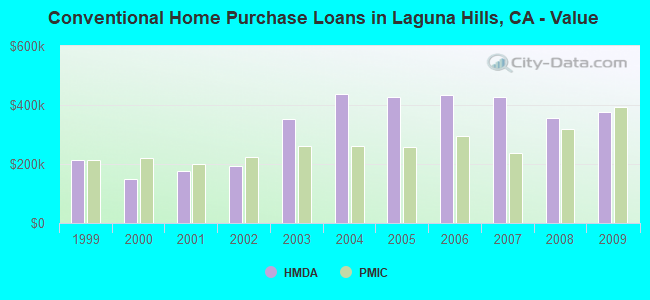
 Based on the data from the years 2005 - 2018 the average number of fires per year is 44. The highest number of fires - 57 took place in 2014, and the least - 24 in 2006. The data has a decreasing trend.
 When looking into fire subcategories, the most reports belonged to: Outside Fires (41.5%), and Mobile Property/Vehicle Fires (27.2%).