Laguna Niguel, California Submit your own pictures of this city and show them to the world
OSM Map
General Map
Google Map
MSN Map
OSM Map
General Map
Google Map
MSN Map
OSM Map
General Map
Google Map
MSN Map
OSM Map
General Map
Google Map
MSN Map
Please wait while loading the map...
Population in 2022: 63,742 (100% urban, 0% rural). Population change since 2000: +3.0%Males: 30,802 Females: 32,940
March 2022 cost of living index in Laguna Niguel: 89.1 (less than average, U.S. average is 100) Percentage of residents living in poverty in 2022: 7.4%for White Non-Hispanic residents , 3.5% for Black residents , 16.1% for Hispanic or Latino residents , 8.2% for American Indian residents , 23.9% for other race residents , 12.6% for two or more races residents )
Profiles of local businesses
Business Search - 14 Million verified businesses
Data:
Median household income ($)
Median household income (% change since 2000)
Household income diversity
Ratio of average income to average house value (%)
Ratio of average income to average rent
Median household income ($) - White
Median household income ($) - Black or African American
Median household income ($) - Asian
Median household income ($) - Hispanic or Latino
Median household income ($) - American Indian and Alaska Native
Median household income ($) - Multirace
Median household income ($) - Other Race
Median household income for houses/condos with a mortgage ($)
Median household income for apartments without a mortgage ($)
Races - White alone (%)
Races - White alone (% change since 2000)
Races - Black alone (%)
Races - Black alone (% change since 2000)
Races - American Indian alone (%)
Races - American Indian alone (% change since 2000)
Races - Asian alone (%)
Races - Asian alone (% change since 2000)
Races - Hispanic (%)
Races - Hispanic (% change since 2000)
Races - Native Hawaiian and Other Pacific Islander alone (%)
Races - Native Hawaiian and Other Pacific Islander alone (% change since 2000)
Races - Two or more races (%)
Races - Two or more races (% change since 2000)
Races - Other race alone (%)
Races - Other race alone (% change since 2000)
Racial diversity
Unemployment (%)
Unemployment (% change since 2000)
Unemployment (%) - White
Unemployment (%) - Black or African American
Unemployment (%) - Asian
Unemployment (%) - Hispanic or Latino
Unemployment (%) - American Indian and Alaska Native
Unemployment (%) - Multirace
Unemployment (%) - Other Race
Population density (people per square mile)
Population - Males (%)
Population - Females (%)
Population - Males (%) - White
Population - Males (%) - Black or African American
Population - Males (%) - Asian
Population - Males (%) - Hispanic or Latino
Population - Males (%) - American Indian and Alaska Native
Population - Males (%) - Multirace
Population - Males (%) - Other Race
Population - Females (%) - White
Population - Females (%) - Black or African American
Population - Females (%) - Asian
Population - Females (%) - Hispanic or Latino
Population - Females (%) - American Indian and Alaska Native
Population - Females (%) - Multirace
Population - Females (%) - Other Race
Coronavirus confirmed cases (Apr 28, 2024)
Deaths caused by coronavirus (Apr 28, 2024)
Coronavirus confirmed cases (per 100k population) (Apr 28, 2024)
Deaths caused by coronavirus (per 100k population) (Apr 28, 2024)
Daily increase in number of cases (Apr 28, 2024)
Weekly increase in number of cases (Apr 28, 2024)
Cases doubled (in days) (Apr 28, 2024)
Hospitalized patients (Apr 18, 2022)
Negative test results (Apr 18, 2022)
Total test results (Apr 18, 2022)
COVID Vaccine doses distributed (per 100k population) (Sep 19, 2023)
COVID Vaccine doses administered (per 100k population) (Sep 19, 2023)
COVID Vaccine doses distributed (Sep 19, 2023)
COVID Vaccine doses administered (Sep 19, 2023)
Likely homosexual households (%)
Likely homosexual households (% change since 2000)
Likely homosexual households - Lesbian couples (%)
Likely homosexual households - Lesbian couples (% change since 2000)
Likely homosexual households - Gay men (%)
Likely homosexual households - Gay men (% change since 2000)
Cost of living index
Median gross rent ($)
Median contract rent ($)
Median monthly housing costs ($)
Median house or condo value ($)
Median house or condo value ($ change since 2000)
Mean house or condo value by units in structure - 1, detached ($)
Mean house or condo value by units in structure - 1, attached ($)
Mean house or condo value by units in structure - 2 ($)
Mean house or condo value by units in structure by units in structure - 3 or 4 ($)
Mean house or condo value by units in structure - 5 or more ($)
Mean house or condo value by units in structure - Boat, RV, van, etc. ($)
Mean house or condo value by units in structure - Mobile home ($)
Median house or condo value ($) - White
Median house or condo value ($) - Black or African American
Median house or condo value ($) - Asian
Median house or condo value ($) - Hispanic or Latino
Median house or condo value ($) - American Indian and Alaska Native
Median house or condo value ($) - Multirace
Median house or condo value ($) - Other Race
Median resident age
Resident age diversity
Median resident age - Males
Median resident age - Females
Median resident age - White
Median resident age - Black or African American
Median resident age - Asian
Median resident age - Hispanic or Latino
Median resident age - American Indian and Alaska Native
Median resident age - Multirace
Median resident age - Other Race
Median resident age - Males - White
Median resident age - Males - Black or African American
Median resident age - Males - Asian
Median resident age - Males - Hispanic or Latino
Median resident age - Males - American Indian and Alaska Native
Median resident age - Males - Multirace
Median resident age - Males - Other Race
Median resident age - Females - White
Median resident age - Females - Black or African American
Median resident age - Females - Asian
Median resident age - Females - Hispanic or Latino
Median resident age - Females - American Indian and Alaska Native
Median resident age - Females - Multirace
Median resident age - Females - Other Race
Commute - mean travel time to work (minutes)
Travel time to work - Less than 5 minutes (%)
Travel time to work - Less than 5 minutes (% change since 2000)
Travel time to work - 5 to 9 minutes (%)
Travel time to work - 5 to 9 minutes (% change since 2000)
Travel time to work - 10 to 19 minutes (%)
Travel time to work - 10 to 19 minutes (% change since 2000)
Travel time to work - 20 to 29 minutes (%)
Travel time to work - 20 to 29 minutes (% change since 2000)
Travel time to work - 30 to 39 minutes (%)
Travel time to work - 30 to 39 minutes (% change since 2000)
Travel time to work - 40 to 59 minutes (%)
Travel time to work - 40 to 59 minutes (% change since 2000)
Travel time to work - 60 to 89 minutes (%)
Travel time to work - 60 to 89 minutes (% change since 2000)
Travel time to work - 90 or more minutes (%)
Travel time to work - 90 or more minutes (% change since 2000)
Marital status - Never married (%)
Marital status - Now married (%)
Marital status - Separated (%)
Marital status - Widowed (%)
Marital status - Divorced (%)
Median family income ($)
Median family income (% change since 2000)
Median non-family income ($)
Median non-family income (% change since 2000)
Median per capita income ($)
Median per capita income (% change since 2000)
Median family income ($) - White
Median family income ($) - Black or African American
Median family income ($) - Asian
Median family income ($) - Hispanic or Latino
Median family income ($) - American Indian and Alaska Native
Median family income ($) - Multirace
Median family income ($) - Other Race
Median year house/condo built
Median year apartment built
Year house built - Built 2005 or later (%)
Year house built - Built 2000 to 2004 (%)
Year house built - Built 1990 to 1999 (%)
Year house built - Built 1980 to 1989 (%)
Year house built - Built 1970 to 1979 (%)
Year house built - Built 1960 to 1969 (%)
Year house built - Built 1950 to 1959 (%)
Year house built - Built 1940 to 1949 (%)
Year house built - Built 1939 or earlier (%)
Average household size
Household density (households per square mile)
Average household size - White
Average household size - Black or African American
Average household size - Asian
Average household size - Hispanic or Latino
Average household size - American Indian and Alaska Native
Average household size - Multirace
Average household size - Other Race
Occupied housing units (%)
Vacant housing units (%)
Owner occupied housing units (%)
Renter occupied housing units (%)
Vacancy status - For rent (%)
Vacancy status - For sale only (%)
Vacancy status - Rented or sold, not occupied (%)
Vacancy status - For seasonal, recreational, or occasional use (%)
Vacancy status - For migrant workers (%)
Vacancy status - Other vacant (%)
Residents with income below the poverty level (%)
Residents with income below 50% of the poverty level (%)
Children below poverty level (%)
Poor families by family type - Married-couple family (%)
Poor families by family type - Male, no wife present (%)
Poor families by family type - Female, no husband present (%)
Poverty status for native-born residents (%)
Poverty status for foreign-born residents (%)
Poverty among high school graduates not in families (%)
Poverty among people who did not graduate high school not in families (%)
Residents with income below the poverty level (%) - White
Residents with income below the poverty level (%) - Black or African American
Residents with income below the poverty level (%) - Asian
Residents with income below the poverty level (%) - Hispanic or Latino
Residents with income below the poverty level (%) - American Indian and Alaska Native
Residents with income below the poverty level (%) - Multirace
Residents with income below the poverty level (%) - Other Race
Air pollution - Air Quality Index (AQI)
Air pollution - CO
Air pollution - NO2
Air pollution - SO2
Air pollution - Ozone
Air pollution - PM10
Air pollution - PM25
Air pollution - Pb
Crime - Murders per 100,000 population
Crime - Rapes per 100,000 population
Crime - Robberies per 100,000 population
Crime - Assaults per 100,000 population
Crime - Burglaries per 100,000 population
Crime - Thefts per 100,000 population
Crime - Auto thefts per 100,000 population
Crime - Arson per 100,000 population
Crime - City-data.com crime index
Crime - Violent crime index
Crime - Property crime index
Crime - Murders per 100,000 population (5 year average)
Crime - Rapes per 100,000 population (5 year average)
Crime - Robberies per 100,000 population (5 year average)
Crime - Assaults per 100,000 population (5 year average)
Crime - Burglaries per 100,000 population (5 year average)
Crime - Thefts per 100,000 population (5 year average)
Crime - Auto thefts per 100,000 population (5 year average)
Crime - Arson per 100,000 population (5 year average)
Crime - City-data.com crime index (5 year average)
Crime - Violent crime index (5 year average)
Crime - Property crime index (5 year average)
1996 Presidential Elections Results (%) - Democratic Party (Clinton)
1996 Presidential Elections Results (%) - Republican Party (Dole)
1996 Presidential Elections Results (%) - Other
2000 Presidential Elections Results (%) - Democratic Party (Gore)
2000 Presidential Elections Results (%) - Republican Party (Bush)
2000 Presidential Elections Results (%) - Other
2004 Presidential Elections Results (%) - Democratic Party (Kerry)
2004 Presidential Elections Results (%) - Republican Party (Bush)
2004 Presidential Elections Results (%) - Other
2008 Presidential Elections Results (%) - Democratic Party (Obama)
2008 Presidential Elections Results (%) - Republican Party (McCain)
2008 Presidential Elections Results (%) - Other
2012 Presidential Elections Results (%) - Democratic Party (Obama)
2012 Presidential Elections Results (%) - Republican Party (Romney)
2012 Presidential Elections Results (%) - Other
2016 Presidential Elections Results (%) - Democratic Party (Clinton)
2016 Presidential Elections Results (%) - Republican Party (Trump)
2016 Presidential Elections Results (%) - Other
2020 Presidential Elections Results (%) - Democratic Party (Biden)
2020 Presidential Elections Results (%) - Republican Party (Trump)
2020 Presidential Elections Results (%) - Other
Ancestries Reported - Arab (%)
Ancestries Reported - Czech (%)
Ancestries Reported - Danish (%)
Ancestries Reported - Dutch (%)
Ancestries Reported - English (%)
Ancestries Reported - French (%)
Ancestries Reported - French Canadian (%)
Ancestries Reported - German (%)
Ancestries Reported - Greek (%)
Ancestries Reported - Hungarian (%)
Ancestries Reported - Irish (%)
Ancestries Reported - Italian (%)
Ancestries Reported - Lithuanian (%)
Ancestries Reported - Norwegian (%)
Ancestries Reported - Polish (%)
Ancestries Reported - Portuguese (%)
Ancestries Reported - Russian (%)
Ancestries Reported - Scotch-Irish (%)
Ancestries Reported - Scottish (%)
Ancestries Reported - Slovak (%)
Ancestries Reported - Subsaharan African (%)
Ancestries Reported - Swedish (%)
Ancestries Reported - Swiss (%)
Ancestries Reported - Ukrainian (%)
Ancestries Reported - United States (%)
Ancestries Reported - Welsh (%)
Ancestries Reported - West Indian (%)
Ancestries Reported - Other (%)
Educational Attainment - No schooling completed (%)
Educational Attainment - Less than high school (%)
Educational Attainment - High school or equivalent (%)
Educational Attainment - Less than 1 year of college (%)
Educational Attainment - 1 or more years of college (%)
Educational Attainment - Associate degree (%)
Educational Attainment - Bachelor's degree (%)
Educational Attainment - Master's degree (%)
Educational Attainment - Professional school degree (%)
Educational Attainment - Doctorate degree (%)
School Enrollment - Nursery, preschool (%)
School Enrollment - Kindergarten (%)
School Enrollment - Grade 1 to 4 (%)
School Enrollment - Grade 5 to 8 (%)
School Enrollment - Grade 9 to 12 (%)
School Enrollment - College undergrad (%)
School Enrollment - Graduate or professional (%)
School Enrollment - Not enrolled in school (%)
School enrollment - Public schools (%)
School enrollment - Private schools (%)
School enrollment - Not enrolled (%)
Median number of rooms in houses and condos
Median number of rooms in apartments
Housing units lacking complete plumbing facilities (%)
Housing units lacking complete kitchen facilities (%)
Density of houses
Urban houses (%)
Rural houses (%)
Households with people 60 years and over (%)
Households with people 65 years and over (%)
Households with people 75 years and over (%)
Households with one or more nonrelatives (%)
Households with no nonrelatives (%)
Population in households (%)
Family households (%)
Nonfamily households (%)
Population in families (%)
Family households with own children (%)
Median number of bedrooms in owner occupied houses
Mean number of bedrooms in owner occupied houses
Median number of bedrooms in renter occupied houses
Mean number of bedrooms in renter occupied houses
Median number of vehichles in owner occupied houses
Mean number of vehichles in owner occupied houses
Median number of vehichles in renter occupied houses
Mean number of vehichles in renter occupied houses
Mortgage status - with mortgage (%)
Mortgage status - with second mortgage (%)
Mortgage status - with home equity loan (%)
Mortgage status - with both second mortgage and home equity loan (%)
Mortgage status - without a mortgage (%)
Average family size
Average family size - White
Average family size - Black or African American
Average family size - Asian
Average family size - Hispanic or Latino
Average family size - American Indian and Alaska Native
Average family size - Multirace
Average family size - Other Race
Geographical mobility - Same house 1 year ago (%)
Geographical mobility - Moved within same county (%)
Geographical mobility - Moved from different county within same state (%)
Geographical mobility - Moved from different state (%)
Geographical mobility - Moved from abroad (%)
Place of birth - Born in state of residence (%)
Place of birth - Born in other state (%)
Place of birth - Native, outside of US (%)
Place of birth - Foreign born (%)
Housing units in structures - 1, detached (%)
Housing units in structures - 1, attached (%)
Housing units in structures - 2 (%)
Housing units in structures - 3 or 4 (%)
Housing units in structures - 5 to 9 (%)
Housing units in structures - 10 to 19 (%)
Housing units in structures - 20 to 49 (%)
Housing units in structures - 50 or more (%)
Housing units in structures - Mobile home (%)
Housing units in structures - Boat, RV, van, etc. (%)
House/condo owner moved in on average (years ago)
Renter moved in on average (years ago)
Year householder moved into unit - Moved in 1999 to March 2000 (%)
Year householder moved into unit - Moved in 1995 to 1998 (%)
Year householder moved into unit - Moved in 1990 to 1994 (%)
Year householder moved into unit - Moved in 1980 to 1989 (%)
Year householder moved into unit - Moved in 1970 to 1979 (%)
Year householder moved into unit - Moved in 1969 or earlier (%)
Means of transportation to work - Drove car alone (%)
Means of transportation to work - Carpooled (%)
Means of transportation to work - Public transportation (%)
Means of transportation to work - Bus or trolley bus (%)
Means of transportation to work - Streetcar or trolley car (%)
Means of transportation to work - Subway or elevated (%)
Means of transportation to work - Railroad (%)
Means of transportation to work - Ferryboat (%)
Means of transportation to work - Taxicab (%)
Means of transportation to work - Motorcycle (%)
Means of transportation to work - Bicycle (%)
Means of transportation to work - Walked (%)
Means of transportation to work - Other means (%)
Working at home (%)
Industry diversity
Most Common Industries - Agriculture, forestry, fishing and hunting, and mining (%)
Most Common Industries - Agriculture, forestry, fishing and hunting (%)
Most Common Industries - Mining, quarrying, and oil and gas extraction (%)
Most Common Industries - Construction (%)
Most Common Industries - Manufacturing (%)
Most Common Industries - Wholesale trade (%)
Most Common Industries - Retail trade (%)
Most Common Industries - Transportation and warehousing, and utilities (%)
Most Common Industries - Transportation and warehousing (%)
Most Common Industries - Utilities (%)
Most Common Industries - Information (%)
Most Common Industries - Finance and insurance, and real estate and rental and leasing (%)
Most Common Industries - Finance and insurance (%)
Most Common Industries - Real estate and rental and leasing (%)
Most Common Industries - Professional, scientific, and management, and administrative and waste management services (%)
Most Common Industries - Professional, scientific, and technical services (%)
Most Common Industries - Management of companies and enterprises (%)
Most Common Industries - Administrative and support and waste management services (%)
Most Common Industries - Educational services, and health care and social assistance (%)
Most Common Industries - Educational services (%)
Most Common Industries - Health care and social assistance (%)
Most Common Industries - Arts, entertainment, and recreation, and accommodation and food services (%)
Most Common Industries - Arts, entertainment, and recreation (%)
Most Common Industries - Accommodation and food services (%)
Most Common Industries - Other services, except public administration (%)
Most Common Industries - Public administration (%)
Occupation diversity
Most Common Occupations - Management, business, science, and arts occupations (%)
Most Common Occupations - Management, business, and financial occupations (%)
Most Common Occupations - Management occupations (%)
Most Common Occupations - Business and financial operations occupations (%)
Most Common Occupations - Computer, engineering, and science occupations (%)
Most Common Occupations - Computer and mathematical occupations (%)
Most Common Occupations - Architecture and engineering occupations (%)
Most Common Occupations - Life, physical, and social science occupations (%)
Most Common Occupations - Education, legal, community service, arts, and media occupations (%)
Most Common Occupations - Community and social service occupations (%)
Most Common Occupations - Legal occupations (%)
Most Common Occupations - Education, training, and library occupations (%)
Most Common Occupations - Arts, design, entertainment, sports, and media occupations (%)
Most Common Occupations - Healthcare practitioners and technical occupations (%)
Most Common Occupations - Health diagnosing and treating practitioners and other technical occupations (%)
Most Common Occupations - Health technologists and technicians (%)
Most Common Occupations - Service occupations (%)
Most Common Occupations - Healthcare support occupations (%)
Most Common Occupations - Protective service occupations (%)
Most Common Occupations - Fire fighting and prevention, and other protective service workers including supervisors (%)
Most Common Occupations - Law enforcement workers including supervisors (%)
Most Common Occupations - Food preparation and serving related occupations (%)
Most Common Occupations - Building and grounds cleaning and maintenance occupations (%)
Most Common Occupations - Personal care and service occupations (%)
Most Common Occupations - Sales and office occupations (%)
Most Common Occupations - Sales and related occupations (%)
Most Common Occupations - Office and administrative support occupations (%)
Most Common Occupations - Natural resources, construction, and maintenance occupations (%)
Most Common Occupations - Farming, fishing, and forestry occupations (%)
Most Common Occupations - Construction and extraction occupations (%)
Most Common Occupations - Installation, maintenance, and repair occupations (%)
Most Common Occupations - Production, transportation, and material moving occupations (%)
Most Common Occupations - Production occupations (%)
Most Common Occupations - Transportation occupations (%)
Most Common Occupations - Material moving occupations (%)
People in Group quarters - Institutionalized population (%)
People in Group quarters - Correctional institutions (%)
People in Group quarters - Federal prisons and detention centers (%)
People in Group quarters - Halfway houses (%)
People in Group quarters - Local jails and other confinement facilities (including police lockups) (%)
People in Group quarters - Military disciplinary barracks (%)
People in Group quarters - State prisons (%)
People in Group quarters - Other types of correctional institutions (%)
People in Group quarters - Nursing homes (%)
People in Group quarters - Hospitals/wards, hospices, and schools for the handicapped (%)
People in Group quarters - Hospitals/wards and hospices for chronically ill (%)
People in Group quarters - Hospices or homes for chronically ill (%)
People in Group quarters - Military hospitals or wards for chronically ill (%)
People in Group quarters - Other hospitals or wards for chronically ill (%)
People in Group quarters - Hospitals or wards for drug/alcohol abuse (%)
People in Group quarters - Mental (Psychiatric) hospitals or wards (%)
People in Group quarters - Schools, hospitals, or wards for the mentally retarded (%)
People in Group quarters - Schools, hospitals, or wards for the physically handicapped (%)
People in Group quarters - Institutions for the deaf (%)
People in Group quarters - Institutions for the blind (%)
People in Group quarters - Orthopedic wards and institutions for the physically handicapped (%)
People in Group quarters - Wards in general hospitals for patients who have no usual home elsewhere (%)
People in Group quarters - Wards in military hospitals for patients who have no usual home elsewhere (%)
People in Group quarters - Juvenile institutions (%)
People in Group quarters - Long-term care (%)
People in Group quarters - Homes for abused, dependent, and neglected children (%)
People in Group quarters - Residential treatment centers for emotionally disturbed children (%)
People in Group quarters - Training schools for juvenile delinquents (%)
People in Group quarters - Short-term care, detention or diagnostic centers for delinquent children (%)
People in Group quarters - Type of juvenile institution unknown (%)
People in Group quarters - Noninstitutionalized population (%)
People in Group quarters - College dormitories (includes college quarters off campus) (%)
People in Group quarters - Military quarters (%)
People in Group quarters - On base (%)
People in Group quarters - Barracks, unaccompanied personnel housing (UPH), (Enlisted/Officer), ;and similar group living quarters for military personnel (%)
People in Group quarters - Transient quarters for temporary residents (%)
People in Group quarters - Military ships (%)
People in Group quarters - Group homes (%)
People in Group quarters - Homes or halfway houses for drug/alcohol abuse (%)
People in Group quarters - Homes for the mentally ill (%)
People in Group quarters - Homes for the mentally retarded (%)
People in Group quarters - Homes for the physically handicapped (%)
People in Group quarters - Other group homes (%)
People in Group quarters - Religious group quarters (%)
People in Group quarters - Dormitories (%)
People in Group quarters - Agriculture workers' dormitories on farms (%)
People in Group quarters - Job Corps and vocational training facilities (%)
People in Group quarters - Other workers' dormitories (%)
People in Group quarters - Crews of maritime vessels (%)
People in Group quarters - Other nonhousehold living situations (%)
People in Group quarters - Other noninstitutional group quarters (%)
Residents speaking English at home (%)
Residents speaking English at home - Born in the United States (%)
Residents speaking English at home - Native, born elsewhere (%)
Residents speaking English at home - Foreign born (%)
Residents speaking Spanish at home (%)
Residents speaking Spanish at home - Born in the United States (%)
Residents speaking Spanish at home - Native, born elsewhere (%)
Residents speaking Spanish at home - Foreign born (%)
Residents speaking other language at home (%)
Residents speaking other language at home - Born in the United States (%)
Residents speaking other language at home - Native, born elsewhere (%)
Residents speaking other language at home - Foreign born (%)
Class of Workers - Employee of private company (%)
Class of Workers - Self-employed in own incorporated business (%)
Class of Workers - Private not-for-profit wage and salary workers (%)
Class of Workers - Local government workers (%)
Class of Workers - State government workers (%)
Class of Workers - Federal government workers (%)
Class of Workers - Self-employed workers in own not incorporated business and Unpaid family workers (%)
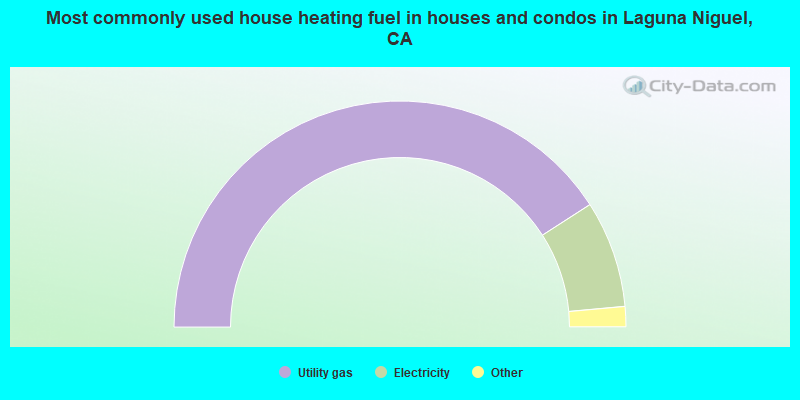
House heating fuel used in houses and condos - Utility gas (%)
House heating fuel used in houses and condos - Bottled, tank, or LP gas (%)
House heating fuel used in houses and condos - Electricity (%)
House heating fuel used in houses and condos - Fuel oil, kerosene, etc. (%)
House heating fuel used in houses and condos - Coal or coke (%)
House heating fuel used in houses and condos - Wood (%)
House heating fuel used in houses and condos - Solar energy (%)
House heating fuel used in houses and condos - Other fuel (%)
House heating fuel used in houses and condos - No fuel used (%)
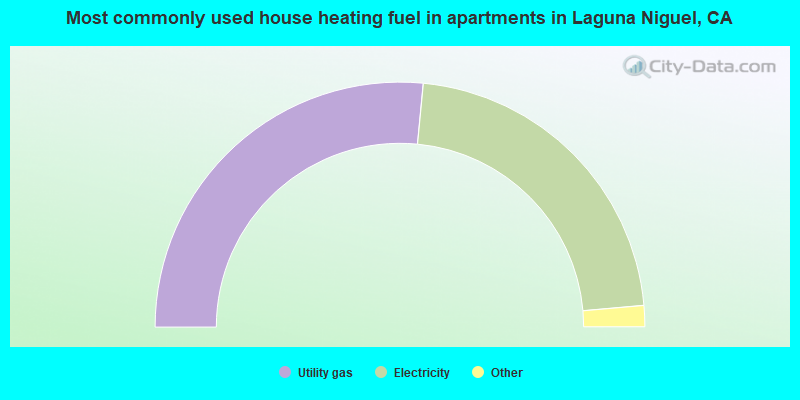
House heating fuel used in apartments - Utility gas (%)
House heating fuel used in apartments - Bottled, tank, or LP gas (%)
House heating fuel used in apartments - Electricity (%)
House heating fuel used in apartments - Fuel oil, kerosene, etc. (%)
House heating fuel used in apartments - Coal or coke (%)
House heating fuel used in apartments - Wood (%)
House heating fuel used in apartments - Solar energy (%)
House heating fuel used in apartments - Other fuel (%)
House heating fuel used in apartments - No fuel used (%)
Armed forces status - In Armed Forces (%)
Armed forces status - Civilian (%)
Armed forces status - Civilian - Veteran (%)
Armed forces status - Civilian - Nonveteran (%)
Fatal accidents locations in years 2005-2021
Fatal accidents locations in 2005
Fatal accidents locations in 2006
Fatal accidents locations in 2007
Fatal accidents locations in 2008
Fatal accidents locations in 2009
Fatal accidents locations in 2010
Fatal accidents locations in 2011
Fatal accidents locations in 2012
Fatal accidents locations in 2013
Fatal accidents locations in 2014
Fatal accidents locations in 2015
Fatal accidents locations in 2016
Fatal accidents locations in 2017
Fatal accidents locations in 2018
Fatal accidents locations in 2019
Fatal accidents locations in 2020
Fatal accidents locations in 2021
Alcohol use - People drinking some alcohol every month (%)
Alcohol use - People not drinking at all (%)
Alcohol use - Average days/month drinking alcohol
Alcohol use - Average drinks/week
Alcohol use - Average days/year people drink much
Audiometry - Average condition of hearing (%)
Audiometry - People that can hear a whisper from across a quiet room (%)
Audiometry - People that can hear normal voice from across a quiet room (%)
Audiometry - Ears ringing, roaring, buzzing (%)
Audiometry - Had a job exposure to loud noise (%)
Audiometry - Had off-work exposure to loud noise (%)
Blood Pressure & Cholesterol - Has high blood pressure (%)
Blood Pressure & Cholesterol - Checking blood pressure at home (%)
Blood Pressure & Cholesterol - Frequently checking blood cholesterol (%)
Blood Pressure & Cholesterol - Has high cholesterol level (%)
Consumer Behavior - Money monthly spent on food at supermarket/grocery store
Consumer Behavior - Money monthly spent on food at other stores
Consumer Behavior - Money monthly spent on eating out
Consumer Behavior - Money monthly spent on carryout/delivered foods
Consumer Behavior - Income spent on food at supermarket/grocery store (%)
Consumer Behavior - Income spent on food at other stores (%)
Consumer Behavior - Income spent on eating out (%)
Consumer Behavior - Income spent on carryout/delivered foods (%)
Current Health Status - General health condition (%)
Current Health Status - Blood donors (%)
Current Health Status - Has blood ever tested for HIV virus (%)
Current Health Status - Left-handed people (%)
Dermatology - People using sunscreen (%)
Diabetes - Diabetics (%)
Diabetes - Had a blood test for high blood sugar (%)
Diabetes - People taking insulin (%)
Diet Behavior & Nutrition - Diet health (%)
Diet Behavior & Nutrition - Milk product consumption (# of products/month)
Diet Behavior & Nutrition - Meals not home prepared (#/week)
Diet Behavior & Nutrition - Meals from fast food or pizza place (#/week)
Diet Behavior & Nutrition - Ready-to-eat foods (#/month)
Diet Behavior & Nutrition - Frozen meals/pizza (#/month)
Drug Use - People that ever used marijuana or hashish (%)
Drug Use - Ever used hard drugs (%)
Drug Use - Ever used any form of cocaine (%)
Drug Use - Ever used heroin (%)
Drug Use - Ever used methamphetamine (%)
Health Insurance - People covered by health insurance (%)
Kidney Conditions-Urology - Avg. # of times urinating at night
Medical Conditions - People with asthma (%)
Medical Conditions - People with anemia (%)
Medical Conditions - People with psoriasis (%)
Medical Conditions - People with overweight (%)
Medical Conditions - Elderly people having difficulties in thinking or remembering (%)
Medical Conditions - People who ever received blood transfusion (%)
Medical Conditions - People having trouble seeing even with glass/contacts (%)
Medical Conditions - People with arthritis (%)
Medical Conditions - People with gout (%)
Medical Conditions - People with congestive heart failure (%)
Medical Conditions - People with coronary heart disease (%)
Medical Conditions - People with angina pectoris (%)
Medical Conditions - People who ever had heart attack (%)
Medical Conditions - People who ever had stroke (%)
Medical Conditions - People with emphysema (%)
Medical Conditions - People with thyroid problem (%)
Medical Conditions - People with chronic bronchitis (%)
Medical Conditions - People with any liver condition (%)
Medical Conditions - People who ever had cancer or malignancy (%)
Mental Health - People who have little interest in doing things (%)
Mental Health - People feeling down, depressed, or hopeless (%)
Mental Health - People who have trouble sleeping or sleeping too much (%)
Mental Health - People feeling tired or having little energy (%)
Mental Health - People with poor appetite or overeating (%)
Mental Health - People feeling bad about themself (%)
Mental Health - People who have trouble concentrating on things (%)
Mental Health - People moving or speaking slowly or too fast (%)
Mental Health - People having thoughts they would be better off dead (%)
Oral Health - Average years since last visit a dentist
Oral Health - People embarrassed because of mouth (%)
Oral Health - People with gum disease (%)
Oral Health - General health of teeth and gums (%)
Oral Health - Average days a week using dental floss/device
Oral Health - Average days a week using mouthwash for dental problem
Oral Health - Average number of teeth
Pesticide Use - Households using pesticides to control insects (%)
Pesticide Use - Households using pesticides to kill weeds (%)
Physical Activity - People doing vigorous-intensity work activities (%)
Physical Activity - People doing moderate-intensity work activities (%)
Physical Activity - People walking or bicycling (%)
Physical Activity - People doing vigorous-intensity recreational activities (%)
Physical Activity - People doing moderate-intensity recreational activities (%)
Physical Activity - Average hours a day doing sedentary activities
Physical Activity - Average hours a day watching TV or videos
Physical Activity - Average hours a day using computer
Physical Functioning - People having limitations keeping them from working (%)
Physical Functioning - People limited in amount of work they can do (%)
Physical Functioning - People that need special equipment to walk (%)
Physical Functioning - People experiencing confusion/memory problems (%)
Physical Functioning - People requiring special healthcare equipment (%)
Prescription Medications - Average number of prescription medicines taking
Preventive Aspirin Use - Adults 40+ taking low-dose aspirin (%)
Reproductive Health - Vaginal deliveries (%)
Reproductive Health - Cesarean deliveries (%)
Reproductive Health - Deliveries resulted in a live birth (%)
Reproductive Health - Pregnancies resulted in a delivery (%)
Reproductive Health - Women breastfeeding newborns (%)
Reproductive Health - Women that had a hysterectomy (%)
Reproductive Health - Women that had both ovaries removed (%)
Reproductive Health - Women that have ever taken birth control pills (%)
Reproductive Health - Women taking birth control pills (%)
Reproductive Health - Women that have ever used Depo-Provera or injectables (%)
Reproductive Health - Women that have ever used female hormones (%)
Sexual Behavior - People 18+ that ever had sex (vaginal, anal, or oral) (%)
Sexual Behavior - Males 18+ that ever had vaginal sex with a woman (%)
Sexual Behavior - Males 18+ that ever performed oral sex on a woman (%)
Sexual Behavior - Males 18+ that ever had anal sex with a woman (%)
Sexual Behavior - Males 18+ that ever had any sex with a man (%)
Sexual Behavior - Females 18+ that ever had vaginal sex with a man (%)
Sexual Behavior - Females 18+ that ever performed oral sex on a man (%)
Sexual Behavior - Females 18+ that ever had anal sex with a man (%)
Sexual Behavior - Females 18+ that ever had any kind of sex with a woman (%)
Sexual Behavior - Average age people first had sex
Sexual Behavior - Average number of female sex partners in lifetime (males 18+)
Sexual Behavior - Average number of female vaginal sex partners in lifetime (males 18+)
Sexual Behavior - Average age people first performed oral sex on a woman (18+)
Sexual Behavior - Average number of woman performed oral sex on in lifetime (18+)
Sexual Behavior - Average number of male sex partners in lifetime (males 18+)
Sexual Behavior - Average number of male anal sex partners in lifetime (males 18+)
Sexual Behavior - Average age people first performed oral sex on a man (18+)
Sexual Behavior - Average number of male oral sex partners in lifetime (18+)
Sexual Behavior - People using protection when performing oral sex (%)
Sexual Behavior - Average number of times people have vaginal or anal sex a year
Sexual Behavior - People having sex without condom (%)
Sexual Behavior - Average number of male sex partners in lifetime (females 18+)
Sexual Behavior - Average number of male vaginal sex partners in lifetime (females 18+)
Sexual Behavior - Average number of female sex partners in lifetime (females 18+)
Sexual Behavior - Circumcised males 18+ (%)
Sleep Disorders - Average hours sleeping at night
Sleep Disorders - People that has trouble sleeping (%)
Smoking-Cigarette Use - People smoking cigarettes (%)
Taste & Smell - People 40+ having problems with smell (%)
Taste & Smell - People 40+ having problems with taste (%)
Taste & Smell - People 40+ that ever had wisdom teeth removed (%)
Taste & Smell - People 40+ that ever had tonsils teeth removed (%)
Taste & Smell - People 40+ that ever had a loss of consciousness because of a head injury (%)
Taste & Smell - People 40+ that ever had a broken nose or other serious injury to face or skull (%)
Taste & Smell - People 40+ that ever had two or more sinus infections (%)
Weight - Average height (inches)
Weight - Average weight (pounds)
Weight - Average BMI
Weight - People that are obese (%)
Weight - People that ever were obese (%)
Weight - People trying to lose weight (%)
39,482 61.9% White alone 10,296 16.1% Hispanic 7,338 11.5% Asian alone 4,277 6.7% Two or more races 1,063 1.7% Black alone 565 0.9% Other race alone 94 0.1% Native Hawaiian and Other 7 0.01% American Indian alone
According to our research of California and other state lists, there were 15 registered sex offenders living in Laguna Niguel, California as of April 28, 2024 . The ratio of all residents to sex offenders in Laguna Niguel is 4,355 to 1.The ratio of registered sex offenders to all residents in this city is much lower than the state average.
Officers per 1,000 residents here:
0.02California average:
1.98
Latest news from Laguna Niguel, CA collected exclusively by city-data.com from local newspapers, TV, and radio stations
Laguna Niguel, CA City Guides: Ancestries: Iranian (8.6%), American (6.6%), Italian (5.0%), German (5.0%), English (4.8%), Irish (3.7%).
Current Local Time:
Land area: 14.7 square miles.
Population density: 4,347 people per square mile (average).
15,237 residents are foreign born (12.0% Asia , 5.2% Latin America , 4.5% Europe ).
This city:
23.9%California:
26.5%
Median real estate property taxes paid for housing units with mortgages in 2022: $6,709 (0.6%)Median real estate property taxes paid for housing units with no mortgage in 2022: $5,844 (0.5%)
Nearest city with pop. 200,000+: South Coast, CA (1.0 miles
Nearest city with pop. 1,000,000+: Los Angeles, CA
Nearest cities:
Latitude: 33.53 N, Longitude: 117.70 W
Daytime population change due to commuting: -10,668 (-16.7%)Workers who live and work in this city: 12,567 (36.6%)
Laguna Niguel tourist attractions:
Single-family new house construction building permits:
2022: 5 buildings , average cost: $580,0002019: 5 buildings , average cost: $1,012,5002018: 4 buildings , average cost: $1,012,5002017: 2 buildings , average cost: $1,012,5002016: 1 building , cost: $1,044,9002015: 4 buildings , average cost: $1,029,6002014: 15 buildings , average cost: $934,1002013: 48 buildings , average cost: $513,9002012: 21 buildings , average cost: $457,0002011: 11 buildings , average cost: $393,6002010: 45 buildings , average cost: $419,4002009: 78 buildings , average cost: $396,6002008: 28 buildings , average cost: $509,3002007: 66 buildings , average cost: $401,6002006: 62 buildings , average cost: $303,4002005: 72 buildings , average cost: $399,2002004: 81 buildings , average cost: $239,4002003: 110 buildings , average cost: $253,0002002: 98 buildings , average cost: $220,1002001: 108 buildings , average cost: $221,5002000: 110 buildings , average cost: $255,0001999: 177 buildings , average cost: $229,1001998: 121 buildings , average cost: $268,4001997: 311 buildings , average cost: $201,300Unemployment in December 2023: Population change in the 1990s: +16,757 (+37.1%).
Most common occupations in Laguna Niguel, CA (%)
Both Males Females
Other management occupations, except farmers and farm managers (7.2%)
Sales representatives, services, wholesale and manufacturing (6.8%)
Other sales and related occupations, including supervisors (6.7%)
Top executives (5.0%)
Retail sales workers, except cashiers (3.7%)
Other office and administrative support workers, including supervisors (3.6%)
Preschool, kindergarten, elementary, and middle school teachers (3.2%)
Other management occupations, except farmers and farm managers (8.9%)
Sales representatives, services, wholesale and manufacturing (8.3%)
Top executives (7.6%)
Other sales and related occupations, including supervisors (7.1%)
Engineers (4.2%)
Computer specialists (4.0%)
Advertising, marketing, promotions, public relations, and sales managers (3.7%)
Other sales and related occupations, including supervisors (6.3%)
Secretaries and administrative assistants (6.2%)
Other office and administrative support workers, including supervisors (6.0%)
Preschool, kindergarten, elementary, and middle school teachers (5.9%)
Other management occupations, except farmers and farm managers (5.2%)
Sales representatives, services, wholesale and manufacturing (5.0%)
Retail sales workers, except cashiers (4.4%)
Earthquake activity:
Laguna Niguel-area historical earthquake activity is significantly above California state average. It is 6644% greater than the overall U.S. average. On 6/28/1992 at 11:57:34, a magnitude 7.6 (6.2 MB, 7.6 MS, 7.3 MW, Depth: 0.7 mi, Class: Major, Intensity: VIII - XII) earthquake occurred 81.0 miles away from the city center, causing 3 deaths ( 1 shaking deaths, 2 other deaths) and 400 injuries, causing $100,000,000 total damage and $40,000,000 insured lossesOn 7/21/1952 at 11:52:14, a magnitude 7.7 (7.7 UK) earthquake occurred 125.7 miles away from the city center, causing $50,000,000 total damage On 10/16/1999 at 09:46:44, a magnitude 7.4 (6.3 MB, 7.4 MS, 7.2 MW, 7.3 ML) earthquake occurred 99.5 miles away from the city center On 5/19/1940 at 04:36:40, a magnitude 7.2 (7.2 UK) earthquake occurred 117.8 miles away from Laguna Niguel center, causing $33,000,000 total damage On 4/21/1918 at 22:32:30, a magnitude 6.8 (6.8 UK, Class: Strong, Intensity: VII - IX) earthquake occurred 24.6 miles away from Laguna Niguel center On 11/4/1927 at 13:51:53, a magnitude 7.5 (7.5 UK) earthquake occurred 213.0 miles away from Laguna Niguel center Magnitude types: body-wave magnitude (MB), local magnitude (ML), surface-wave magnitude (MS), moment magnitude (MW) Natural disasters: The number of natural disasters in Orange County (32) is a lot greater than the US average (15).Major Disasters (Presidential) Declared: 22Emergencies Declared: 2Floods: 15, Fires: 13, Storms: 9, Landslides: 6, Winter Storms: 6, Mudslides: 5, Earthquakes: 2, Heavy Rain: 1, Hurricane: 1, Snow: 1, Tornado: 1, Wind: 1, Other: 1 (Note: some incidents may be assigned to more than one category). Main business address for: OPTIMUMCARE CORP /DE/ SERVICES-HOSPITALS ).
Hospitals and medical centers near Laguna Niguel: THE COVINGTON CARE CENTER (Nursing Home, about 3 miles away; ALISO VIEJO, CA)
MISSION HOSPITAL REGIONAL MED CENTER (about 3 miles away; MISSION VIEJO, CA)
MISSION HOSPITAL - TCU (Nursing Home, about 3 miles away; MISSION VIEJO, CA)
WIN HEALTH CARE SERVICES INC (Home Health Center, about 4 miles away; MISSION VIEJO, CA)
MISSION VIEJO DIALYSIS (Dialysis Facility, about 4 miles away; MISSION VIEJO, CA)
SOUTH COAST MEDICAL CTR D/P SN (Nursing Home, about 4 miles away; LAGUNA BEACH, CA)
SOUTH COAST MEDICAL CENTER HOME CARE (Home Health Center, about 4 miles away; LAGUNA BEACH, CA)
Amtrak stations near Laguna Niguel: 4 miles: SAN JUAN CAPISTRANO (LEE HALL, MONTEREY AVE. & SAN GORGONIO WAY) Services: ticket office, fully wheelchair accessible, enclosed waiting area, public restrooms, public payphones, full-service food facilities, paid short-term parking, paid long-term parking, call for taxi service, intercity bus service, public transit connection.
5 miles: LAGUNA BEACH (TRANSIT DEPOT, BROADWAY BTW. BEACH & FOR) - Bus Station 10 miles: SAN CLEMENTE PIER (SAN CLEMENTE, MUNICIPAL PIER) Services: free short-term parking, paid long-term parking, public transit connection.
Operable nuclear power plants near Laguna Niguel:
9 miles: San Onofre 2 and 3 in San Clemente, CA.
Colleges/universities with over 2000 students nearest to Laguna Niguel:
Saddleback College (about 3 miles; Mission Viejo, CA ; Full-time enrollment: 13,716)
Brandman University (about 10 miles; Irvine, CA ; FT enrollment: 6,027)
Concordia University-Irvine (about 11 miles; Irvine, CA ; FT enrollment: 3,284)
Coastline Community College (about 11 miles; Fountain Valley, CA ; FT enrollment: 4,591)
Irvine Valley College (about 11 miles; Irvine, CA ; FT enrollment: 8,005)
University of California-Irvine (about 12 miles; Irvine, CA ; FT enrollment: 28,587)
Vanguard University of Southern California (about 15 miles; Costa Mesa, CA ; FT enrollment: 2,104)
Private high school in Laguna Niguel: LAGUNA NIGUEL JR ACADEMY Students: 55, Location: 29702 KENSINGTON DR, Grades: KG-10)
Public elementary/middle schools in Laguna Niguel: NIGUEL HILLS MIDDLE Students: 1,383, Location: 29070 PASEO ESCUELA, Grades: 6-8)MOULTON ELEMENTARY Students: 489, Location: 29851 HIGHLANDS AVE., Grades: KG-5)GEORGE WHITE ELEMENTARY Students: 481, Location: 25422 CHAPPAROSA PARK DR., Grades: KG-5)JOHN MALCOM ELEMENTARY Students: 478, Location: 32261 CHARLES AVE., Grades: KG-5)LAGUNA NIGUEL ELEMENTARY Students: 432, Location: 27922 NIGUEL HEIGHTS BLVD., Grades: KG-5)MARIAN BERGESON ELEMENTARY Students: 388, Location: 25302 RANCHO NIGUEL RD., Grades: KG-5)HIDDEN HILLS ELEMENTARY Students: 327, Location: 25142 HIDDEN HILLS RD., Grades: KG-5)CROWN VALLEY ELEMENTARY Students: 275, Location: 29292 CROWN VALLEY PKWY., Grades: KG-5)Private elementary/middle schools in Laguna Niguel: ST ANNE SCHOOL Students: 844, Location: 32451 BEAR BRAND RD, Grades: PK-8)
LAGUNA NIGUEL MONTESSORI CENTER Students: 205, Location: 28083 MOULTON PKWY, Grades: PK-2)
MCDOWELL SCHOOL Students: 180, Location: 29028 ALOMA AVE, Grades: PK-8)
GRACE CLASSICAL ACADEMY Students: 63, Location: 24600 LA PLATA DR, Grades: KG-6)
MONTESSORI OF LAGUNA NIGUEL Students: 36, Location: 31171 NIGUEL RD, Grades: PK-1)
See full list of schools located in Laguna Niguel
Notable locations in Laguna Niguel: (A) , Crown Valley Branch Orange County Public Library (B) , Chet Holifield Federal Building (C) , Orange County Fire Authority Station 5 (D) , Orange County Fire Authority Station 49 (E) , Orange County Fire Authority Station 39 (F) . Display/hide their locations on the map
Shopping Centers: (1) , Crown Valley Mall Shopping Center (2) , Aliso Village Shopping Center (3) . Display/hide their locations on the map
Main business address in Laguna Niguel: (A) . Display/hide its location on the map
Reservoir: (A) . Display/hide its location on the map
Creek: (A) . Display/hide its location on the map
Parks in Laguna Niguel include: (1) , La Hermosa Park (2) , La Plata Park (3) , Laguna Niguel Regional Park (4) , Niguel Woods Park (5) , Ridgeview Park (6) , Sulphur Creek Park (7) . Display/hide their locations on the map
Birthplace of: Erik Apple - Martial artist, Christopher Klotz - Soccer player, Josh Keller - Soccer player.
Orange County has a predicted average indoor radon screening level less than 2 pCi/L (pico curies per liter) - Low Potential Average household size: This city:
2.6 peopleCalifornia:
2.9 people
Percentage of family households: This city:
71.1%Whole state:
68.7%
Percentage of households with unmarried partners: This city:
5.1%Whole state:
7.2%
Likely homosexual households (counted as self-reported same-sex unmarried-partner households)
Lesbian couples: 0.3% of all households Gay men: 0.6% of all households
People in group quarters in Laguna Niguel in 2010:
190 people in group homes intended for adults
36 people in workers' group living quarters and job corps centers
22 people in other noninstitutional facilities
People in group quarters in Laguna Niguel in 2000:
250 people in other noninstitutional group quarters
41 people in nursing homes
11 people in homes for the mentally retarded
Banks with branches in Laguna Niguel (2011 data):
Wells Fargo Bank, National Association: Crown Valley And Greenfield, Laguna Niguel Marketplace Branch, Dana Point, Aliso Viejo Branch, Crown Valley Branch. Info updated 2011/04/05: Bank assets: $1,161,490.0 mil, Deposits: $905,653.0 mil, headquarters in Sioux Falls, SD, positive income , 6395 total offices , Holding Company: Wells Fargo & Company
U.S. Bank National Association: Laguna Niguel Branch at 30000 Town Center Drive, branch established on 1980/04/21; Laguna Niguel Alicia Branch at 27120 Alicia Parkway, branch established on 1996/07/01. Info updated 2012/01/30: Bank assets: $330,470.8 mil, Deposits: $236,091.5 mil, headquarters in Cincinnati, OH, positive income , 3121 total offices , Holding Company: U.S. Bancorp
JPMorgan Chase Bank, National Association: Laguna Niguel Branch at 30202 Crown Valley Parkway, branch established on 1934/10/30; Laguna Niguel Office at 28131 Crow Valley Pkwy, branch established on 1991/09/23. Info updated 2011/11/10: Bank assets: $1,811,678.0 mil, Deposits: $1,190,738.0 mil, headquarters in Columbus, OH, positive income , International Specialization, 5577 total offices , Holding Company: Jpmorgan Chase & Co.
American Security Bank: Laguna Niguel Branch at 30100 Town Center Drive, Suite Q, branch established on 1998/09/21. Info updated 2008/09/12: Bank assets: $424.0 mil, Deposits: $370.1 mil, headquarters in Newport Beach, CA, positive income , Commercial Lending Specialization, 10 total offices , Holding Company: America Bancshares, Inc.
First Bank: Laguna Niguel Branch at 25461 Rancho Niguel Road, branch established on 1998/10/29. Info updated 2007/12/04: Bank assets: $6,579.8 mil, Deposits: $5,800.6 mil, headquarters in Creve Coeur, MO, negative income in the last year , Commercial Lending Specialization, 148 total offices , Holding Company: First Banks, Inc.
Bank of America, National Association: Laguna Niguel Branch at 30162 Crown Valley Parkway, branch established on 1969/12/01. Info updated 2009/11/18: Bank assets: $1,451,969.3 mil, Deposits: $1,077,176.8 mil, headquarters in Charlotte, NC, positive income , 5782 total offices , Holding Company: Bank Of America Corporation
Union Bank, National Association: Laguna Niguel Branch at 27211 La Paz Road, branch established on 1991/06/29. Info updated 2011/09/01: Bank assets: $88,967.5 mil, Deposits: $65,286.4 mil, headquarters in San Francisco, CA, positive income , Commercial Lending Specialization, 403 total offices , Holding Company: Mitsubishi Ufj Financial Group, Inc.
Citibank, National Association: Street Of The Golden Lantern Branch at 30311 Street Of The Golden Lantern, branch established on 1945/01/01. Info updated 2012/01/10: Bank assets: $1,288,658.0 mil, Deposits: $882,541.0 mil, headquarters in Sioux Falls, SD, positive income , International Specialization, 1048 total offices , Holding Company: Citigroup Inc.
For population 15 years and over in Laguna Niguel:
Never married: 28.1%Now married: 56.0%Separated: 1.0%Widowed: 4.3%Divorced: 10.6% For population 25 years and over in Laguna Niguel:
High school or higher: 95.8%Bachelor's degree or higher: 56.6%Graduate or professional degree: 24.0%Unemployed: 4.4%Mean travel time to work (commute): 20.2 minutes
Education Gini index (Inequality in education) Here:
10.8California average:
15.5
Religion statistics for Laguna Niguel, CA (based on Orange County data)
Religion Adherents Congregations Catholic 797,473 67 Evangelical Protestant 345,893 894 Other 141,815 329 Mainline Protestant 76,574 202 Orthodox 13,406 19 Black Protestant 2,424 8 None 1,632,647 -
Source: Clifford Grammich, Kirk Hadaway, Richard Houseal, Dale E.Jones, Alexei Krindatch, Richie Stanley and Richard H.Taylor. 2012. 2010 U.S.Religion Census: Religious Congregations & Membership Study. Association of Statisticians of American Religious Bodies. Jones, Dale E., et al. 2002. Congregations and Membership in the United States 2000. Nashville, TN: Glenmary Research Center. Graphs represent county-level data
Food Environment Statistics: Number of grocery stores : 530This county :
1.78 / 10,000 pop.California :
2.14 / 10,000 pop.
Number of supercenters and club stores : 18Orange County :
0.06 / 10,000 pop.California :
0.04 / 10,000 pop.
Number of convenience stores (no gas) : 147This county :
0.49 / 10,000 pop.California :
0.62 / 10,000 pop.
Number of convenience stores (with gas) : 434Orange County :
1.46 / 10,000 pop.California :
1.49 / 10,000 pop.
Number of full-service restaurants : 2,438Here :
8.19 / 10,000 pop.California :
7.42 / 10,000 pop.
Adult diabetes rate : Orange County :
6.3%California :
7.3%
Adult obesity rate : Here :
18.5%California :
21.3%
Low-income preschool obesity rate : Orange County :
16.4%California :
17.9%
Health and Nutrition: Healthy diet rate : Here:
51.2%California:
49.4%
Average overall health of teeth and gums : This city:
49.8%California:
48.0%
People feeling badly about themselves : Laguna Niguel:
21.0%California:
20.2%
People not drinking alcohol at all : This city:
9.9%State:
11.2%
Average hours sleeping at night : Overweight people : Laguna Niguel:
34.7%California:
31.5%
General health condition : Laguna Niguel:
58.0%California:
56.4%
Average condition of hearing : Here:
80.4%California:
80.9%
More about Health and Nutrition of Laguna Niguel, CA Residents
Local government employment and payroll (March 2022)
Function
Full-time employees
Monthly full-time payroll
Average yearly full-time wage
Part-time employees
Monthly part-time payroll
Parks and Recreation
22 $174,428 $95,143 64 $96,514 Housing and Community Development (Local)
13 $128,803 $118,895 2 $3,988 Streets and Highways
10 $102,194 $122,633 0 $0 Financial Administration
8 $76,025 $114,038 1 $3,844 Other Government Administration
7 $91,888 $157,522 2 $450 Sewerage
2 $28,956 $173,736 0 $0 Other and Unallocable
2 $20,159 $120,954 0 $0 Police - Other
1 $11,607 $139,284 0 $0 Police Protection - Officers
0 $0 2 $7,502
Totals for Government
65 $634,061 $117,057 71 $112,298
Laguna Niguel government finances - Expenditure in 2021 (per resident):
Construction - Regular Highways: $6,699,000 ($105.10)
Parks and Recreation: $2,813,000 ($44.13)General - Other: $307,000 ($4.82)Police Protection: $12,000 ($0.19)Housing and Community Development: $8,000 ($0.13)Current Operations - Police Protection: $14,587,000 ($228.84)
General - Other: $12,783,000 ($200.54)Central Staff Services: $8,437,000 ($132.36)Parks and Recreation: $6,901,000 ($108.26)Regular Highways: $4,613,000 ($72.37)Protective Inspection and Regulation - Other: $3,752,000 ($58.86)Financial Administration: $1,108,000 ($17.38)Health - Other: $451,000 ($7.08)Judicial and Legal Services: $394,000 ($6.18)Housing and Community Development: $191,000 ($3.00)Transit Utilities: $118,000 ($1.85)General - Interest on Debt: $6,000 ($0.09)
Other Capital Outlay - Regular Highways: $111,000 ($1.74)
Parks and Recreation: $32,000 ($0.50)
Laguna Niguel government finances - Revenue in 2021 (per resident):
Charges - Other: $302,000 ($4.74)
Parks and Recreation: $204,000 ($3.20)Federal Intergovernmental - Housing and Community Development: $311,000 ($4.88)
Other: $23,000 ($0.36)Local Intergovernmental - Other: $471,000 ($7.39)
Miscellaneous - Rents: $657,000 ($10.31)
General Revenue - Other: $346,000 ($5.43)Fines and Forfeits: $302,000 ($4.74)Interest Earnings: $46,000 ($0.72)State Intergovernmental - Highways: $2,644,000 ($41.48)
Other: $2,505,000 ($39.30)General Local Government Support: $81,000 ($1.27)Tax - Property: $24,550,000 ($385.15)
General Sales and Gross Receipts: $14,390,000 ($225.75)Public Utilities Sales: $2,352,000 ($36.90)Other License: $1,735,000 ($27.22)Documentary and Stock Transfer: $812,000 ($12.74)Other Selective Sales: $39,000 ($0.61)
Laguna Niguel government finances - Debt in 2021 (per resident):
Long Term Debt - Outstanding Unspecified Public Purpose: $181,000 ($2.84)
Beginning Outstanding - Unspecified Public Purpose: $158,000 ($2.48)Issue, Unspecified Public Purpose: $155,000 ($2.43)Retired Unspecified Public Purpose: $131,000 ($2.06)
Laguna Niguel government finances - Cash and Securities in 2021 (per resident):
Bond Funds - Cash and Securities: $1,478,000 ($23.19)
Other Funds - Cash and Securities: $57,615,000 ($903.88)
4.86% of this county's 2021 resident taxpayers lived in other counties in 2020 ($95,983 average adjusted gross income )
Here:
4.86%California average:
5.19%
0.01% of residents moved from foreign countries ($132 average AGI )Orange County:
0.01%California average:
0.03%
Top counties from which taxpayers relocated into this county between 2020 and 2021:
5.71% of this county's 2020 resident taxpayers moved to other counties in 2021 ($106,828 average adjusted gross income )
Here:
5.71%California average:
6.14%
0.01% of residents moved to foreign countries ($180 average AGI )Orange County:
0.01%California average:
0.02%
Top counties to which taxpayers relocated from this county between 2020 and 2021:
Businesses in Laguna Niguel, CA
Name Count Name Count
24 Hour Fitness 2 KFC 1 7-Eleven 1 Kohl's 1 AT&T 1 Kroger 2 Ace Hardware 1 LA Fitness 1 Albertsons 2 MasterBrand Cabinets 9 Baja Fresh Mexican Grill 1 McDonald's 3 Bath & Body Works 1 Nike 5 Bed Bath & Beyond 1 Old Navy 1 Blockbuster 2 Panda Express 1 CVS 4 Payless 1 Carl\s Jr. 2 Pier 1 Imports 1 Chick-Fil-A 1 Pizza Hut 1 Chipotle 2 Quiznos 3 Circle K 1 RadioShack 2 Costco 2 Rite Aid 1 Curves 1 Safeway 2 DHL 1 Starbucks 7 Decora Cabinetry 4 T-Mobile 6 Domino's Pizza 1 T.G.I. Driday's 1 El Pollo Loco 1 Taco Bell 2 Ethan Allen 1 Trader Joe's 1 Famous Footwear 1 True Value 1 FedEx 6 UPS 10 GNC 2 Verizon Wireless 1 GameStop 1 Vons 2 Goodwill 1 Walgreens 2 H&R Block 2 Walmart 1 Home Depot 1 Wendy's 1 IHOP 1 YMCA 2 Jamba Juice 1
Strongest AM radio stations in Laguna Niguel:
KFI (640 AM; 50 kW; LOS ANGELES, CA; Owner: CAPSTAR TX LIMITED PARTNERSHIP)
KPLS (830 AM; 50 kW; ORANGE, CA; Owner: CRN LICENSES, LLC)
KLAC (570 AM; 50 kW; LOS ANGELES, CA; Owner: AMFM RADIO LICENSES, L.L.C.)
KTNQ (1020 AM; 50 kW; LOS ANGELES, CA; Owner: KTNQ-AM LICENSE CORP.)
KXTA (1150 AM; 50 kW; LOS ANGELES, CA; Owner: CITICASTERS LICENSES, L.P.)
KNX (1070 AM; 50 kW; LOS ANGELES, CA; Owner: INFINITY BROADCASTING OPERATIONS, INC.)
KDIS (1110 AM; 50 kW; PASADENA, CA; Owner: ABC,INC.)
KFWB (980 AM; 50 kW; LOS ANGELES, CA; Owner: INFINITY BROADCASTING OPERATIONS, INC.)
KSPN (710 AM; 50 kW; LOS ANGELES, CA; Owner: KABC-AM RADIO, INC.)
KFMB (760 AM; 50 kW; SAN DIEGO, CA; Owner: MIDWEST TELEVISION, INC.)
KMPC (1540 AM; 50 kW; LOS ANGELES, CA; Owner: ROSE CITY RADIO CORPORATION)
KBLA (1580 AM; 50 kW; SANTA MONICA, CA)
KCBQ (1170 AM; 50 kW; SAN DIEGO, CA; Owner: RADIO 1210, INC.)
Strongest FM radio stations in Laguna Niguel:
KWVE (107.9 FM; SAN CLEMENTE, CA; Owner: CALVARY CHAPEL OF COSTA MESA)
KSBR (88.5 FM; MISSION VIEJO, CA; Owner: SADDLEBACK COMMUNITY COLLEGE DIST.)
KRTM (88.9 FM; TEMECULA, CA; Owner: PENFOLD COMMUNICATIONS, INC.)
KDLE (103.1 FM; NEWPORT BEACH, CA; Owner: ENTRAVISION HOLDINGS, LLC.)
KCBS-FM (93.1 FM; LOS ANGELES, CA; Owner: INFINITY BROADCASTING OPERATIONS, INC.)
KLRD (90.1 FM; YUCAIPA, CA; Owner: EDUCATIONAL MEDIA FOUNDATION)
KZLA-FM (93.9 FM; LOS ANGELES, CA; Owner: EMMIS RADIO LICENSE CORPORATION)
KSCA (101.9 FM; GLENDALE, CA; Owner: HBC LICENSE CORPORATION)
KUOR-FM (89.1 FM; REDLANDS, CA; Owner: UNIVERSITY OF REDLANDS)
KLOS (95.5 FM; LOS ANGELES, CA; Owner: KLOS-FM RADIO, INC.)
K212FA (90.3 FM; TEMPLE CITY, CA; Owner: EDUCATIONAL MEDIA FOUNDATION)
KOST (103.5 FM; LOS ANGELES, CA; Owner: CAPSTAR TX LIMITED PARTNERSHIP)
KPWR (105.9 FM; LOS ANGELES, CA; Owner: EMMIS RADIO LICENSE CORPORATION)
KLSX (97.1 FM; LOS ANGELES, CA; Owner: INFINITY BROADCASTING OPERATIONS, INC.)
KLVE (107.5 FM; LOS ANGELES, CA; Owner: KLVE-FM LICENSE CORP.)
KIIS-FM (102.7 FM; LOS ANGELES, CA; Owner: CITICASTERS LICENSES, L.P.)
KUSC (91.5 FM; LOS ANGELES, CA; Owner: UNIVERSITY OF SOUTHERN CALIFORNIA)
KPCC (89.3 FM; PASADENA, CA; Owner: PASADENA AREA COMMUNITY COLLEGE DISTRICT)
KHHT (92.3 FM; LOS ANGELES, CA; Owner: AMFM RADIO LICENSES, L.L.C.)
KBIG-FM (104.3 FM; LOS ANGELES, CA; Owner: AMFM RADIO LICENSES, L.L.C.)
TV broadcast stations around Laguna Niguel:
KTRO-LP (Channel 50; LANCASTER, CA; Owner: ROBERT D. ADELMAN)
National Bridge Inventory (NBI) Statistics 60 Number of bridges1,089ft / 332m Total length $3,672,000 Total costs1,286,510 Total average daily traffic61,423 Total average daily truck traffic
New bridges - historical statistics
1 1930-1939 4 1960-1969 3 1970-1979 3 1980-1989 49 1990-1999
See full National Bridge Inventory statistics for Laguna Niguel, CA
FCC Registered Cell Phone Towers: 1
31250 Pacific Island Dr (25806) (Lat: 33.509306 Lon: -117.729083), Type: Tank, Structure height: 9.8 m, Call Sign: KNKA351Assigned Frequencies: 869.040 MHz, 869.040 MHz, 824.040 MHz, 824.040 MHz, 890.010 MHz, 890.010 MHz, 845.010 MHz, 845.010 MHzGrant Date: 08/29/2017, Expiration Date: 10/01/2027, Certifier: Michael P GogginRegistrant: At&t Services, Inc., 208 S Akard St, 20f, Dallas, TX 75202, Phone: (855) 699-7073, Fax: (214) 746-6410, Email:
FCC Registered Antenna Towers: 1
29102 Crown Valley Pky (Lat: 33.540278 Lon: -117.693889), Type: 6.0, Overall height: 6 m, Registrant: Pacific Bell Mobile Services, Pleas-anton, Phone: (510) 227-3059 FCC Registered Private Land Mobile Towers: 2 (
See the full list of FCC Registered Private Land Mobile Towers in Laguna Niguel, CA )
FCC Registered Broadcast Land Mobile Towers: 13 (
See the full list of FCC Registered Broadcast Land Mobile Towers )
FCC Registered Microwave Towers: 13 (
See the full list of FCC Registered Microwave Towers in this town )
FCC Registered Amateur Radio Licenses: 395 (
See the full list of FCC Registered Amateur Radio Licenses in Laguna Niguel )
FAA Registered Aircraft Manufacturers and Dealers: 1 (
See the full list of FAA Registered Manufacturers and Dealers in Laguna Niguel )
FAA Registered Aircraft: 35 (
See the full list of FAA Registered Aircraft )
Home Mortgage Disclosure Act Aggregated Statistics For Year 2009(Based on 10 full and 6 partial tracts) A) FHA, FSA/RHS & VA B) Conventional C) Refinancings D) Home Improvement Loans E) Loans on Dwellings For 5+ Families F) Non-occupant Loans on G) Loans On Manufactured Number Average Value Number Average Value Number Average Value Number Average Value Number Average Value Number Average Value Number Average Value
LOANS ORIGINATED 147 $380,939 506 $434,990 2,258 $370,415 73 $272,985 2 $29,546,640 192 $329,833 1 $463,270 APPLICATIONS APPROVED, NOT ACCEPTED 22 $374,607 68 $454,110 241 $391,079 15 $106,033 0 $0 19 $347,308 1 $104,300 APPLICATIONS DENIED 30 $328,273 118 $398,025 634 $448,562 18 $320,951 0 $0 77 $310,385 1 $30,270 APPLICATIONS WITHDRAWN 25 $373,473 105 $444,461 390 $421,740 14 $290,967 0 $0 44 $341,895 0 $0 FILES CLOSED FOR INCOMPLETENESS 5 $289,600 14 $435,834 133 $378,050 5 $204,068 0 $0 9 $231,227 0 $0
Aggregated Statistics For Year 2008(Based on 10 full and 6 partial tracts) A) FHA, FSA/RHS & VA B) Conventional C) Refinancings D) Home Improvement Loans E) Loans on Dwellings For 5+ Families F) Non-occupant Loans on G) Loans On Manufactured Number Average Value Number Average Value Number Average Value Number Average Value Number Average Value Number Average Value Number Average Value
LOANS ORIGINATED 66 $388,968 528 $446,948 855 $424,065 70 $188,065 0 $0 156 $390,373 1 $81,000 APPLICATIONS APPROVED, NOT ACCEPTED 7 $405,667 117 $489,519 200 $420,959 13 $219,272 0 $0 35 $423,911 2 $74,500 APPLICATIONS DENIED 15 $376,196 145 $513,569 458 $511,320 40 $350,942 0 $0 59 $401,177 2 $80,640 APPLICATIONS WITHDRAWN 15 $392,411 142 $494,654 221 $470,176 18 $221,600 1 $288,000 35 $344,640 0 $0 FILES CLOSED FOR INCOMPLETENESS 2 $366,410 30 $663,778 95 $505,690 4 $110,830 0 $0 6 $536,307 0 $0
Aggregated Statistics For Year 2007(Based on 10 full and 6 partial tracts) A) FHA, FSA/RHS & VA B) Conventional C) Refinancings D) Home Improvement Loans F) Non-occupant Loans on G) Loans On Manufactured Number Average Value Number Average Value Number Average Value Number Average Value Number Average Value Number Average Value
LOANS ORIGINATED 2 $379,585 845 $505,809 1,712 $494,411 170 $360,503 251 $397,403 0 $0 APPLICATIONS APPROVED, NOT ACCEPTED 0 $0 195 $503,854 346 $489,397 34 $376,125 46 $420,309 1 $170,610 APPLICATIONS DENIED 1 $158,560 217 $483,387 733 $583,972 104 $336,589 86 $498,703 3 $125,853 APPLICATIONS WITHDRAWN 0 $0 113 $545,392 340 $482,775 44 $406,045 51 $437,218 0 $0 FILES CLOSED FOR INCOMPLETENESS 0 $0 26 $446,648 131 $549,140 16 $305,576 18 $348,241 0 $0
Aggregated Statistics For Year 2006(Based on 10 full and 6 partial tracts) A) FHA, FSA/RHS & VA B) Conventional C) Refinancings D) Home Improvement Loans E) Loans on Dwellings For 5+ Families F) Non-occupant Loans on G) Loans On Manufactured Number Average Value Number Average Value Number Average Value Number Average Value Number Average Value Number Average Value Number Average Value
LOANS ORIGINATED 1 $425,930 1,296 $493,111 2,239 $485,331 252 $338,544 1 $4,716,850 332 $411,633 0 $0 APPLICATIONS APPROVED, NOT ACCEPTED 0 $0 251 $474,362 369 $436,410 33 $312,058 0 $0 64 $429,002 2 $244,705 APPLICATIONS DENIED 0 $0 370 $500,939 746 $503,054 96 $276,274 0 $0 92 $402,427 0 $0 APPLICATIONS WITHDRAWN 0 $0 234 $493,741 553 $486,449 41 $315,797 0 $0 67 $423,409 0 $0 FILES CLOSED FOR INCOMPLETENESS 0 $0 51 $456,455 139 $435,747 7 $162,597 0 $0 11 $386,201 0 $0
Aggregated Statistics For Year 2005(Based on 10 full and 6 partial tracts) A) FHA, FSA/RHS & VA B) Conventional C) Refinancings D) Home Improvement Loans E) Loans on Dwellings For 5+ Families F) Non-occupant Loans on G) Loans On Manufactured Number Average Value Number Average Value Number Average Value Number Average Value Number Average Value Number Average Value Number Average Value
LOANS ORIGINATED 1 $254,000 1,984 $466,140 2,834 $465,490 277 $316,924 1 $54,016,960 483 $366,091 3 $215,500 APPLICATIONS APPROVED, NOT ACCEPTED 1 $200,000 245 $435,043 408 $437,271 29 $347,877 0 $0 50 $316,660 2 $178,715 APPLICATIONS DENIED 0 $0 478 $467,440 675 $482,569 103 $297,531 0 $0 134 $364,865 3 $70,703 APPLICATIONS WITHDRAWN 0 $0 321 $494,658 560 $461,078 76 $339,369 0 $0 76 $384,531 0 $0 FILES CLOSED FOR INCOMPLETENESS 0 $0 66 $422,398 235 $464,060 19 $219,432 0 $0 11 $285,980 0 $0
Aggregated Statistics For Year 2004(Based on 10 full and 6 partial tracts) A) FHA, FSA/RHS & VA B) Conventional C) Refinancings D) Home Improvement Loans E) Loans on Dwellings For 5+ Families F) Non-occupant Loans on G) Loans On Manufactured Number Average Value Number Average Value Number Average Value Number Average Value Number Average Value Number Average Value Number Average Value
LOANS ORIGINATED 4 $248,005 1,834 $460,060 4,003 $390,154 276 $297,412 4 $9,922,410 443 $320,135 7 $93,156 APPLICATIONS APPROVED, NOT ACCEPTED 0 $0 314 $484,306 556 $390,299 34 $257,542 0 $0 50 $429,183 2 $52,050 APPLICATIONS DENIED 1 $257,000 369 $522,342 760 $428,987 90 $226,276 0 $0 92 $356,061 0 $0 APPLICATIONS WITHDRAWN 0 $0 263 $434,147 727 $385,627 61 $225,423 1 $25,340 42 $365,454 3 $60,383 FILES CLOSED FOR INCOMPLETENESS 1 $194,000 55 $385,595 197 $400,313 14 $152,351 0 $0 13 $335,757 1 $112,960
Aggregated Statistics For Year 2003(Based on 10 full and 6 partial tracts) A) FHA, FSA/RHS & VA B) Conventional C) Refinancings D) Home Improvement Loans E) Loans on Dwellings For 5+ Families F) Non-occupant Loans on Number Average Value Number Average Value Number Average Value Number Average Value Number Average Value Number Average Value
LOANS ORIGINATED 36 $228,545 2,290 $360,854 8,996 $306,239 140 $144,158 1 $9,900,000 603 $240,439 APPLICATIONS APPROVED, NOT ACCEPTED 4 $163,820 302 $387,727 1,059 $306,673 28 $107,260 0 $0 92 $272,892 APPLICATIONS DENIED 4 $193,628 335 $381,468 1,162 $330,330 65 $76,609 0 $0 95 $287,625 APPLICATIONS WITHDRAWN 1 $121,100 255 $360,515 1,180 $301,491 27 $108,184 0 $0 68 $284,288 FILES CLOSED FOR INCOMPLETENESS 2 $183,915 77 $360,610 290 $324,498 7 $77,384 0 $0 22 $253,223
Aggregated Statistics For Year 2002(Based on 2 full and 2 partial tracts) A) FHA, FSA/RHS & VA B) Conventional C) Refinancings D) Home Improvement Loans F) Non-occupant Loans on Number Average Value Number Average Value Number Average Value Number Average Value Number Average Value
LOANS ORIGINATED 44 $199,088 387 $266,351 1,326 $284,896 28 $120,316 91 $206,547 APPLICATIONS APPROVED, NOT ACCEPTED 1 $243,220 33 $255,851 197 $276,029 5 $128,944 12 $155,390 APPLICATIONS DENIED 5 $207,596 54 $257,272 176 $275,854 11 $71,013 9 $183,817 APPLICATIONS WITHDRAWN 4 $214,870 41 $275,725 199 $258,355 3 $98,933 12 $149,698 FILES CLOSED FOR INCOMPLETENESS 0 $0 14 $302,273 68 $320,493 1 $42,200 4 $211,898
Aggregated Statistics For Year 2001(Based on 2 full and 2 partial tracts) A) FHA, FSA/RHS & VA B) Conventional C) Refinancings D) Home Improvement Loans F) Non-occupant Loans on Number Average Value Number Average Value Number Average Value Number Average Value Number Average Value
LOANS ORIGINATED 45 $176,138 323 $248,315 1,009 $252,579 47 $48,783 59 $157,020 APPLICATIONS APPROVED, NOT ACCEPTED 1 $171,290 36 $340,698 163 $233,432 12 $58,907 8 $120,570 APPLICATIONS DENIED 7 $204,819 62 $222,789 180 $254,739 10 $84,563 13 $173,784 APPLICATIONS WITHDRAWN 1 $229,900 45 $229,554 172 $251,646 5 $80,912 12 $152,187 FILES CLOSED FOR INCOMPLETENESS 1 $123,000 8 $387,658 48 $240,712 0 $0 1 $77,710
Aggregated Statistics For Year 2000(Based on 2 full and 2 partial tracts) A) FHA, FSA/RHS & VA B) Conventional C) Refinancings D) Home Improvement Loans E) Loans on Dwellings For 5+ Families F) Non-occupant Loans on Number Average Value Number Average Value Number Average Value Number Average Value Number Average Value Number Average Value
LOANS ORIGINATED 69 $147,374 386 $244,344 206 $203,737 40 $43,491 1 $14,258,580 34 $149,169 APPLICATIONS APPROVED, NOT ACCEPTED 5 $135,152 47 $250,157 40 $227,989 19 $59,812 0 $0 6 $127,490 APPLICATIONS DENIED 5 $145,186 68 $202,808 86 $194,390 18 $67,658 0 $0 5 $148,686 APPLICATIONS WITHDRAWN 5 $150,600 47 $196,315 42 $184,265 11 $60,095 0 $0 4 $111,522 FILES CLOSED FOR INCOMPLETENESS 1 $108,000 13 $274,552 28 $231,649 2 $124,500 0 $0 1 $120,580
Aggregated Statistics For Year 1999(Based on 4 full and 6 partial tracts) A) FHA, FSA/RHS & VA B) Conventional C) Refinancings D) Home Improvement Loans E) Loans on Dwellings For 5+ Families F) Non-occupant Loans on Number Average Value Number Average Value Number Average Value Number Average Value Number Average Value Number Average Value
LOANS ORIGINATED 155 $147,275 1,684 $266,450 2,219 $250,204 184 $45,921 3 $127,280 200 $163,819 APPLICATIONS APPROVED, NOT ACCEPTED 6 $156,640 195 $293,713 410 $262,748 47 $40,211 0 $0 35 $175,998 APPLICATIONS DENIED 19 $137,055 301 $264,417 613 $241,216 66 $38,973 1 $83,900 37 $182,746 APPLICATIONS WITHDRAWN 15 $156,537 235 $227,007 424 $211,200 16 $55,846 1 $58,600 27 $213,268 FILES CLOSED FOR INCOMPLETENESS 5 $136,522 71 $281,794 162 $255,166 5 $80,756 0 $0 13 $201,290
Detailed mortgage data for all 16 tracts in Laguna Niguel, CA
Private Mortgage Insurance Companies Aggregated Statistics For Year 2009(Based on 10 full and 5 partial tracts) A) Conventional B) Refinancings C) Non-occupant Loans on Number Average Value Number Average Value Number Average Value
LOANS ORIGINATED 28 $373,910 4 $398,948 0 $0 APPLICATIONS APPROVED, NOT ACCEPTED 4 $275,225 4 $494,480 0 $0 APPLICATIONS DENIED 12 $402,265 8 $445,970 1 $225,760 APPLICATIONS WITHDRAWN 2 $468,945 5 $505,200 0 $0 FILES CLOSED FOR INCOMPLETENESS 1 $360,000 1 $616,430 0 $0
Aggregated Statistics For Year 2008(Based on 10 full and 5 partial tracts) A) Conventional B) Refinancings C) Non-occupant Loans on Number Average Value Number Average Value Number Average Value
LOANS ORIGINATED 53 $367,149 15 $375,628 3 $282,127 APPLICATIONS APPROVED, NOT ACCEPTED 19 $368,832 4 $525,142 1 $261,990 APPLICATIONS DENIED 10 $507,960 6 $518,137 2 $432,525 APPLICATIONS WITHDRAWN 3 $283,100 0 $0 0 $0 FILES CLOSED FOR INCOMPLETENESS 1 $687,670 0 $0 0 $0
Aggregated Statistics For Year 2007(Based on 6 full and 5 partial tracts) A) Conventional B) Refinancings C) Non-occupant Loans on Number Average Value Number Average Value Number Average Value
LOANS ORIGINATED 24 $390,261 20 $413,227 6 $404,718 APPLICATIONS APPROVED, NOT ACCEPTED 4 $396,005 10 $359,433 0 $0 APPLICATIONS DENIED 1 $194,740 3 $875,007 1 $315,000 APPLICATIONS WITHDRAWN 2 $459,365 2 $321,545 0 $0 FILES CLOSED FOR INCOMPLETENESS 0 $0 0 $0 0 $0
Aggregated Statistics For Year 2006(Based on 5 full and 4 partial tracts) A) Conventional B) Refinancings C) Non-occupant Loans on Number Average Value Number Average Value Number Average Value
LOANS ORIGINATED 15 $423,671 6 $514,125 2 $456,605 APPLICATIONS APPROVED, NOT ACCEPTED 1 $345,130 3 $405,413 0 $0 APPLICATIONS DENIED 1 $347,730 3 $783,000 0 $0 APPLICATIONS WITHDRAWN 2 $486,530 3 $475,750 1 $390,680 FILES CLOSED FOR INCOMPLETENESS 0 $0 0 $0 0 $0
Aggregated Statistics For Year 2005(Based on 9 full and 4 partial tracts) A) Conventional B) Refinancings C) Non-occupant Loans on Number Average Value Number Average Value Number Average Value
LOANS ORIGINATED 26 $388,218 11 $532,526 4 $353,885 APPLICATIONS APPROVED, NOT ACCEPTED 5 $512,498 3 $357,827 0 $0 APPLICATIONS DENIED 1 $539,380 3 $497,170 0 $0 APPLICATIONS WITHDRAWN 2 $406,965 4 $434,882 2 $453,000 FILES CLOSED FOR INCOMPLETENESS 0 $0 0 $0 0 $0
Aggregated Statistics For Year 2004(Based on 10 full and 5 partial tracts) A) Conventional B) Refinancings C) Non-occupant Loans on Number Average Value Number Average Value Number Average Value
LOANS ORIGINATED 34 $371,843 10 $302,032 6 $286,307 APPLICATIONS APPROVED, NOT ACCEPTED 12 $325,377 18 $295,877 2 $199,565 APPLICATIONS DENIED 0 $0 0 $0 0 $0 APPLICATIONS WITHDRAWN 3 $261,183 4 $293,178 0 $0 FILES CLOSED FOR INCOMPLETENESS 2 $419,500 2 $480,075 0 $0
Aggregated Statistics For Year 2003(Based on 10 full and 6 partial tracts) A) Conventional B) Refinancings C) Non-occupant Loans on Number Average Value Number Average Value Number Average Value
LOANS ORIGINATED 82 $304,294 46 $267,116 10 $261,734 APPLICATIONS APPROVED, NOT ACCEPTED 35 $277,848 30 $290,157 5 $237,514 APPLICATIONS DENIED 2 $341,500 0 $0 0 $0 APPLICATIONS WITHDRAWN 1 $669,450 10 $282,809 0 $0 FILES CLOSED FOR INCOMPLETENESS 0 $0 0 $0 0 $0
Aggregated Statistics For Year 2002(Based on 2 full and 2 partial tracts) A) Conventional B) Refinancings C) Non-occupant Loans on Number Average Value Number Average Value Number Average Value
LOANS ORIGINATED 41 $229,843 11 $253,646 6 $198,578 APPLICATIONS APPROVED, NOT ACCEPTED 11 $248,863 8 $222,194 1 $185,690 APPLICATIONS DENIED 3 $395,097 0 $0 0 $0 APPLICATIONS WITHDRAWN 3 $274,840 2 $154,645 1 $266,000 FILES CLOSED FOR INCOMPLETENESS 0 $0 0 $0 0 $0
Aggregated Statistics For Year 2001(Based on 2 full and 2 partial tracts) A) Conventional B) Refinancings C) Non-occupant Loans on Number Average Value Number Average Value Number Average Value
LOANS ORIGINATED 44 $218,224 15 $222,903 1 $150,750 APPLICATIONS APPROVED, NOT ACCEPTED 15 $213,229 5 $209,218 3 $123,417 APPLICATIONS DENIED 3 $259,737 2 $260,960 0 $0 APPLICATIONS WITHDRAWN 1 $135,650 2 $187,330 0 $0 FILES CLOSED FOR INCOMPLETENESS 0 $0 0 $0 0 $0
Aggregated Statistics For Year 2000(Based on 2 full and 2 partial tracts) A) Conventional B) Refinancings C) Non-occupant Loans on Number Average Value Number Average Value Number Average Value
LOANS ORIGINATED 51 $216,934 17 $234,949 3 $102,560 APPLICATIONS APPROVED, NOT ACCEPTED 10 $175,012 3 $116,833 1 $71,750 APPLICATIONS DENIED 4 $143,452 0 $0 0 $0 APPLICATIONS WITHDRAWN 3 $146,623 0 $0 0 $0 FILES CLOSED FOR INCOMPLETENESS 0 $0 0 $0 0 $0
Aggregated Statistics For Year 1999(Based on 4 full and 6 partial tracts) A) Conventional B) Refinancings C) Non-occupant Loans on Number Average Value Number Average Value Number Average Value
LOANS ORIGINATED 256 $236,726 74 $207,025 4 $145,282 APPLICATIONS APPROVED, NOT ACCEPTED 39 $218,475 28 $200,642 2 $114,465 APPLICATIONS DENIED 19 $254,457 14 $223,459 1 $209,360 APPLICATIONS WITHDRAWN 11 $243,545 4 $192,055 0 $0 FILES CLOSED FOR INCOMPLETENESS 7 $350,387 3 $187,960 1 $99,170
Most common first names in Laguna Niguel, CA among deceased individuals Name Count Lived (average)
John 181 75.6 years Robert 149 74.4 years Mary 141 83.3 years William 123 75.7 years James 111 72.3 years Helen 109 82.0 years Dorothy 86 80.4 years George 86 79.0 years Charles 85 74.5 years Margaret 80 81.5 years
Most common last names in Laguna Niguel, CA among deceased individuals Last name Count Lived (average)
Smith 54 78.3 years Brown 36 74.7 years Johnson 30 77.4 years Jones 28 83.3 years Miller 27 77.0 years Williams 21 82.1 years Moore 20 82.6 years Wilson 18 76.9 years Martin 18 81.9 years Davis 18 78.6 years
Laguna Niguel compared to California state average:
Median house value above state average. Unemployed percentage significantly below state average. Black race population percentage significantly below state average. Hispanic race population percentage below state average. Median age significantly above state average. Renting percentage below state average. Length of stay since moving in significantly above state average. House age below state average. Percentage of population with a bachelor's degree or higher above state average. Laguna Niguel, CA compared to other similar cities: Laguna Niguel on our top lists :
#13 on the list of "Top 101 cities with the highest percentage of workers working at home, population 50,000+"
#14 on the list of "Top 101 cities with the lowest number of thefts per 100,000 residents (population 50,000+)"
#14 on the list of "Top 101 cities with the largest city-data.com crime index increase from 2011 to 2012 (population 50,000+)"
#15 on the list of "Top 100 safest cities (lowest city-data.com crime index) (pop. 50,000+)"
#17 on the list of "Top 101 cities with largest percentage of males in occupations: management occupations (population 50,000+)"
#17 on the list of "Top 101 cities with the lowest city-data.com crime index (population 50,000+)"
#21 on the list of "Top 101 cities with the smallest temperature differences during a year (population 50,000+)"
#25 on the list of "Top 101 cities with largest percentage of males in industries: real estate and rental and leasing (population 50,000+)"
#27 on the list of "Top 101 cities with the most residents born in Iran (population 500+)"
#28 on the list of "Top 101 cities with the highest cost per building permit(population 50,000+)"
#29 on the list of "Top 100 cities with highest median house value (pop. 50,000+)"
#32 on the list of "Top 101 cities with largest percentage of females in occupations: management occupations (population 50,000+)"
#34 on the list of "Top 101 cities with the lowest number of assaults per 100,000 residents (population 50,000+)"
#39 on the list of "Top 101 cities with largest percentage of males in occupations: sales and related occupations (population 50,000+)"
#40 on the list of "Top 101 cities with the lowest number of auto thefts per 100,000 residents (population 50,000+)"
#40 on the list of "Top 101 cities with largest percentage of females in industries: real estate and rental and leasing (population 50,000+)"
#41 on the list of "Top 100 cities with highest median household income (pop. 50,000+)"
#42 on the list of "Top 101 cities with largest percentage of males in occupations: arts, design, entertainment, sports, and media occupations (population 50,000+)"
#42 on the list of "Top 101 cities with largest percentage of females in occupations: sales and related occupations (population 50,000+)"
#43 on the list of "Top 101 cities with largest percentage of females in industries: professional, scientific, and technical services (population 50,000+)"
#4 on the list of "Top 101 counties with the highest total withdrawal of fresh water for public supply"
#5 on the list of "Top 101 counties with the most Catholic adherents"
#6 on the list of "Top 101 counties with the highest ground withdrawal of fresh water for public supply"
#7 on the list of "Top 101 counties with the most Evangelical Protestant adherents"
#8 on the list of "Top 101 counties with the highest Particulate Matter (PM2.5 ) Annual air pollution readings in 2012 (µg/m3 )"
Top Patent Applicants
Hooman Darabi (113)
Massi Joe E. Kiani (109)
Bindu Rama Rao (94)
Pieter Vorenkamp (61)
Brian J. Cox (50)
Paul Lubock (47)
Mikhail Boukhny (47)
Robert F. Rosenbluth (32)
Chiewcharn Narathong (31)
Young Hoon Kwon (28)
Total of 2876 patent applications in 2008-2024.
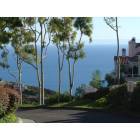
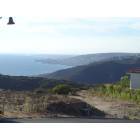
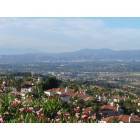
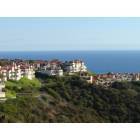


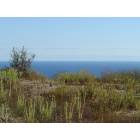
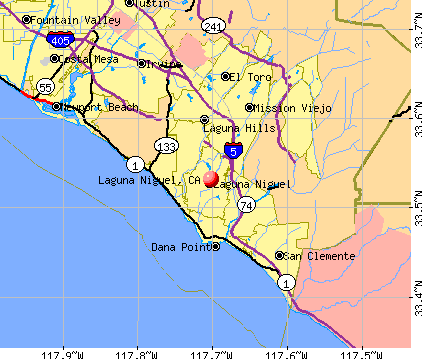


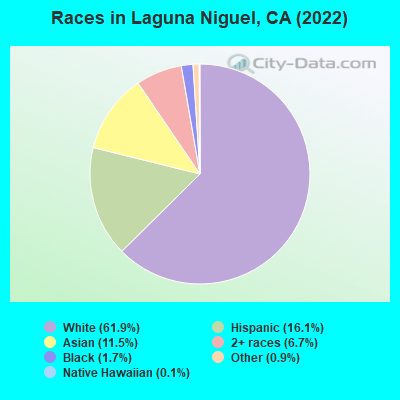
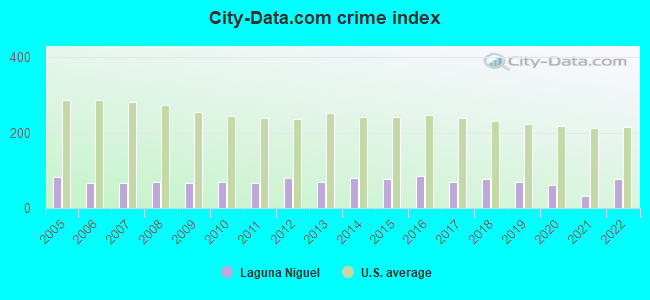
 Recent articles from our blog. Our writers, many of them Ph.D. graduates or candidates, create easy-to-read articles on a wide variety of topics.

 , pop. 288,147).
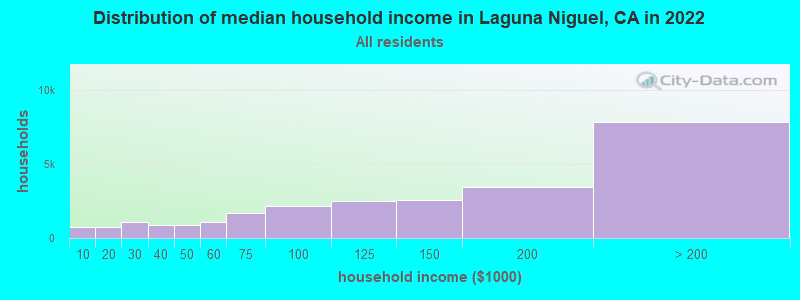
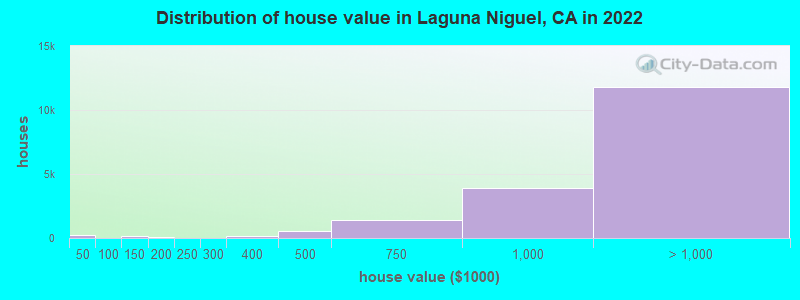
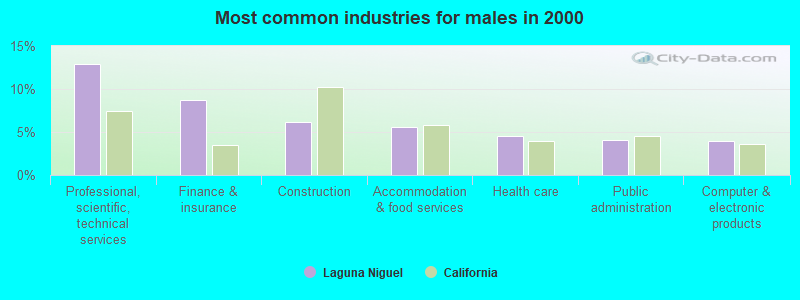
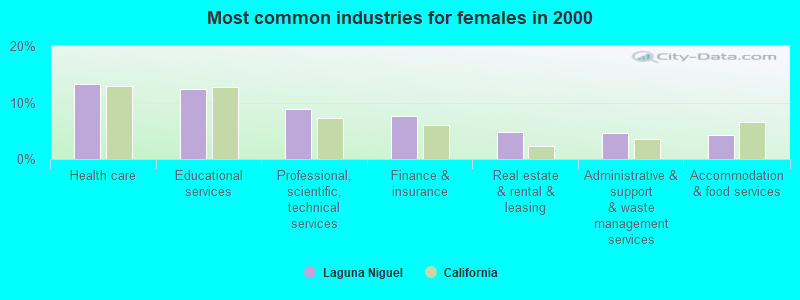
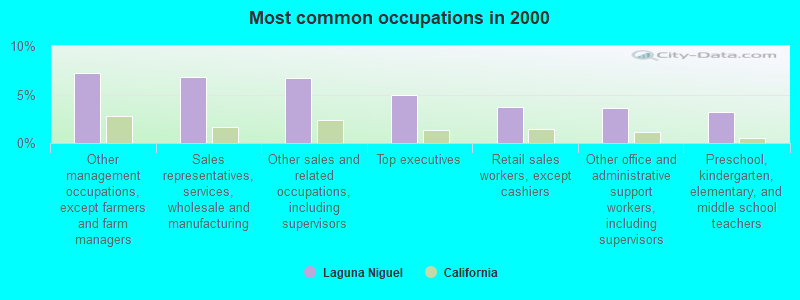
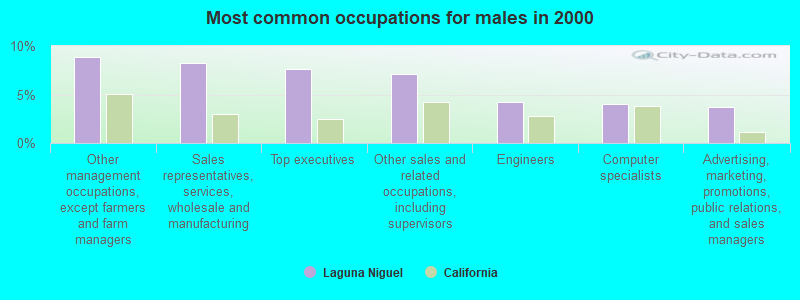

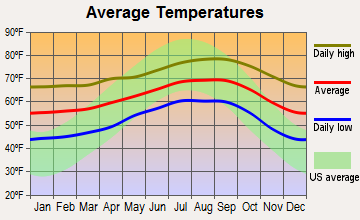
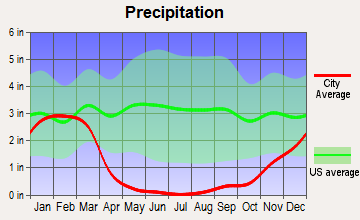
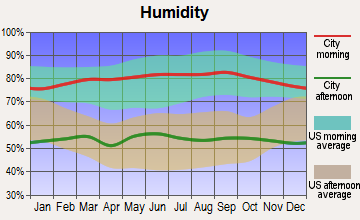
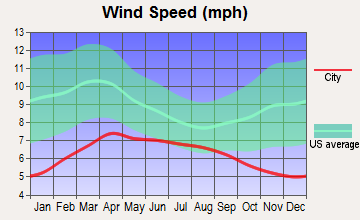
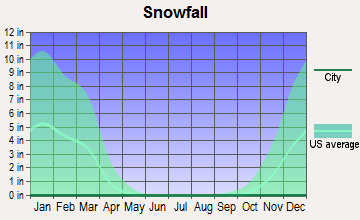
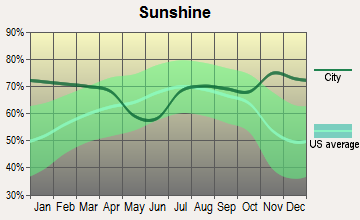
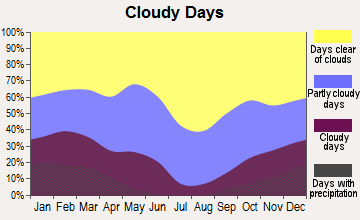
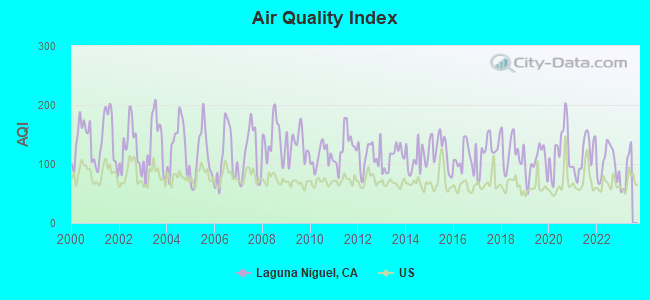
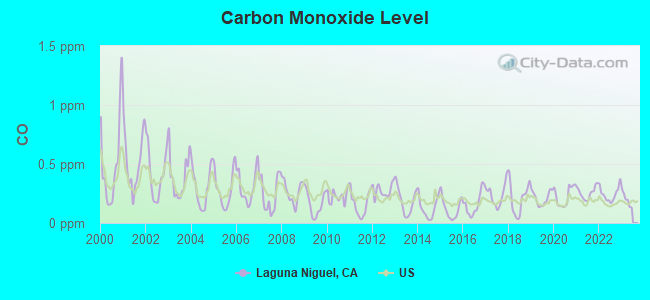
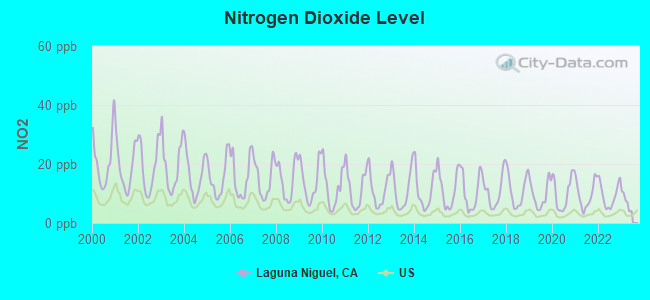
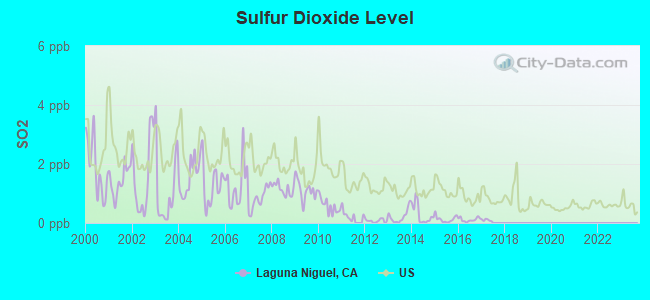
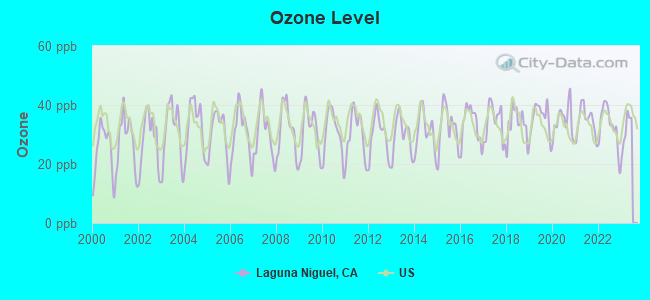
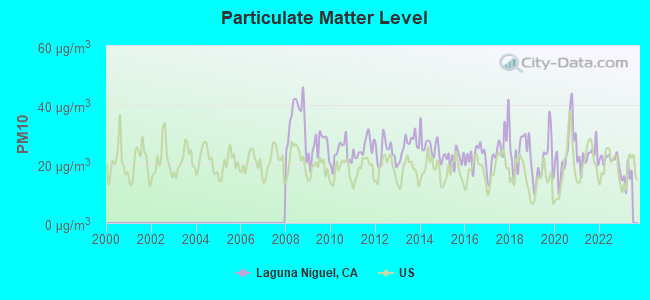
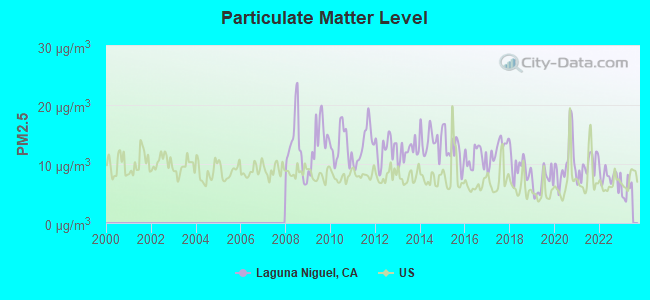
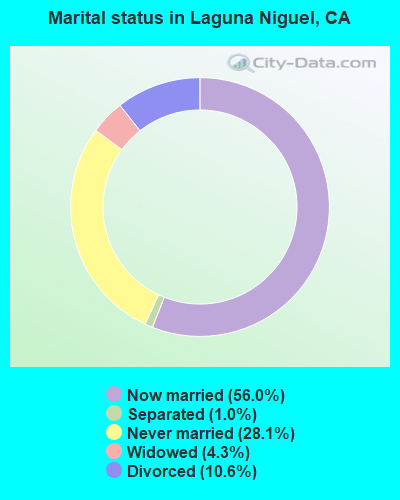
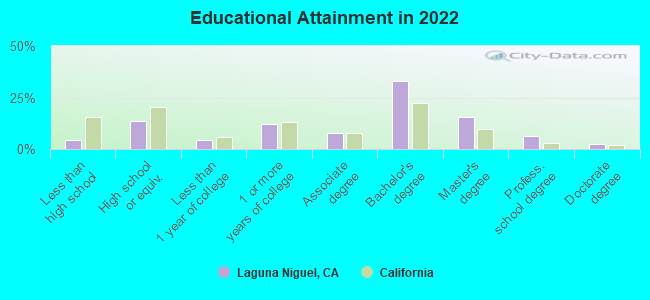
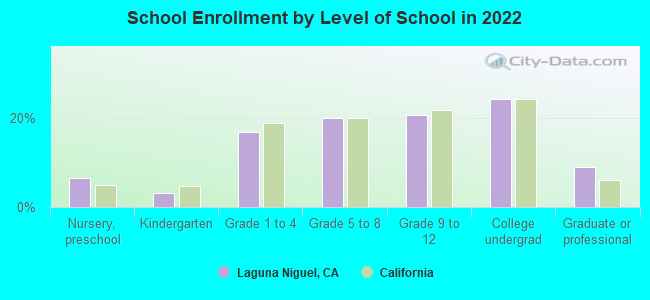
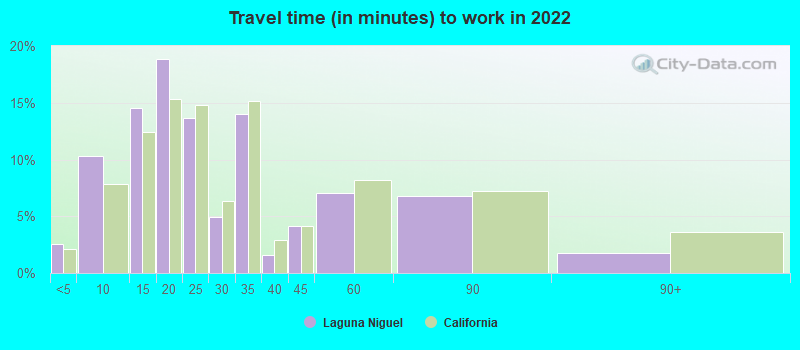
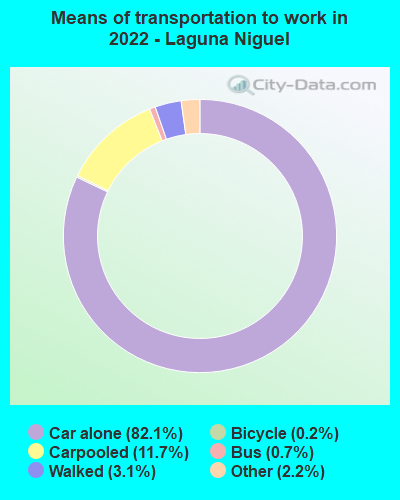


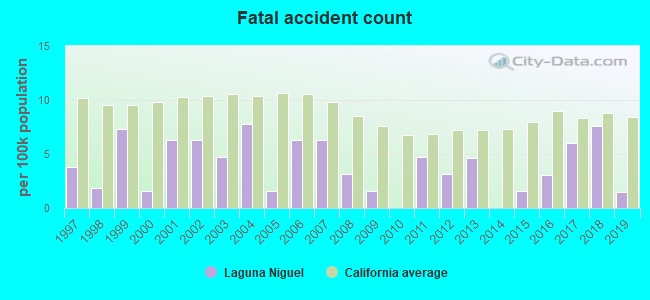
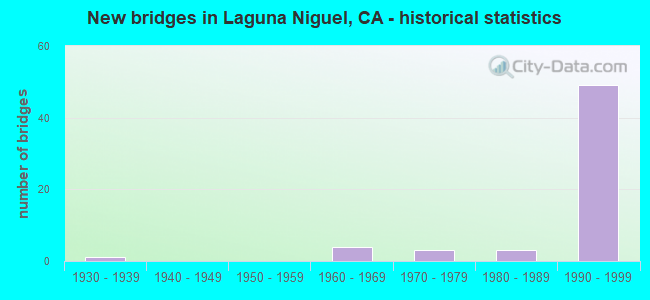
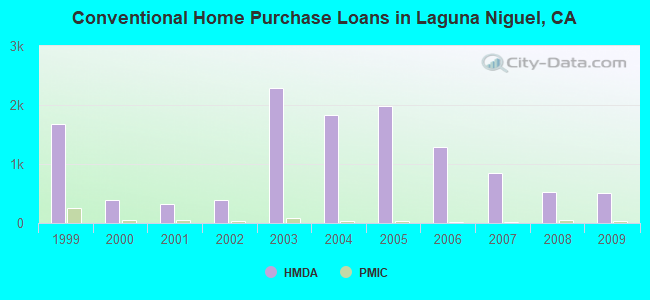
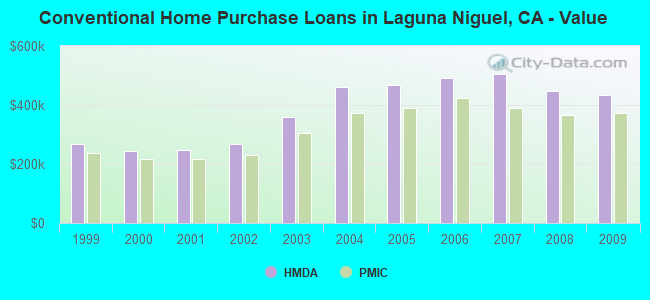
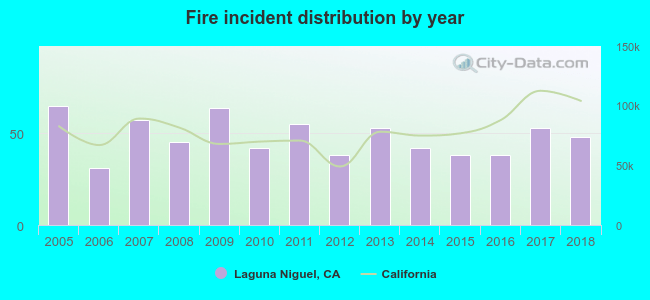 Based on the data from the years 2005 - 2018 the average number of fires per year is 48. The highest number of fire incidents - 65 took place in 2005, and the least - 31 in 2006. The data has a declining trend.
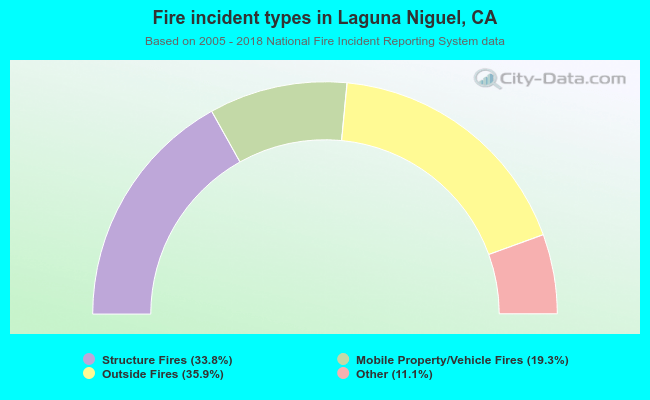 When looking into fire subcategories, the most reports belonged to: Outside Fires (35.9%), and Structure Fires (33.8%).