Estimated zip code population in 2022: 63,725 Zip code population in 2010: 63,297 Zip code population in 2000: 62,099
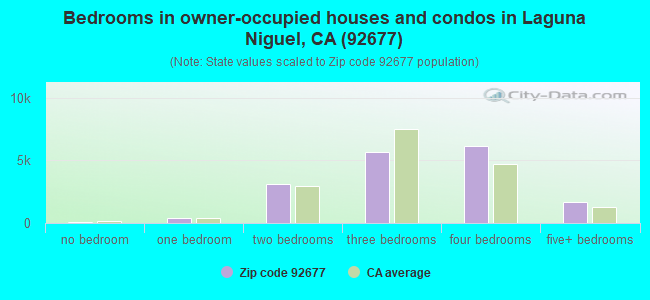
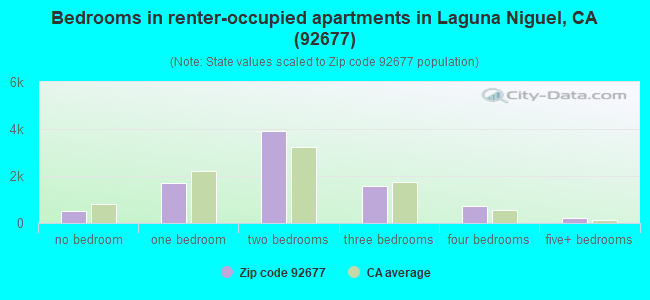
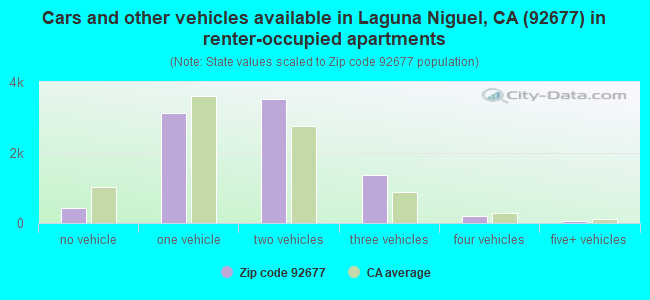
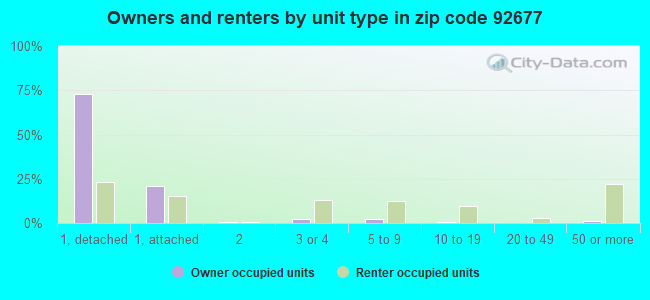
Houses and condos: 27,544 Renter-occupied apartments: 8,681
% of renters here:
34%
State:
44%
March 2022 cost of living index in zip code 92677: 88.1 (less than average, U.S. average is 100)
Land area: 16.7 sq. mi. Water area: 0.1 sq. mi.
Population density: 3,816 people per square mile
(average).
OSM Map
General Map
Google Map
MSN Map
OSM Map
General Map
Google Map
MSN Map
OSM Map
General Map
Google Map
MSN Map
OSM Map
General Map
Google Map
MSN Map
Please wait while loading the map...
Real estate property taxes paid for housing units in 2022:
This zip code:
0.6% ($6,450)
California:
0.7% ($4,831)
Median real estate property taxes paid for housing units with mortgages in 2022: $6,799 (0.6%) Median real estate property taxes paid for housing units with no mortgage in 2022: $5,875 (0.5%)
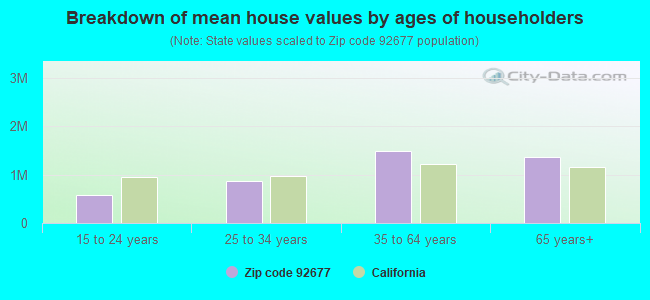
Estimated median house/condo value in 2022: $1,143,181
92677:
$1,143,181
California:
$715,900
According to our research of California and other state lists, there were 14 registered sex offenders living in 92677 zip code as of April 27, 2024. The ratio of all residents to sex offenders in zip code 92677 is 4,756 to 1. The ratio of registered sex offenders to all residents in this zip code is much lower than the state average.
Median resident age:
This zip code:
48.0 years
California median age:
37.9 years
Average household size:
This zip code:
2.5 people
California:
2.8 people
Averages for the 2020 tax year for zip code 92677, filed in 2021:
Average Adjusted Gross Income (AGI) in 2020: $143,047 (Individual Income Tax Returns)
Here:
$143,047
State:
$95,910
Salary/wage: $110,233 (reported on 75.1% of returns)
Here:
$110,233
State:
$77,331
(% of AGI for various income ranges: 1224.0% for AGIs below $25k, 3997.7% for AGIs $25k-50k, 7315.8% for AGIs $50k-75k, 10778.1% for AGIs $75k-100k, 20466.0% for AGIs $100k-200k, 107512.2% for AGIs over 200k)
Taxable interest for individuals: $3,569 (reported on 49.4% of returns)
This zip code:
$3,569
California:
$2,294
(% of AGI for various income ranges: 50.3% for AGIs below $25k, 76.7% for AGIs $25k-50k, 130.9% for AGIs $50k-75k, 180.0% for AGIs $75k-100k, 324.7% for AGIs $100k-200k, 2550.5% for AGIs over 200k)
Ordinary dividends: $10,231 (reported on 35.7% of returns)
Here:
$10,231
State:
$10,949
(% of AGI for various income ranges: 73.9% for AGIs below $25k, 121.9% for AGIs $25k-50k, 253.8% for AGIs $50k-75k, 389.6% for AGIs $75k-100k, 776.2% for AGIs $100k-200k, 5260.3% for AGIs over 200k)
Net capital gain/loss in AGI: +$50,936 (reported on 35.7% of returns)
Here:
+$50,936
State:
+$49,306
(% of AGI for various income ranges: 34.2% for AGIs below $25k, 120.1% for AGIs $25k-50k, 235.3% for AGIs $50k-75k, 406.3% for AGIs $75k-100k, 1106.3% for AGIs $100k-200k, 36926.4% for AGIs over 200k)
Profit/loss from business: +$21,252 (reported on 22.5% of returns)
Here:
+$21,252
State:
+$15,671
(% of AGI for various income ranges: 209.9% for AGIs below $25k, 381.1% for AGIs $25k-50k, 514.2% for AGIs $50k-75k, 662.0% for AGIs $75k-100k, 1153.4% for AGIs $100k-200k, 5332.8% for AGIs over 200k)
Taxable individual retirement arrangement distribution: $30,417 (reported on 12.0% of returns)
92677:
$30,417
California:
$23,505
(% of AGI for various income ranges: 90.2% for AGIs below $25k, 172.2% for AGIs $25k-50k, 417.7% for AGIs $50k-75k, 679.2% for AGIs $75k-100k, 1442.2% for AGIs $100k-200k, 3223.9% for AGIs over 200k)
Self-employed (Keogh) retirement plans: $32,280 (reported on 2.0% of returns)
92677:
$32,280
California:
$30,163
(% of AGI for various income ranges: 8.6% for AGIs $25k-50k, 24.7% for AGIs $50k-75k, 33.9% for AGIs $75k-100k, 94.6% for AGIs $100k-200k, 1147.7% for AGIs over 200k)
Total itemized deductions: $39,291 (reported on 28.1% of returns)
Here:
$39,291
State:
$39,517
(% of AGI for various income ranges: 253.5% for AGIs below $25k, 469.4% for AGIs $25k-50k, 1070.0% for AGIs $50k-75k, 1638.3% for AGIs $75k-100k, 3278.3% for AGIs $100k-200k, 12728.9% for AGIs over 200k)
Charity contributions: $10,497 (reported on 24.4% of returns)
Here:
$10,497
State:
$12,598
(% of AGI for various income ranges: 10.9% for AGIs below $25k, 40.0% for AGIs $25k-50k, 111.3% for AGIs $50k-75k, 189.2% for AGIs $75k-100k, 467.6% for AGIs $100k-200k, 4249.9% for AGIs over 200k)
Taxes paid: $9,004 (reported on 28.0% of returns)
92677:
$9,004
State:
$8,807
(% of AGI for various income ranges: 48.9% for AGIs below $25k, 99.2% for AGIs $25k-50k, 258.8% for AGIs $50k-75k, 476.0% for AGIs $75k-100k, 932.0% for AGIs $100k-200k, 2456.0% for AGIs over 200k)
Earned income credit: $1,594 (reported on 6.7% of returns)
Here:
$1,594
State:
$2,074
(% of AGI for various income ranges: 47.7% for AGIs below $25k, 40.3% for AGIs $25k-50k)
Percentage of individuals using paid preparers for their 2020 taxes: 92.5%
Here:
93%
State:
92%
(% for various income ranges: 90.1% for AGIs below $25k, 91.8% for AGIs $25k-50k, 92.4% for AGIs $50k-75k, 93.3% for AGIs $75k-100k, 93.9% for AGIs $100k-200k, 94.8% for AGIs over 200k)
Averages for the 2012 tax year for zip code 92677, filed in 2013:
Average Adjusted Gross Income (AGI) in 2012: $118,641 (Individual Income Tax Returns)
Here:
$118,641
State:
$72,726
Salary/wage: $94,420 (reported on 78.5% of returns)
Here:
$94,420
State:
$59,079
(% of AGI for various income ranges: 69.6% for AGIs below $25k, 71.9% for AGIs $25k-50k, 69.4% for AGIs $50k-75k, 69.1% for AGIs $75k-100k, 72.2% for AGIs $100k-200k, 55.4% for AGIs over 200k)
Taxable interest for individuals: $2,501 (reported on 51.1% of returns)
This zip code:
$2,501
California:
$2,146
(% of AGI for various income ranges: 2.4% for AGIs below $25k, 2.0% for AGIs $25k-50k, 1.1% for AGIs $50k-75k, 1.1% for AGIs $75k-100k, 1.0% for AGIs $100k-200k, 1.0% for AGIs over 200k)
Ordinary dividends: $10,006 (reported on 33.4% of returns)
Here:
$10,006
State:
$9,308
(% of AGI for various income ranges: 3.6% for AGIs below $25k, 2.0% for AGIs $25k-50k, 1.8% for AGIs $50k-75k, 2.0% for AGIs $75k-100k, 1.9% for AGIs $100k-200k, 3.5% for AGIs over 200k)
Net capital gain/loss in AGI: +$34,248 (reported on 32.7% of returns)
Here:
+$34,248
State:
+$30,460
(% of AGI for various income ranges: 0.4% for AGIs $25k-50k, 0.6% for AGIs $50k-75k, 0.8% for AGIs $75k-100k, 1.2% for AGIs $100k-200k, 16.4% for AGIs over 200k)
Profit/loss from business: +$24,426 (reported on 23.0% of returns)
Here:
+$24,426
State:
+$17,064
(% of AGI for various income ranges: 13.8% for AGIs below $25k, 8.8% for AGIs $25k-50k, 7.1% for AGIs $50k-75k, 5.5% for AGIs $75k-100k, 5.1% for AGIs $100k-200k, 3.4% for AGIs over 200k)
Taxable individual retirement arrangement distribution: $24,555 (reported on 12.8% of returns)
92677:
$24,555
California:
$19,557
(% of AGI for various income ranges: 4.7% for AGIs below $25k, 3.8% for AGIs $25k-50k, 3.8% for AGIs $50k-75k, 4.4% for AGIs $75k-100k, 3.7% for AGIs $100k-200k, 1.6% for AGIs over 200k)
Self-employment retirement plans: $25,907 (reported on 2.3% of returns)
92677:
$25,907
California:
$24,530
(% of AGI for various income ranges: 0.2% for AGIs $25k-50k, 0.3% for AGIs $50k-75k, 0.4% for AGIs $75k-100k, 0.5% for AGIs $100k-200k, 0.6% for AGIs over 200k)
Total itemized deductions: $41,307 (22% of AGI, reported on 54.7% of returns)
Here:
$41,307
State:
$34,004
Here:
21.7% of AGI
State:
22.7% of AGI
(% of AGI for various income ranges: 26.7% for AGIs below $25k, 18.9% for AGIs $25k-50k, 20.9% for AGIs $50k-75k, 22.9% for AGIs $75k-100k, 22.9% for AGIs $100k-200k, 16.3% for AGIs over 200k)
Charity contributions: $4,818 (reported on 48.1% of returns)
Here:
$4,818
State:
$4,659
(% of AGI for various income ranges: 1.2% for AGIs below $25k, 1.4% for AGIs $25k-50k, 1.9% for AGIs $50k-75k, 2.1% for AGIs $75k-100k, 2.2% for AGIs $100k-200k, 1.9% for AGIs over 200k)
Taxes paid: $18,244 (reported on 54.5% of returns)
92677:
$18,244
State:
$14,448
(% of AGI for various income ranges: 5.4% for AGIs below $25k, 4.3% for AGIs $25k-50k, 5.5% for AGIs $50k-75k, 7.2% for AGIs $75k-100k, 8.6% for AGIs $100k-200k, 9.3% for AGIs over 200k)
Earned income credit: $1,677 (reported on 7.9% of returns)
Here:
$1,677
State:
$2,286
(% of AGI for various income ranges: 3.0% for AGIs below $25k, 0.6% for AGIs $25k-50k)
Percentage of individuals using paid preparers for their 2012 taxes: 65.1%
Here:
65%
State:
64%
(% for various income ranges: 56.5% for AGIs below $25k, 63.2% for AGIs $25k-50k, 65.0% for AGIs $50k-75k, 68.7% for AGIs $75k-100k, 70.2% for AGIs $100k-200k, 77.0% for AGIs over 200k)
Averages for the 2004 tax year for zip code 92677, filed in 2005:
Average Adjusted Gross Income (AGI) in 2004: $100,267 (Individual Income Tax Returns)
Here:
$100,267
State:
$58,600
Salary/wage: $84,708 (reported on 79.7% of returns)
Here:
$84,708
State:
$49,455
(% of AGI for various income ranges: 69.6% for AGIs $10k-25k, 74.7% for AGIs $25k-50k, 75.1% for AGIs $50k-75k, 74.1% for AGIs $75k-100k, 63.3% for AGIs over 100k)
Taxable interest for individuals: $2,871 (reported on 61.3% of returns)
This zip code:
$2,871
California:
$2,365
(% of AGI for various income ranges: 3.6% for AGIs $10k-25k, 2.5% for AGIs $25k-50k, 2.0% for AGIs $50k-75k, 1.7% for AGIs $75k-100k, 1.5% for AGIs over 100k)
Taxable dividends: $4,563 (reported on 39.0% of returns)
Here:
$4,563
State:
$4,746
(% of AGI for various income ranges: 3.1% for AGIs $10k-25k, 1.9% for AGIs $25k-50k, 1.8% for AGIs $50k-75k, 1.8% for AGIs $75k-100k, 1.6% for AGIs over 100k)
Net capital gain/loss: +$28,545 (reported on 36.9% of returns)
Here:
+$28,545
State:
+$23,418
(% of AGI for various income ranges: 0.7% for AGIs $10k-25k, 0.8% for AGIs $25k-50k, 0.7% for AGIs $50k-75k, 1.7% for AGIs $75k-100k, 13.7% for AGIs over 100k)
Profit/loss from business: +$25,643 (reported on 23.2% of returns)
Here:
+$25,643
State:
+$16,826
(% of AGI for various income ranges: 13.4% for AGIs $10k-25k, 8.9% for AGIs $25k-50k, 7.7% for AGIs $50k-75k, 7.1% for AGIs $75k-100k, 5.1% for AGIs over 100k)
IRA payment deduction: $3,627 (reported on 4.5% of returns)
92677:
$3,627
California:
$3,192
(% of AGI for various income ranges: 0.4% for AGIs $10k-25k, 0.4% for AGIs $25k-50k, 0.3% for AGIs $50k-75k, 0.3% for AGIs $75k-100k, 0.1% for AGIs over 100k)
Self-employed pension: $19,743 (reported on 3.4% of returns)
Here:
$19,743
California:
$17,688
(% of AGI for various income ranges: 0.2% for AGIs $10k-25k, 0.3% for AGIs $25k-50k, 0.5% for AGIs $50k-75k, 0.6% for AGIs $75k-100k, 0.7% for AGIs over 100k)
Total itemized deductions: $39,130 (25% of AGI, reported on 58.9% of returns)
Here:
$39,130
State:
$28,113
Here:
25.1% of AGI
State:
25.3% of AGI
(% of AGI for various income ranges: 28.0% for AGIs $10k-25k, 24.9% for AGIs $25k-50k, 27.3% for AGIs $50k-75k, 28.1% for AGIs $75k-100k, 21.0% for AGIs over 100k)
Charity contributions deductions: $4,412 (3% of AGI, reported on 54.1% of returns)
Here:
$4,412
State:
$3,923
Here:
2.7% of AGI
State:
3.3% of AGI
(% of AGI for various income ranges: 1.7% for AGIs $10k-25k, 2.1% for AGIs $25k-50k, 2.6% for AGIs $50k-75k, 2.9% for AGIs $75k-100k, 2.3% for AGIs over 100k)
Total tax: $20,722 (reported on 83.2% of returns)
92677:
$20,722
State:
$10,761
(% of AGI for various income ranges: 5.6% for AGIs $10k-25k, 7.8% for AGIs $25k-50k, 9.7% for AGIs $50k-75k, 10.5% for AGIs $75k-100k, 19.8% for AGIs over 100k)
Earned income credit: $1,321 (reported on 5.4% of returns)
Here:
$1,321
State:
$1,763
Percentage of individuals using paid preparers for their 2004 taxes: 67.3%
Here:
67%
State:
66%
(% for various income ranges: 57.8% for AGIs below $10k, 62.8% for AGIs $10k-25k, 64.0% for AGIs $25k-50k, 69.4% for AGIs $50k-75k, 71.0% for AGIs $75k-100k, 75.2% for AGIs over 100k)
Likely homosexual households (counted as self-reported same-sex unmarried-partner households)
Lesbian couples: 0.1% of all households
Gay men: 0.2% of all households
Household received Food Stamps/SNAP in the past 12 months: 1,132 Household did not receive Food Stamps/SNAP in the past 12 months: 24,095
Women who had a birth in the past 12 months: 582 (420 now married, 162 unmarried) Women who did not have a birth in the past 12 months: 13,023 (5,370 now married, 7,643 unmarried)
Housing units in zip code 92677 with a mortgage: 11,617 (1,660 second mortgage, 14 home equity loan, 1,501 both second mortgage and home equity loan) Houses without a mortgage: 184
Median monthly owner costs for units with a mortgage: $3,467 Median monthly owner costs for units without a mortgage: $1,016
Residents with income below the poverty level in 2022:
This zip code:
7.4%
Whole state:
12.2%
Residents with income below 50% of the poverty level in 2022:
This zip code:
4.0%
Whole state:
6.2%
Median number of rooms in houses and condos:
Here:
6.5
State:
6.0
Median number of rooms in apartments:
Here:
4.2
State:
3.9
Notable locations in this zip code not listed on our city pages
Notable locations in zip code 92677: El Niguel Country Club (A), Crown Valley Branch Orange County Public Library (B), Chet Holifield Federal Building (C), Orange County Fire Authority Station 5 (D), Orange County Fire Authority Station 49 (E), Orange County Fire Authority Station 39 (F). Display/hide their locations on the map
Shopping Centers: Town Center South Shopping Center (1), Crown Valley Mall Shopping Center (2), Aliso Village Shopping Center (3). Display/hide their locations on the map
Parks in zip code 92677 include: Crown Valley Community Park (1), La Hermosa Park (2), La Plata Park (3), Laguna Niguel Regional Park (4), Niguel Woods Park (5), Ridgeview Park (6), Sulphur Creek Park (7). Display/hide their locations on the map
7,988 married couples with children.
1,900 single-parent households (586 men, 1,314 women).
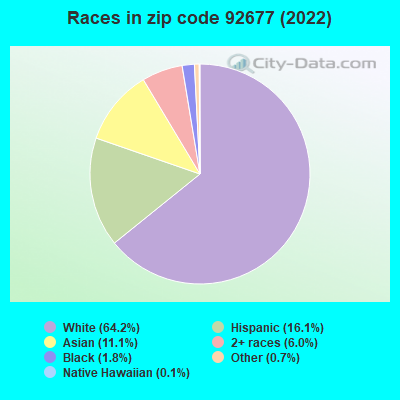
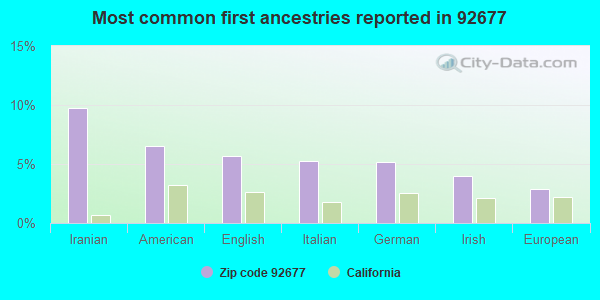
71.5% of residents of 92677 zip code speak English at home.
10.9% of residents speak Spanish at home (66% very well, 16% well, 16% not well, 2% not at all).
10.8% of residents speak other Indo-European language at home (72% very well, 17% well, 9% not well, 1% not at all).
6.1% of residents speak Asian or Pacific Island language at home (68% very well, 22% well, 9% not well, 1% not at all).
1.0% of residents speak other language at home (80% very well, 19% well).
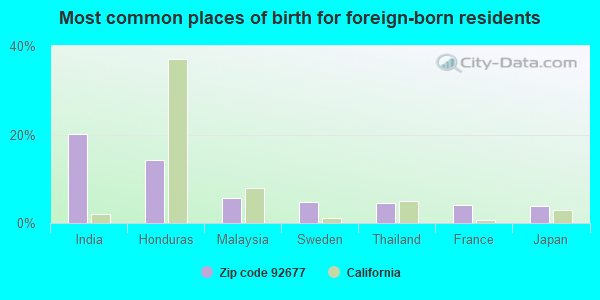
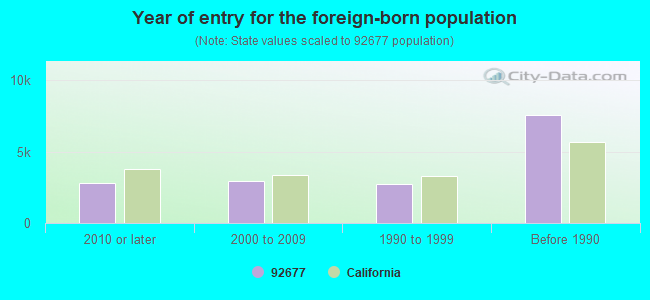
Foreign born population: 15,010 (23.6%) (72.0% of them are naturalized citizens)
Major facilities with environmental interests located in this zip code:
ECONO LUBE AND TUNE (27912 FORBES STE A in LAGUNA NIGUEL, CA) . Federal Facility
STATE MASTER (California - Hazardous Waste Tracking) - HAZARDOU WASTE PROGRAM Small Quantity Generators, between 100 kg and 1000 kg of hazardous waste/month (Resource Conservation and Recovery Act (tracking hazardous waste)) - notification STATE MASTER (California - Used Oil Recycling System ) - USED OIL RECYCLING Business NAICS classification: OTHER AUTOMOTIVE MECHANICAL AND ELECTRICAL REPAIR AND MAINTENANCE. Organizations: RONALD NASH (CONTACT/OWNER)
Alternative names: ECONO LUBE N TUNE NO 36, ECONO LUBE N TUNE #36
CHEVRON STATION NO 93783 (30072 CROWN VLY PKWY in LAGUNA NIGUEL, CA)
STATE MASTER (California - Hazardous Waste Tracking) - HAZARDOU WASTE PROGRAM Small Quantity Generators, between 100 kg and 1000 kg of hazardous waste/month (Resource Conservation and Recovery Act (tracking hazardous waste)) - notification STATE MASTER (California - Used Oil Recycling System ) - USED OIL RECYCLING Organizations: CHEVRON PRODUCTS CO (CONTACT/OWNER)
Alternative names: LAGUNA NIGUEL CHEVRON
HI-TECH COLLISION & PAINTING S (27762 CAMINO CAPISTRANO in LAGUNA NIGUEL, CA)
STATE MASTER (California - Hazardous Waste Tracking) - HAZARDOU WASTE PROGRAM (Resource Conservation and Recovery Act (tracking hazardous waste)) Organizations: GEORGE BOUKATHER (CONTACT/OWNER)
Alternative names: HI-TECH COLLISION & GLASS CENTER INC, HI TECH COLLISION & PAINTING
1-DAY PAINT AND BODY CENTERS INC (27592 CAMINO CAPIS in LAGUNA NIGUEL, CA)
STATE MASTER (California - Hazardous Waste Tracking) - HAZARDOU WASTE PROGRAM CRITERIA AND HAZARDOUS AIR POLLUTANT INVENTORY (Inventory of air pollution sources) Small Quantity Generators, between 100 kg and 1000 kg of hazardous waste/month (Resource Conservation and Recovery Act (tracking hazardous waste)) Business SIC classification: TOP, BODY, AND UPHOLSTERY REPAIR SHOPS AND PAINT SHOPS Business NAICS classification: AUTOMOTIVE BODY, PAINT, AND INTERIOR REPAIR AND MAINTENANCE.
CELEBRITY CLEANERS (28221 CROWN VALLEY PKWY STE C in LAGUNA NIGUEL, CA)
STATE MASTER (California - Hazardous Waste Tracking) - HAZARDOU WASTE PROGRAM Small Quantity Generators, between 100 kg and 1000 kg of hazardous waste/month (Resource Conservation and Recovery Act (tracking hazardous waste)) - notification Organizations: JOHN KIM (CONTACT/OWNER)
FORD CLEANERS (30100 TOWN CENTER DRIVE in LAGUNA NIGUEL, CA)
STATE MASTER (California - Hazardous Waste Tracking) - HAZARDOU WASTE PROGRAM Small Quantity Generators, between 100 kg and 1000 kg of hazardous waste/month (Resource Conservation and Recovery Act (tracking hazardous waste))
GREEN CLEANERS (28083 MOULTON PKWY C 3 in LAGUNA NIGUEL, CA)
STATE MASTER (California - Hazardous Waste Tracking) - HAZARDOU WASTE PROGRAM Small Quantity Generators, between 100 kg and 1000 kg of hazardous waste/month (Resource Conservation and Recovery Act (tracking hazardous waste)) - notification Organizations: KIM SUNG (CONTACT/OWNER)
MOBIL OIL D AND L SERVICE CTR (30061 ALICIA PKWY in LAGUNA NIGUEL, CA)
STATE MASTER (California - Hazardous Waste Tracking) - HAZARDOU WASTE PROGRAM Small Quantity Generators, between 100 kg and 1000 kg of hazardous waste/month (Resource Conservation and Recovery Act (tracking hazardous waste)) - notification Organizations: LESLIE BROCK (CONTACT/OWNER)
MALCOM (JOHN) ELEMENTARY (32261 CHARLES ROAD in LAGUNA NIGUEL, CA)
(National Center for Education Statistics) - STATE ID-6111827 Organizations: CAPISTRANO UNIFIED (SCHOOL DISTRICT)
(National Center for Education Statistics) - STATE ID-6111801 Organizations: CAPISTRANO UNIFIED (SCHOOL DISTRICT)
MOULTON ELEMENTARY (29851 HIGHLANDS AVE. in LAGUNA NIGUEL, CA)
(National Center for Education Statistics) - STATE ID-6095087 Organizations: CAPISTRANO UNIFIED (SCHOOL DISTRICT)
NIGUEL HILLS MIDDLE (29070 PASEO ESCUELA in LAGUNA NIGUEL, CA)
(National Center for Education Statistics) - STATE ID-6095095 Organizations: CAPISTRANO UNIFIED (SCHOOL DISTRICT)
Housing units lacking complete plumbing facilities: 0.4% Housing units lacking complete kitchen facilities: 0.5%
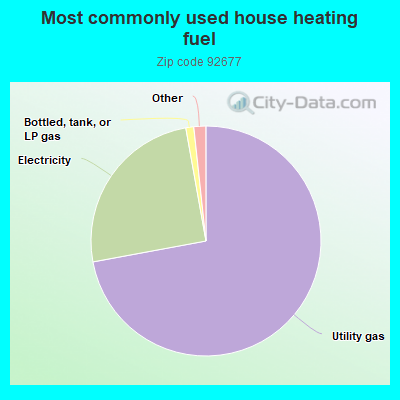
72.1%Utility gas
25.1%Electricity
1.1%Bottled, tank, or LP gas
0.8%No fuel used
0.8%Solar energy
Population in 1990: 40,072. Population change in the 1990s: +22,027 (+55.0%).
Place of birth for U.S.-born residents:
This state: 30,883
Northeast: 4,353
Midwest: 5,738
South: 3,147
West: 3,042
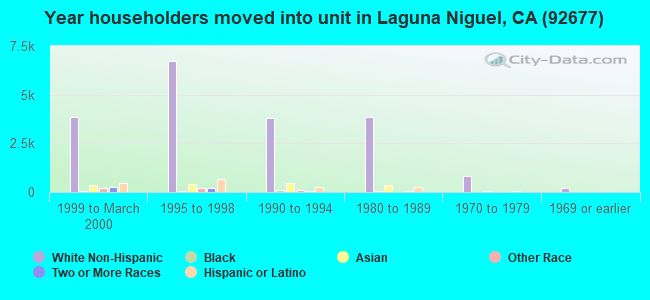
50% of the 92677 zip code residents lived in the same house 5 years ago. Out of people who lived in different houses, 64% lived in this county. Out of people who lived in different counties, 50% lived in California.
89% of the 92677 zip code residents lived in the same house 1 year ago. Out of people who lived in different houses, 59% moved from this county. Out of people who lived in different houses, 19% moved from different county within same state. Out of people who lived in different houses, 17% moved from different state. Out of people who lived in different houses, 5% moved from abroad.
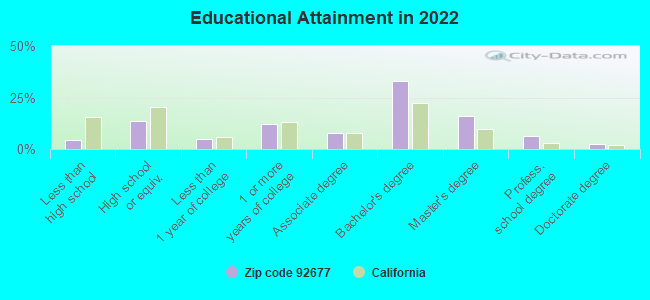
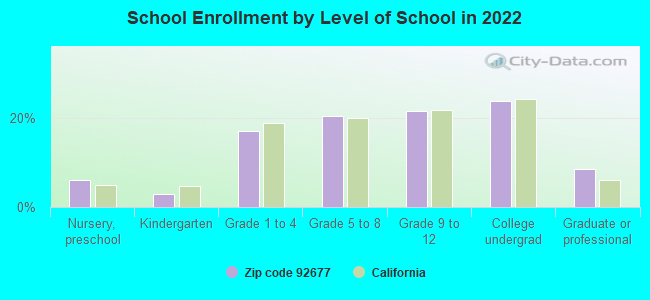
Private vs. public school enrollment:
Students in private schools in grades 1 to 8 (elementary and middle school): 905
Here:
17.7%
California:
10.5%
Students in private schools in grades 9 to 12 (high school): 520
Here:
17.7%
California:
8.5%
Students in private undergraduate colleges: 484
Here:
15.1%
California:
15.9%
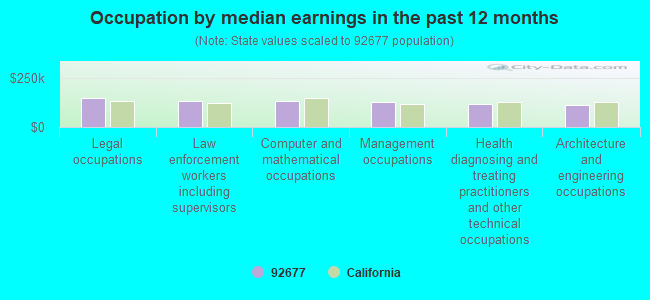
Occupation by median earnings in the past 12 months ($)
149,728Legal occupations
134,521Law enforcement workers including supervisors
134,238Computer and mathematical occupations
127,927Management occupations
118,451Health diagnosing and treating practitioners and other technical occupations
110,658Architecture and engineering occupations
Companies with biggest federal contracts located in this zip code (LAGUNA NIGUEL, CA):
INTEGRATED ENVIRONMENTAL MANAG (30012 IVY GLENN DRIVE; small business) : $7,452,485 in 133 contractsfrom 2000 to 2004
Contracts for Maintenance, Repair or Alteration of Real Property -- Miscellaneous Buildings, Construction of Structures and Facilities -- Miscellaneous Buildings, Maintenance, Repair or Alteration of Real Property -- Other Non-Building Facilities, Architect - Engineer Services (including landscaping, interior layout, and designing) by Army, Navy Signed by year:2000: $2,609,267; 2001: $2,976,543; 2002: $1,885,783; 2003: $0; 2004: -$19,108; 2005: $0; 2006: $0.
Biggest contracts:
$409,670 with Army for Maintenance, Repair or Alteration of Real Property -- Miscellaneous Buildings. Taking place in UT. Signed on 2001-09-14. Completion date: 2002-02-16.
$349,000, same as above.Signed on 2002-05-09. Completion date: 2002-08-08.
$308,451, same as above.Signed on 2001-10-31. Completion date: 2002-02-01.
$306,096, same as above.Signed on 2000-07-31. Completion date: 2000-12-08.
TR SYSTEMS, INC (29131 POMPANO WAY; small business) : $385,619 in 9 contractsfrom 1999 to 2004
Contracts for Photographic Equipment and Accessories, Optical Instruments, Test Equipment, Components and Accessories, Electrical Hardware and Supplies, Optoelectronic Devices and Associated Hardware, and moreby Navy, Air Force, Army Signed by year:2000: $39,830; 2001: $151,076; 2002: $35,845; 2003: $25,140; 2004: $47,678; 2005: $0; 2006: $0.
Biggest contracts:
$86,050 with Navy for Photographic Equipment and Accessories. Signed on 1999-11-12. Completion date: 1999-12-30.
$48,075 with Navy for Optical Instruments, Test Equipment, Components and Accessories. Signed on 2001-03-09. Completion date: 2001-04-26.
$47,678 with Air Force for Electrical Hardware and Supplies. Taking place in SC. Signed on 2004-08-20. Completion date: 2004-09-23.
$39,830 with Navy for Optoelectronic Devices and Associated Hardware. Taking place in HI. Signed on 2000-07-06. Completion date: 2000-07-11.
HOSPITALITY PLUS INC (28241 CROWN VALLEY PKY STE; small business)
$154,432 with Navy for Phonographs, Radio and Television Sets: Home Type. Signed on 2004-09-07. Completion date: 2004-11-03.
SURPLUS AMERICA, LLC (24842 VISTA MAGNIFICA; small business) : $138,100 in 2 contractsin 2000
$77,100 with Air Force for Drafting, Surveying, and Mapping Instruments. Taking place in FL. Signed on 2000-05-23. Completion date: 2000-06-09.
$61,000 with Air Force for ADP Software. Signed on 2000-04-10. Completion date: 2000-05-25.
NEXGENSEMI HOLDING CORPORATED (30251 GOLDEN LANTERN STE E; small business)
$99,872 with Missile Defense Agency for Defense Missile and Space Systems -- Basic Research (R&D). Signed on 2006-04-05. Completion date: 2006-10-05.
XSCI-TEK, INC (24001 SWALLOWTAIL DR; small business)
$99,829 with Department of Defense for Other Defense -- Applied Research and Exploratory Development (R&D). Signed on 2002-09-17. Completion date: 2003-03-17.
VISION MANAGEMENT (30262 CROWN VALLEY PKWY SU; small business)
$31,781 with Air Force for Video Recording and Reproducing Equipment. Signed on 2005-09-07. Completion date: 2005-10-13.
ADITUS SYSTEMS INC (30100 TOWN CENTER DRIVE, S; small business)
$25,390 with Army for Electrical and Electronic Properties Measuring and Testing Instruments. Signed on 2003-04-16. Completion date: 2003-04-30.
JENICAN COMMUNICATIONS (30101 TOWN CENTER, SUITE 1; small business)
$6,192 with Army for Print/Binding Services. Signed on 2005-03-03. Completion date: 2005-11-15.
NEON DESIGN A-SIGN MFG (26022 CAPE DR STE H; small business)
$6,142 with Navy for Signs, Advertising Displays, and Identification Plates. Signed on 2005-02-15. Completion date: 2005-02-22.
Top industries in this zip code by the number of employees in 2005:


 Nearest zip codes: 92629, 92656, 92653, 92694, 92651, 92624.


 . Federal Facility