Estimated zip code population in 2022: 23,781 Zip code population in 2010: 23,881 Zip code population in 2000: 25,186
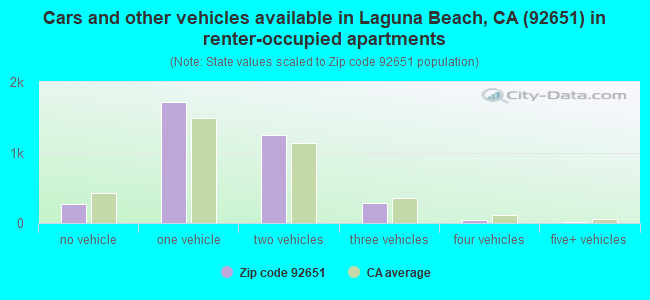
Houses and condos: 14,461 Renter-occupied apartments: 3,573
% of renters here:
32%
State:
44%
March 2022 cost of living index in zip code 92651: 91.6 (less than average, U.S. average is 100)
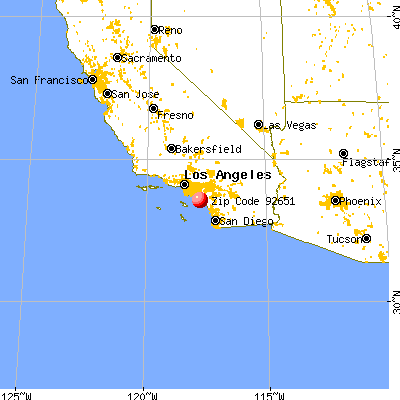
Land area: 19.5 sq. mi. Water area: 2.8 sq. mi.
Population density: 1,222 people per square mile
(low).
OSM Map
General Map
Google Map
MSN Map
OSM Map
General Map
Google Map
MSN Map
OSM Map
General Map
Google Map
MSN Map
OSM Map
General Map
Google Map
MSN Map
Please wait while loading the map...
Real estate property taxes paid for housing units in 2022:
This zip code:
0.5% ($10,292)
California:
0.7% ($4,831)
Median real estate property taxes paid for housing units with mortgages in 2022: $10,330 (0.5%) Median real estate property taxes paid for housing units with no mortgage in 2022: $8,669 (0.4%)
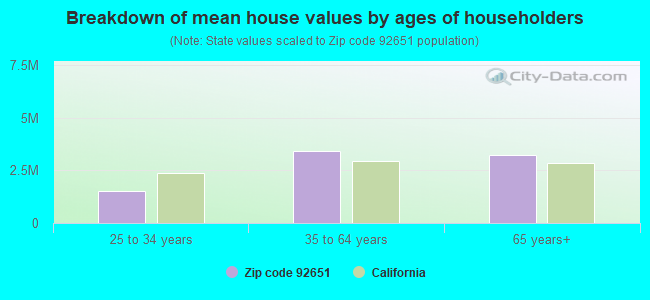
Estimated median house/condo value in 2022: $2,171,698
92651:
$2,171,698
California:
$715,900
According to our research of California and other state lists, there were 7 registered sex offenders living in 92651 zip code as of April 27, 2024. The ratio of all residents to sex offenders in zip code 92651 is 3,566 to 1. The ratio of registered sex offenders to all residents in this zip code is much lower than the state average.
Median resident age:
This zip code:
55.3 years
California median age:
37.9 years
Average household size:
This zip code:
2.1 people
California:
2.8 people
Averages for the 2020 tax year for zip code 92651, filed in 2021:
Average Adjusted Gross Income (AGI) in 2020: $328,037 (Individual Income Tax Returns)
Here:
$328,037
State:
$95,910
Salary/wage: $207,260 (reported on 65.4% of returns)
Here:
$207,260
State:
$77,331
(% of AGI for various income ranges: 1178.1% for AGIs below $25k, 3951.1% for AGIs $25k-50k, 7351.3% for AGIs $50k-75k, 11728.2% for AGIs $75k-100k, 20430.2% for AGIs $100k-200k, 224544.4% for AGIs over 200k)
Taxable interest for individuals: $11,958 (reported on 55.9% of returns)
This zip code:
$11,958
California:
$2,294
(% of AGI for various income ranges: 72.1% for AGIs below $25k, 140.2% for AGIs $25k-50k, 204.9% for AGIs $50k-75k, 389.0% for AGIs $75k-100k, 902.0% for AGIs $100k-200k, 11553.4% for AGIs over 200k)
Ordinary dividends: $38,124 (reported on 47.8% of returns)
Here:
$38,124
State:
$10,949
(% of AGI for various income ranges: 156.8% for AGIs below $25k, 386.8% for AGIs $25k-50k, 599.7% for AGIs $50k-75k, 901.0% for AGIs $75k-100k, 2379.8% for AGIs $100k-200k, 31714.6% for AGIs over 200k)
Net capital gain/loss in AGI: +$150,207 (reported on 47.9% of returns)
Here:
+$150,207
State:
+$49,306
(% of AGI for various income ranges: 105.0% for AGIs below $25k, 303.0% for AGIs $25k-50k, 571.0% for AGIs $50k-75k, 916.2% for AGIs $75k-100k, 2357.2% for AGIs $100k-200k, 141020.2% for AGIs over 200k)
Profit/loss from business: +$38,862 (reported on 27.3% of returns)
Here:
+$38,862
State:
+$15,671
(% of AGI for various income ranges: 309.0% for AGIs below $25k, 729.8% for AGIs $25k-50k, 970.7% for AGIs $50k-75k, 1545.8% for AGIs $75k-100k, 2353.0% for AGIs $100k-200k, 14666.9% for AGIs over 200k)
Taxable individual retirement arrangement distribution: $45,074 (reported on 13.5% of returns)
92651:
$45,074
California:
$23,505
(% of AGI for various income ranges: 99.1% for AGIs below $25k, 291.2% for AGIs $25k-50k, 490.7% for AGIs $50k-75k, 869.3% for AGIs $75k-100k, 2235.7% for AGIs $100k-200k, 7643.9% for AGIs over 200k)
Self-employed (Keogh) retirement plans: $39,543 (reported on 4.0% of returns)
92651:
$39,543
California:
$30,163
(% of AGI for various income ranges: 16.1% for AGIs below $25k, 54.9% for AGIs $50k-75k, 121.5% for AGIs $75k-100k, 218.9% for AGIs $100k-200k, 2710.3% for AGIs over 200k)
Total itemized deductions: $76,124 (reported on 32.4% of returns)
Here:
$76,124
State:
$39,517
(% of AGI for various income ranges: 376.7% for AGIs below $25k, 803.7% for AGIs $25k-50k, 1519.3% for AGIs $50k-75k, 2358.0% for AGIs $75k-100k, 4506.0% for AGIs $100k-200k, 38941.6% for AGIs over 200k)
Charity contributions: $42,049 (reported on 28.4% of returns)
Here:
$42,049
State:
$12,598
(% of AGI for various income ranges: 14.7% for AGIs below $25k, 62.7% for AGIs $25k-50k, 160.8% for AGIs $50k-75k, 308.2% for AGIs $75k-100k, 686.0% for AGIs $100k-200k, 22859.0% for AGIs over 200k)
Taxes paid: $9,203 (reported on 32.4% of returns)
92651:
$9,203
State:
$8,807
(% of AGI for various income ranges: 75.2% for AGIs below $25k, 171.5% for AGIs $25k-50k, 326.7% for AGIs $50k-75k, 576.5% for AGIs $75k-100k, 1046.3% for AGIs $100k-200k, 3528.4% for AGIs over 200k)
Earned income credit: $1,160 (reported on 5.4% of returns)
Here:
$1,160
State:
$2,074
(% of AGI for various income ranges: 38.2% for AGIs below $25k, 28.5% for AGIs $25k-50k)
Percentage of individuals using paid preparers for their 2020 taxes: 93.0%
Here:
93%
State:
92%
(% for various income ranges: 90.9% for AGIs below $25k, 91.7% for AGIs $25k-50k, 92.8% for AGIs $50k-75k, 93.8% for AGIs $75k-100k, 93.9% for AGIs $100k-200k, 94.8% for AGIs over 200k)
Averages for the 2012 tax year for zip code 92651, filed in 2013:
Average Adjusted Gross Income (AGI) in 2012: $315,925 (Individual Income Tax Returns)
Here:
$315,925
State:
$72,726
Salary/wage: $197,262 (reported on 67.7% of returns)
Here:
$197,262
State:
$59,079
(% of AGI for various income ranges: 58.8% for AGIs below $25k, 62.3% for AGIs $25k-50k, 61.6% for AGIs $50k-75k, 55.3% for AGIs $75k-100k, 56.3% for AGIs $100k-200k, 39.4% for AGIs over 200k)
Taxable interest for individuals: $11,509 (reported on 56.3% of returns)
This zip code:
$11,509
California:
$2,146
(% of AGI for various income ranges: 4.4% for AGIs below $25k, 2.7% for AGIs $25k-50k, 2.0% for AGIs $50k-75k, 1.6% for AGIs $75k-100k, 2.2% for AGIs $100k-200k, 2.0% for AGIs over 200k)
Ordinary dividends: $28,700 (reported on 43.1% of returns)
Here:
$28,700
State:
$9,308
(% of AGI for various income ranges: 6.9% for AGIs below $25k, 4.4% for AGIs $25k-50k, 3.8% for AGIs $50k-75k, 3.9% for AGIs $75k-100k, 4.6% for AGIs $100k-200k, 3.8% for AGIs over 200k)
Net capital gain/loss in AGI: +$105,572 (reported on 43.0% of returns)
Here:
+$105,572
State:
+$30,460
(% of AGI for various income ranges: 1.6% for AGIs $25k-50k, 1.5% for AGIs $50k-75k, 2.3% for AGIs $75k-100k, 3.0% for AGIs $100k-200k, 16.6% for AGIs over 200k)
Profit/loss from business: +$35,696 (reported on 28.4% of returns)
Here:
+$35,696
State:
+$17,064
(% of AGI for various income ranges: 23.0% for AGIs below $25k, 13.3% for AGIs $25k-50k, 7.6% for AGIs $50k-75k, 9.0% for AGIs $75k-100k, 8.0% for AGIs $100k-200k, 2.0% for AGIs over 200k)
Taxable individual retirement arrangement distribution: $35,211 (reported on 15.3% of returns)
92651:
$35,211
California:
$19,557
(% of AGI for various income ranges: 5.2% for AGIs below $25k, 3.9% for AGIs $25k-50k, 6.2% for AGIs $50k-75k, 5.2% for AGIs $75k-100k, 5.3% for AGIs $100k-200k, 1.1% for AGIs over 200k)
Self-employment retirement plans: $30,000 (reported on 4.3% of returns)
92651:
$30,000
California:
$24,530
(% of AGI for various income ranges: 0.3% for AGIs below $25k, 0.4% for AGIs $25k-50k, 0.4% for AGIs $50k-75k, 0.7% for AGIs $75k-100k, 0.9% for AGIs $100k-200k, 0.4% for AGIs over 200k)
Total itemized deductions: $92,643 (18% of AGI, reported on 57.9% of returns)
Here:
$92,643
State:
$34,004
Here:
17.8% of AGI
State:
22.7% of AGI
(% of AGI for various income ranges: 37.5% for AGIs below $25k, 21.3% for AGIs $25k-50k, 22.5% for AGIs $50k-75k, 22.9% for AGIs $75k-100k, 24.6% for AGIs $100k-200k, 15.6% for AGIs over 200k)
Charity contributions: $12,903 (reported on 49.5% of returns)
Here:
$12,903
State:
$4,659
(% of AGI for various income ranges: 1.8% for AGIs below $25k, 1.6% for AGIs $25k-50k, 1.9% for AGIs $50k-75k, 2.3% for AGIs $75k-100k, 2.5% for AGIs $100k-200k, 2.0% for AGIs over 200k)
Taxes paid: $58,182 (reported on 57.6% of returns)
92651:
$58,182
State:
$14,448
(% of AGI for various income ranges: 9.0% for AGIs below $25k, 5.1% for AGIs $25k-50k, 6.4% for AGIs $50k-75k, 7.7% for AGIs $75k-100k, 9.6% for AGIs $100k-200k, 11.0% for AGIs over 200k)
Earned income credit: $1,278 (reported on 6.4% of returns)
Here:
$1,278
State:
$2,286
(% of AGI for various income ranges: 2.1% for AGIs below $25k, 0.3% for AGIs $25k-50k)
Percentage of individuals using paid preparers for their 2012 taxes: 74.1%
Here:
74%
State:
64%
(% for various income ranges: 65.8% for AGIs below $25k, 66.0% for AGIs $25k-50k, 70.1% for AGIs $50k-75k, 77.1% for AGIs $75k-100k, 79.2% for AGIs $100k-200k, 87.9% for AGIs over 200k)
Averages for the 2004 tax year for zip code 92651, filed in 2005:
Average Adjusted Gross Income (AGI) in 2004: $167,038 (Individual Income Tax Returns)
Here:
$167,038
State:
$58,600
Salary/wage: $154,920 (reported on 67.3% of returns)
Here:
$154,920
State:
$49,455
(% of AGI for various income ranges: 58.1% for AGIs $10k-25k, 64.3% for AGIs $25k-50k, 62.5% for AGIs $50k-75k, 61.7% for AGIs $75k-100k, 57.3% for AGIs over 100k)
Taxable interest for individuals: $8,779 (reported on 63.9% of returns)
This zip code:
$8,779
California:
$2,365
(% of AGI for various income ranges: 6.2% for AGIs $10k-25k, 3.4% for AGIs $25k-50k, 3.1% for AGIs $50k-75k, 2.7% for AGIs $75k-100k, 2.8% for AGIs over 100k)
Taxable dividends: $15,484 (reported on 48.0% of returns)
Here:
$15,484
State:
$4,746
(% of AGI for various income ranges: 6.1% for AGIs $10k-25k, 3.8% for AGIs $25k-50k, 4.0% for AGIs $50k-75k, 3.1% for AGIs $75k-100k, 4.1% for AGIs over 100k)
Net capital gain/loss: +$81,161 (reported on 46.6% of returns)
Here:
+$81,161
State:
+$23,418
(% of AGI for various income ranges: 0.7% for AGIs $10k-25k, 3.0% for AGIs $25k-50k, 1.9% for AGIs $50k-75k, 2.4% for AGIs $75k-100k, 23.8% for AGIs over 100k)
Profit/loss from business: +$34,781 (reported on 30.2% of returns)
Here:
+$34,781
State:
+$16,826
(% of AGI for various income ranges: 20.0% for AGIs $10k-25k, 13.7% for AGIs $25k-50k, 11.3% for AGIs $50k-75k, 11.5% for AGIs $75k-100k, 5.0% for AGIs over 100k)
IRA payment deduction: $3,672 (reported on 3.9% of returns)
92651:
$3,672
California:
$3,192
(% of AGI for various income ranges: 0.4% for AGIs $10k-25k, 0.4% for AGIs $25k-50k, 0.3% for AGIs $50k-75k, 0.2% for AGIs $75k-100k, 0.0% for AGIs over 100k)
Self-employed pension: $23,981 (reported on 5.4% of returns)
Here:
$23,981
California:
$17,688
(% of AGI for various income ranges: 0.4% for AGIs $10k-25k, 0.7% for AGIs $25k-50k, 0.8% for AGIs $50k-75k, 0.9% for AGIs $75k-100k, 0.7% for AGIs over 100k)
Total itemized deductions: $71,658 (24% of AGI, reported on 57.0% of returns)
Here:
$71,658
State:
$28,113
Here:
24.4% of AGI
State:
25.3% of AGI
(% of AGI for various income ranges: 32.1% for AGIs $10k-25k, 24.8% for AGIs $25k-50k, 26.6% for AGIs $50k-75k, 27.4% for AGIs $75k-100k, 22.1% for AGIs over 100k)
Charity contributions deductions: $15,425 (5% of AGI, reported on 51.7% of returns)
Here:
$15,425
State:
$3,923
Here:
5.0% of AGI
State:
3.3% of AGI
(% of AGI for various income ranges: 2.6% for AGIs $10k-25k, 2.1% for AGIs $25k-50k, 2.6% for AGIs $50k-75k, 2.9% for AGIs $75k-100k, 4.7% for AGIs over 100k)
Total tax: $46,928 (reported on 84.4% of returns)
92651:
$46,928
State:
$10,761
(% of AGI for various income ranges: 7.3% for AGIs $10k-25k, 9.8% for AGIs $25k-50k, 11.6% for AGIs $50k-75k, 12.4% for AGIs $75k-100k, 23.8% for AGIs over 100k)
Earned income credit: $908 (reported on 5.2% of returns)
Here:
$908
State:
$1,763
Percentage of individuals using paid preparers for their 2004 taxes: 74.6%
Here:
75%
State:
66%
(% for various income ranges: 67.1% for AGIs below $10k, 67.9% for AGIs $10k-25k, 66.8% for AGIs $25k-50k, 75.5% for AGIs $50k-75k, 77.3% for AGIs $75k-100k, 85.0% for AGIs over 100k)
Likely homosexual households (counted as self-reported same-sex unmarried-partner households)
Lesbian couples: 0.5% of all households
Gay men: 0.7% of all households
Household received Food Stamps/SNAP in the past 12 months: 383 Household did not receive Food Stamps/SNAP in the past 12 months: 10,692
Women who had a birth in the past 12 months: 107 (50 now married, 57 unmarried) Women who did not have a birth in the past 12 months: 3,614 (1,620 now married, 1,986 unmarried)
Housing units in zip code 92651 with a mortgage: 4,733 (655 second mortgage, 20 home equity loan, 554 both second mortgage and home equity loan) Median monthly owner costs for units with a mortgage: $3,876 Median monthly owner costs for units without a mortgage: $1,294
Residents with income below the poverty level in 2022:
This zip code:
5.4%
Whole state:
12.2%
Residents with income below 50% of the poverty level in 2022:
This zip code:
1.4%
Whole state:
6.2%
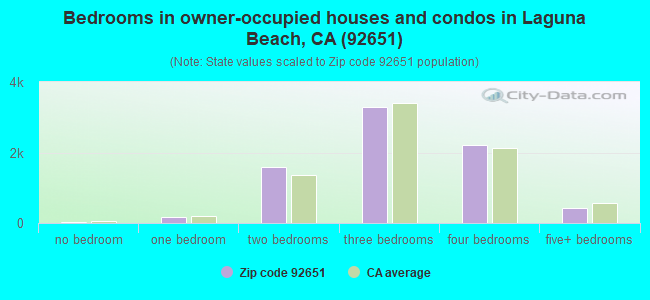
Median number of rooms in houses and condos:
Here:
6.4
State:
6.0
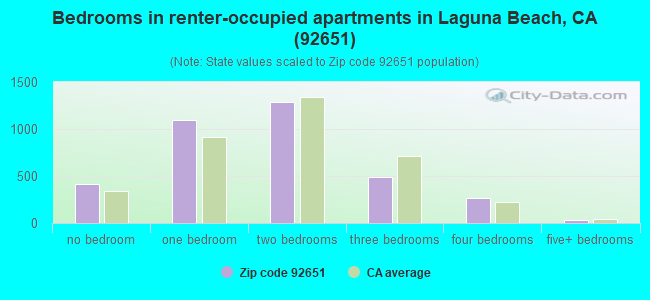
Median number of rooms in apartments:
Here:
4.0
State:
3.9
Notable locations in this zip code not listed on our city pages
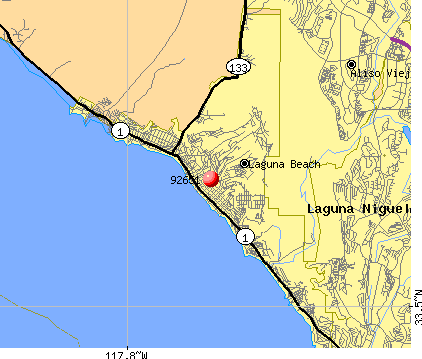
Notable locations in zip code 92651: Aliso Creek Golf Course (A), Laguna Beach Country Club (B), Aliso Pier (C), Laguna Beach City Hall (D), Laguna Beach Branch Orange County Public Library (E), Laguna Museum of Art (F), Festival of the Arts Amphitheater (G), City of Laguna Beach Fire Department Station 4 (H), Orange County Fire Authority Station 11 (I), City of Laguna Beach Fire Department Station 3 (J), City of Laguna Beach Fire Department Station 2 (K), City of Laguna Beach Fire Department Station 1 (L). Display/hide their locations on the map
Shopping Centers: The Pavilions Shopping Center (1), Lumberyard Plaza Shopping Center (2), Boat Canyon Shopping Center (3). Display/hide their locations on the map
Churches in zip code 92651 include: Calvary Evangelical Free Church (A), Cathedral Chapel of Saint Francis By-The Sea (B), The Church of Jesus Christ of Latter Day Saints (C), First Church of Christ Scientist (D), Laguna Beach United Methodist Church (E), Laguna Presbyterian Church (F), Saint Catherine Catholic Church (G), Saint Marys Episcopal Church (H). Display/hide their locations on the map
Parks in zip code 92651 include: Heisler Park (1), Irvine Bowl Park (2), Aliso Beach County Park (3), Laguna Beach Marine Life Refuge (4), Crescent Bay Point Park (5), Crystal Cove State Park (6), Jahraus Park (7), Main Beach Park (8), Swanson Park (9). Display/hide their locations on the map
2,699 married couples with children.
576 single-parent households (210 men, 366 women).
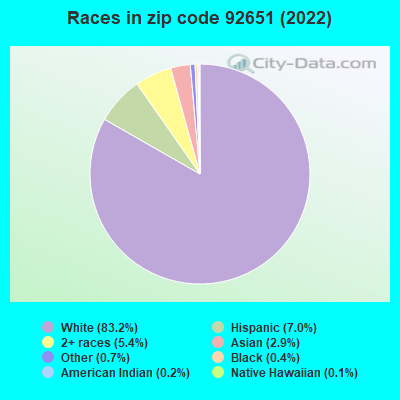
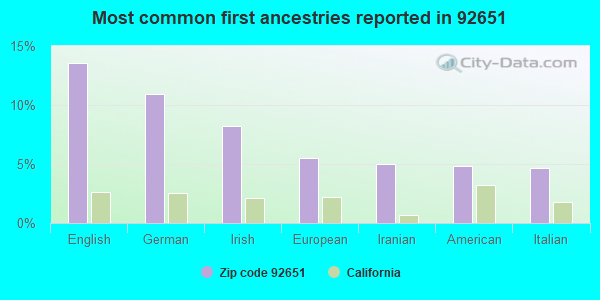
88.4% of residents of 92651 zip code speak English at home.
4.0% of residents speak Spanish at home (66% very well, 31% well, 3% not well).
6.6% of residents speak other Indo-European language at home (83% very well, 12% well, 4% not well, 1% not at all).
1.0% of residents speak Asian or Pacific Island language at home (74% very well, 18% well, 9% not well).
0.4% of residents speak other language at home (100% very well).
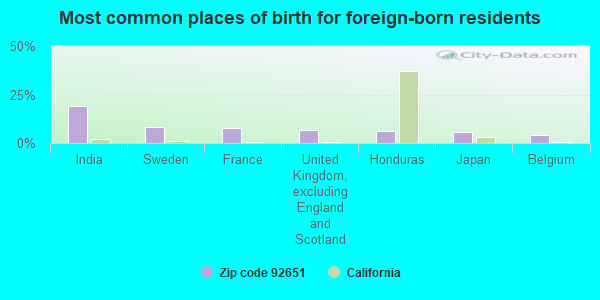
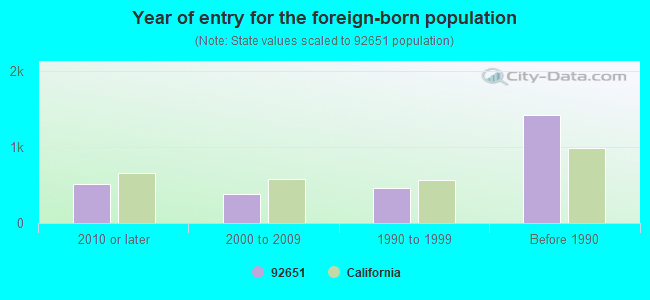
Foreign born population: 2,456 (10.3%) (74.9% of them are naturalized citizens)
Major facilities with environmental interests located in this zip code:
EQUILON ENTERPRISES (32342 PACIFIC COAST HWY in SOUTH LAGUNA, CA) . Federal Facility
STATE MASTER (California - Hazardous Waste Tracking) - HAZARDOU WASTE PROGRAM HAZARDOUS WASTE BIENNIAL REPORTER (Resource Conservation and Recovery Act (tracking hazardous waste)) Small Quantity Generators, between 100 kg and 1000 kg of hazardous waste/month (Resource Conservation and Recovery Act (tracking hazardous waste)) - notification Organizations: EQUILON ENTERPRISES L L C (CONTACT/OWNER)
Alternative names: SHELL OIL CO
LIVE WIRE CLEANERS (439 FOREST AVE in LAGUNA BEACH, CA)
STATE MASTER (California - Hazardous Waste Tracking) - HAZARDOU WASTE PROGRAM Small Quantity Generators, between 100 kg and 1000 kg of hazardous waste/month (Resource Conservation and Recovery Act (tracking hazardous waste)) - notification Organizations: DONG HOON YEOM (CONTACT/OWNER)
Alternative names: D H YEOM, INC LIVE WIRE CLEANERS
ALISO BEACH ANIMAL CLINIC (30816 COAST HWY in LAGUNA BEACH, CA)
STATE MASTER (California - Hazardous Waste Tracking) - HAZARDOU WASTE PROGRAM Small Quantity Generators, between 100 kg and 1000 kg of hazardous waste/month (Resource Conservation and Recovery Act (tracking hazardous waste)) - notification Organizations: SUSAN DAVIS DVM (CONTACT/OWNER)
CHEVRON STATION 91966 (604 S COAST HWY in LAGUNA BEACH, CA)
STATE MASTER (California - Hazardous Waste Tracking) - HAZARDOU WASTE PROGRAM Small Quantity Generators, between 100 kg and 1000 kg of hazardous waste/month (Resource Conservation and Recovery Act (tracking hazardous waste)) - notification Organizations: CHEVRON PRODUCTS CO (CONTACT/OWNER)
EL MORRO ELEMENTARY (8681 NORTH COAST HWY. in LAGUNA BEACH, CA)
(National Center for Education Statistics) - STATE ID-6028906 Organizations: LAGUNA BEACH UNIFIED (SCHOOL DISTRICT)
LAGUNA BEACH HIGH (625 PARK AVE. in LAGUNA BEACH, CA)
(National Center for Education Statistics) - STATE ID-3033206 Organizations: LAGUNA BEACH UNIFIED (SCHOOL DISTRICT)
LAGUNA BEACH UNIFIED SCHOOL DISTRICT (550 BLUMONT STREET in LAGUNA BEACH, CA)
(Integrated Compliance Information System) - ICIS-09-2002-0135, FORMAL ENFORCEMENT ACTION COMPLIANCE ACTIVITY (Tracking inspections of insecticide, fungicide, and rodenticide, and toxic substances) Business SIC classification: SCHOOLS AND EDUCATIONAL SERVICES Alternative names: LAGUNA BEACH UNIF. SCH. DIST. SCH. FAC.
NORTHCOTT WILLIAMS INC SOUTH (21521 OCEAN VISTA DR in SOUTH LAGUNA, CA)
(Resource Conservation and Recovery Act (tracking hazardous waste)) Organizations: DOUG WILLIAMS (CONTACT/OWNER)
AMERICAN DRY CLEANERS (3295 LAGUNA CANYON RD in LAGUNA BEACH, CA)
Small Quantity Generators, between 100 kg and 1000 kg of hazardous waste/month (Resource Conservation and Recovery Act (tracking hazardous waste)) - notification Organizations: ROSA WALKER (CONTACT/OWNER)
HOWARDS FOREIGN CAR SERVICE (2225 LAGUNA CANYON RD in LAGUNA BEACH, CA)
Small Quantity Generators, between 100 kg and 1000 kg of hazardous waste/month (Resource Conservation and Recovery Act (tracking hazardous waste)) - notification Organizations: R M MORRISON D D MORRISON (CONTACT/OWNER)
JIM BUSBY RACING (2205 LAGUNA CANYON RD in LAGUNA BEACH, CA)
Small Quantity Generators, between 100 kg and 1000 kg of hazardous waste/month (Resource Conservation and Recovery Act (tracking hazardous waste)) - notification Business NAICS classification: RACETRACKS. Organizations: BUSBY INDUSTRIES INC (CONTACT/OWNER)
LARRY HUNT AUTO CTR (1825 LAGUNA CYN RD in LAGUNA BEACH, CA)
Small Quantity Generators, between 100 kg and 1000 kg of hazardous waste/month (Resource Conservation and Recovery Act (tracking hazardous waste))
CANON POINTE CLEANERS (2245 LAGUNA CANYON RD in LAGUNA BEACH, CA)
Small Quantity Generators, between 100 kg and 1000 kg of hazardous waste/month (Resource Conservation and Recovery Act (tracking hazardous waste)) - notification Organizations: ADAM FABIAN (CONTACT/OWNER)
Housing units lacking complete plumbing facilities: 0.5% Housing units lacking complete kitchen facilities: 1.2%
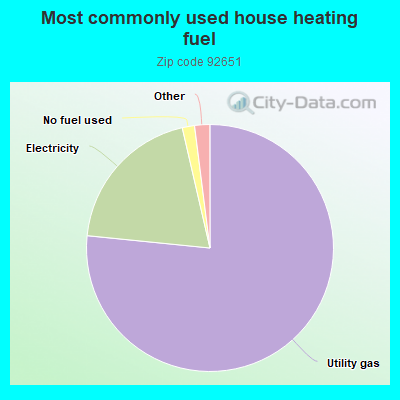
76.6%Utility gas
19.8%Electricity
1.6%No fuel used
1.0%Solar energy
0.8%Bottled, tank, or LP gas
Population in 1990: 20,315. Population change in the 1990s: +4,871 (+24.0%).
Place of birth for U.S.-born residents:
This state: 12,387
Northeast: 2,481
Midwest: 2,594
South: 1,736
West: 1,560
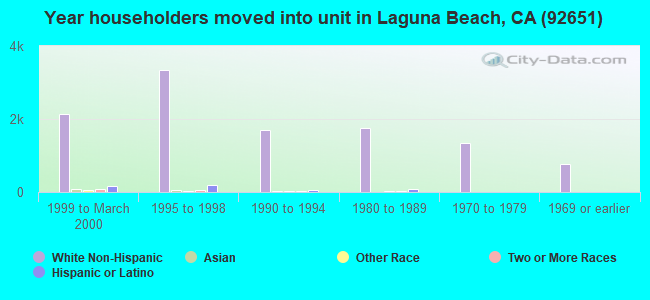
53% of the 92651 zip code residents lived in the same house 5 years ago. Out of people who lived in different houses, 66% lived in this county. Out of people who lived in different counties, 50% lived in California.
88% of the 92651 zip code residents lived in the same house 1 year ago. Out of people who lived in different houses, 53% moved from this county. Out of people who lived in different houses, 29% moved from different county within same state. Out of people who lived in different houses, 11% moved from different state. Out of people who lived in different houses, 5% moved from abroad.
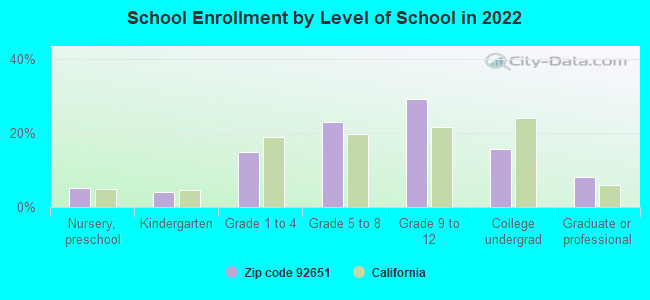
Private vs. public school enrollment:
Students in private schools in grades 1 to 8 (elementary and middle school): 383
Here:
22.4%
California:
10.5%
Students in private schools in grades 9 to 12 (high school): 239
Here:
18.4%
California:
8.5%
Students in private undergraduate colleges: 127
Here:
18.0%
California:
15.9%
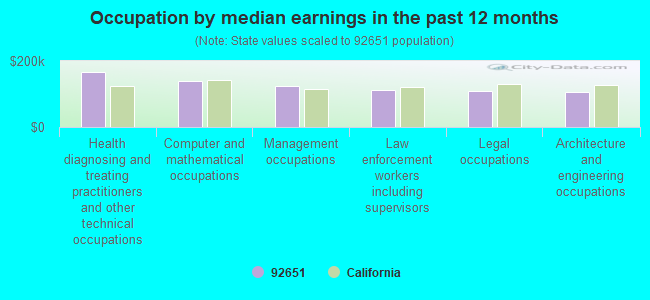
Occupation by median earnings in the past 12 months ($)
166,821Health diagnosing and treating practitioners and other technical occupations
140,623Computer and mathematical occupations
124,322Management occupations
111,911Law enforcement workers including supervisors
109,505Legal occupations
105,815Architecture and engineering occupations
Companies with federal contracts located in this zip code (LAGUNA BEACH, CA):
LAGUNA COMPONENTS, INC (985 TIA JUANA ST; small business) : $179,423 in 8 contractsfrom 2004 to 2006
Contracts for Miscellaneous Electrical and Electronic Components, Connectors, Electrical, Miscellaneous Aircraft Accessories and Components, Wire and Cable, Electrical, and moreby Navy Signed by year:2000: $0; 2001: $0; 2002: $0; 2003: $0; 2004: $86,840; 2005: $83,582; 2006: $9,001.
Biggest contracts:
$86,881 with Navy for Miscellaneous Electrical and Electronic Components. Signed on 2004-09-30. Completion date: 2004-12-23.
$40,100 with Navy for Connectors, Electrical. Signed on 2005-06-13. Completion date: 2005-07-08.
$24,494 with Navy for Miscellaneous Aircraft Accessories and Components. Signed on 2005-09-16. Completion date: 2005-10-11.
$15,440 with Navy for Wire and Cable, Electrical. Signed on 2005-01-21. Completion date: 2005-02-28.
TELONIC BERKELEY (2825 LAGUNA CANYON RD; small business) : $135,872 in 17 contractsfrom 2004 to 2006
Contracts for Miscellaneous Electrical and Electronic Components, Antennas, Waveguides, and Related Equipment, Electrical and Electronic Properties Measuring and Testing Instruments, Centrifugals, Separators, and Pressure and Vacuum Filters, and moreby Army, Navy, Air Force Signed by year:2000: $0; 2001: $0; 2002: $0; 2003: $0; 2004: $8,300; 2005: $101,052; 2006: $26,520.
Biggest contracts:
$46,560 with Army for Miscellaneous Electrical and Electronic Components. Signed on 2005-04-04. Completion date: 2005-06-01.
$11,670 with Navy for Antennas, Waveguides, and Related Equipment. Signed on 2005-04-07. Completion date: 2005-04-29.
$11,422 with Navy for Miscellaneous Electrical and Electronic Components. Signed on 2005-07-07. Completion date: 2005-09-29.
$11,000 with Air Force for Antennas, Waveguides, and Related Equipment. Signed on 2006-03-16. Completion date: 2006-08-16.
INDUSTRIAL DESIGN RESEARCH (3203 BERN CT; small business)
$61,186 with Air Force for Safety and Rescue Equipment. Signed on 2002-09-30. Completion date: 2002-11-26.
SILVER WOLF INCORPORATED (2173 LAGUNA CANYON RD; small business) : $23,794 in 3 contractsin 2004
$15,241 with Navy for ADP Input/Output and Storage Devices. Signed on 2004-08-10. Completion date: 2004-08-26.
$5,670 with Navy for ADP Components. Signed on 2004-11-09. Completion date: 2004-12-17.
$2,883 with Navy for ADP Central Processing Unit (CPU, Computer), Analog. Signed on 2004-06-21. Completion date: 2004-07-12.
BEN BLOUNT (371 MYRTLE ST; small business) : $14,437 in 3 contractsfrom 2002 to 2005
$11,481 with Navy for Video Recording and Reproducing Equipment. Signed on 2005-05-16. Completion date: 2005-06-16.
$2,950 with Public Buildings Service for Office Furniture. Signed on 2004-03-29. Completion date: 2004-04-10.
$6 with Public Buildings Service for Maintenance, Repair or Alteration of Real Property -- Office Buildings. Signed on 2002-01-15. Completion date: 2002-01-15.
PCS ASSOC (949 GLENNEYRE ST; small business)
$10,000 with Defense Logistics Agency for Converters, Electrical, Nonrotating. Signed on 2005-12-05. Completion date: 2006-01-30.
SAFETY GEAR DEPOT, LLC (301 FOREST AVE; small business)
$3,975 with Air Force for Electric Portable and Hand Lighting Equipment. Signed on 2006-03-09. Completion date: 2006-04-09.
Top industries in this zip code by the number of employees in 2005:
2005 - 2016 National Fire Incident Reporting System (NFIRS) incidents
According to the data from the years 2005 - 2016 the average number of fire incidents per year is 15. The highest number of fire incidents - 62 took place in 2005, and the least - 0 in 2009. The data has a decreasing trend.
When looking into fire subcategories, the most incidents belonged to: Structure Fires (38.2%), and Outside Fires (37.1%).
Fire incident types reported to NFIRS in Zip Code 92651


 Nearest zip codes: 92656, 92603, 92637, 92657, 92653, 92677.


 . Federal Facility
 According to the data from the years 2005 - 2016 the average number of fire incidents per year is 15. The highest number of fire incidents - 62 took place in 2005, and the least - 0 in 2009. The data has a decreasing trend.
 When looking into fire subcategories, the most incidents belonged to: Structure Fires (38.2%), and Outside Fires (37.1%).