Laguna Beach, California Submit your own pictures of this city and show them to the world
OSM Map
General Map
Google Map
MSN Map
OSM Map
General Map
Google Map
MSN Map
OSM Map
General Map
Google Map
MSN Map
OSM Map
General Map
Google Map
MSN Map
Please wait while loading the map...
Population in 2022: 22,583 (100% urban, 0% rural). Population change since 2000: -4.8%Males: 11,755 Females: 10,828
March 2022 cost of living index in Laguna Beach: 95.0 (less than average, U.S. average is 100) Percentage of residents living in poverty in 2022: 5.5%for White Non-Hispanic residents , 27.7% for Black residents , 13.0% for Hispanic or Latino residents , 48.5% for Native Hawaiian and other Pacific Islander residents , 13.5% for other race residents , 7.6% for two or more races residents )
Profiles of local businesses
Business Search - 14 Million verified businesses
Data:
Median household income ($)
Median household income (% change since 2000)
Household income diversity
Ratio of average income to average house value (%)
Ratio of average income to average rent
Median household income ($) - White
Median household income ($) - Black or African American
Median household income ($) - Asian
Median household income ($) - Hispanic or Latino
Median household income ($) - American Indian and Alaska Native
Median household income ($) - Multirace
Median household income ($) - Other Race
Median household income for houses/condos with a mortgage ($)
Median household income for apartments without a mortgage ($)
Races - White alone (%)
Races - White alone (% change since 2000)
Races - Black alone (%)
Races - Black alone (% change since 2000)
Races - American Indian alone (%)
Races - American Indian alone (% change since 2000)
Races - Asian alone (%)
Races - Asian alone (% change since 2000)
Races - Hispanic (%)
Races - Hispanic (% change since 2000)
Races - Native Hawaiian and Other Pacific Islander alone (%)
Races - Native Hawaiian and Other Pacific Islander alone (% change since 2000)
Races - Two or more races (%)
Races - Two or more races (% change since 2000)
Races - Other race alone (%)
Races - Other race alone (% change since 2000)
Racial diversity
Unemployment (%)
Unemployment (% change since 2000)
Unemployment (%) - White
Unemployment (%) - Black or African American
Unemployment (%) - Asian
Unemployment (%) - Hispanic or Latino
Unemployment (%) - American Indian and Alaska Native
Unemployment (%) - Multirace
Unemployment (%) - Other Race
Population density (people per square mile)
Population - Males (%)
Population - Females (%)
Population - Males (%) - White
Population - Males (%) - Black or African American
Population - Males (%) - Asian
Population - Males (%) - Hispanic or Latino
Population - Males (%) - American Indian and Alaska Native
Population - Males (%) - Multirace
Population - Males (%) - Other Race
Population - Females (%) - White
Population - Females (%) - Black or African American
Population - Females (%) - Asian
Population - Females (%) - Hispanic or Latino
Population - Females (%) - American Indian and Alaska Native
Population - Females (%) - Multirace
Population - Females (%) - Other Race
Coronavirus confirmed cases (Apr 27, 2024)
Deaths caused by coronavirus (Apr 27, 2024)
Coronavirus confirmed cases (per 100k population) (Apr 27, 2024)
Deaths caused by coronavirus (per 100k population) (Apr 27, 2024)
Daily increase in number of cases (Apr 27, 2024)
Weekly increase in number of cases (Apr 27, 2024)
Cases doubled (in days) (Apr 27, 2024)
Hospitalized patients (Apr 18, 2022)
Negative test results (Apr 18, 2022)
Total test results (Apr 18, 2022)
COVID Vaccine doses distributed (per 100k population) (Sep 19, 2023)
COVID Vaccine doses administered (per 100k population) (Sep 19, 2023)
COVID Vaccine doses distributed (Sep 19, 2023)
COVID Vaccine doses administered (Sep 19, 2023)
Likely homosexual households (%)
Likely homosexual households (% change since 2000)
Likely homosexual households - Lesbian couples (%)
Likely homosexual households - Lesbian couples (% change since 2000)
Likely homosexual households - Gay men (%)
Likely homosexual households - Gay men (% change since 2000)
Cost of living index
Median gross rent ($)
Median contract rent ($)
Median monthly housing costs ($)
Median house or condo value ($)
Median house or condo value ($ change since 2000)
Mean house or condo value by units in structure - 1, detached ($)
Mean house or condo value by units in structure - 1, attached ($)
Mean house or condo value by units in structure - 2 ($)
Mean house or condo value by units in structure by units in structure - 3 or 4 ($)
Mean house or condo value by units in structure - 5 or more ($)
Mean house or condo value by units in structure - Boat, RV, van, etc. ($)
Mean house or condo value by units in structure - Mobile home ($)
Median house or condo value ($) - White
Median house or condo value ($) - Black or African American
Median house or condo value ($) - Asian
Median house or condo value ($) - Hispanic or Latino
Median house or condo value ($) - American Indian and Alaska Native
Median house or condo value ($) - Multirace
Median house or condo value ($) - Other Race
Median resident age
Resident age diversity
Median resident age - Males
Median resident age - Females
Median resident age - White
Median resident age - Black or African American
Median resident age - Asian
Median resident age - Hispanic or Latino
Median resident age - American Indian and Alaska Native
Median resident age - Multirace
Median resident age - Other Race
Median resident age - Males - White
Median resident age - Males - Black or African American
Median resident age - Males - Asian
Median resident age - Males - Hispanic or Latino
Median resident age - Males - American Indian and Alaska Native
Median resident age - Males - Multirace
Median resident age - Males - Other Race
Median resident age - Females - White
Median resident age - Females - Black or African American
Median resident age - Females - Asian
Median resident age - Females - Hispanic or Latino
Median resident age - Females - American Indian and Alaska Native
Median resident age - Females - Multirace
Median resident age - Females - Other Race
Commute - mean travel time to work (minutes)
Travel time to work - Less than 5 minutes (%)
Travel time to work - Less than 5 minutes (% change since 2000)
Travel time to work - 5 to 9 minutes (%)
Travel time to work - 5 to 9 minutes (% change since 2000)
Travel time to work - 10 to 19 minutes (%)
Travel time to work - 10 to 19 minutes (% change since 2000)
Travel time to work - 20 to 29 minutes (%)
Travel time to work - 20 to 29 minutes (% change since 2000)
Travel time to work - 30 to 39 minutes (%)
Travel time to work - 30 to 39 minutes (% change since 2000)
Travel time to work - 40 to 59 minutes (%)
Travel time to work - 40 to 59 minutes (% change since 2000)
Travel time to work - 60 to 89 minutes (%)
Travel time to work - 60 to 89 minutes (% change since 2000)
Travel time to work - 90 or more minutes (%)
Travel time to work - 90 or more minutes (% change since 2000)
Marital status - Never married (%)
Marital status - Now married (%)
Marital status - Separated (%)
Marital status - Widowed (%)
Marital status - Divorced (%)
Median family income ($)
Median family income (% change since 2000)
Median non-family income ($)
Median non-family income (% change since 2000)
Median per capita income ($)
Median per capita income (% change since 2000)
Median family income ($) - White
Median family income ($) - Black or African American
Median family income ($) - Asian
Median family income ($) - Hispanic or Latino
Median family income ($) - American Indian and Alaska Native
Median family income ($) - Multirace
Median family income ($) - Other Race
Median year house/condo built
Median year apartment built
Year house built - Built 2005 or later (%)
Year house built - Built 2000 to 2004 (%)
Year house built - Built 1990 to 1999 (%)
Year house built - Built 1980 to 1989 (%)
Year house built - Built 1970 to 1979 (%)
Year house built - Built 1960 to 1969 (%)
Year house built - Built 1950 to 1959 (%)
Year house built - Built 1940 to 1949 (%)
Year house built - Built 1939 or earlier (%)
Average household size
Household density (households per square mile)
Average household size - White
Average household size - Black or African American
Average household size - Asian
Average household size - Hispanic or Latino
Average household size - American Indian and Alaska Native
Average household size - Multirace
Average household size - Other Race
Occupied housing units (%)
Vacant housing units (%)
Owner occupied housing units (%)
Renter occupied housing units (%)
Vacancy status - For rent (%)
Vacancy status - For sale only (%)
Vacancy status - Rented or sold, not occupied (%)
Vacancy status - For seasonal, recreational, or occasional use (%)
Vacancy status - For migrant workers (%)
Vacancy status - Other vacant (%)
Residents with income below the poverty level (%)
Residents with income below 50% of the poverty level (%)
Children below poverty level (%)
Poor families by family type - Married-couple family (%)
Poor families by family type - Male, no wife present (%)
Poor families by family type - Female, no husband present (%)
Poverty status for native-born residents (%)
Poverty status for foreign-born residents (%)
Poverty among high school graduates not in families (%)
Poverty among people who did not graduate high school not in families (%)
Residents with income below the poverty level (%) - White
Residents with income below the poverty level (%) - Black or African American
Residents with income below the poverty level (%) - Asian
Residents with income below the poverty level (%) - Hispanic or Latino
Residents with income below the poverty level (%) - American Indian and Alaska Native
Residents with income below the poverty level (%) - Multirace
Residents with income below the poverty level (%) - Other Race
Air pollution - Air Quality Index (AQI)
Air pollution - CO
Air pollution - NO2
Air pollution - SO2
Air pollution - Ozone
Air pollution - PM10
Air pollution - PM25
Air pollution - Pb
Crime - Murders per 100,000 population
Crime - Rapes per 100,000 population
Crime - Robberies per 100,000 population
Crime - Assaults per 100,000 population
Crime - Burglaries per 100,000 population
Crime - Thefts per 100,000 population
Crime - Auto thefts per 100,000 population
Crime - Arson per 100,000 population
Crime - City-data.com crime index
Crime - Violent crime index
Crime - Property crime index
Crime - Murders per 100,000 population (5 year average)
Crime - Rapes per 100,000 population (5 year average)
Crime - Robberies per 100,000 population (5 year average)
Crime - Assaults per 100,000 population (5 year average)
Crime - Burglaries per 100,000 population (5 year average)
Crime - Thefts per 100,000 population (5 year average)
Crime - Auto thefts per 100,000 population (5 year average)
Crime - Arson per 100,000 population (5 year average)
Crime - City-data.com crime index (5 year average)
Crime - Violent crime index (5 year average)
Crime - Property crime index (5 year average)
1996 Presidential Elections Results (%) - Democratic Party (Clinton)
1996 Presidential Elections Results (%) - Republican Party (Dole)
1996 Presidential Elections Results (%) - Other
2000 Presidential Elections Results (%) - Democratic Party (Gore)
2000 Presidential Elections Results (%) - Republican Party (Bush)
2000 Presidential Elections Results (%) - Other
2004 Presidential Elections Results (%) - Democratic Party (Kerry)
2004 Presidential Elections Results (%) - Republican Party (Bush)
2004 Presidential Elections Results (%) - Other
2008 Presidential Elections Results (%) - Democratic Party (Obama)
2008 Presidential Elections Results (%) - Republican Party (McCain)
2008 Presidential Elections Results (%) - Other
2012 Presidential Elections Results (%) - Democratic Party (Obama)
2012 Presidential Elections Results (%) - Republican Party (Romney)
2012 Presidential Elections Results (%) - Other
2016 Presidential Elections Results (%) - Democratic Party (Clinton)
2016 Presidential Elections Results (%) - Republican Party (Trump)
2016 Presidential Elections Results (%) - Other
2020 Presidential Elections Results (%) - Democratic Party (Biden)
2020 Presidential Elections Results (%) - Republican Party (Trump)
2020 Presidential Elections Results (%) - Other
Ancestries Reported - Arab (%)
Ancestries Reported - Czech (%)
Ancestries Reported - Danish (%)
Ancestries Reported - Dutch (%)
Ancestries Reported - English (%)
Ancestries Reported - French (%)
Ancestries Reported - French Canadian (%)
Ancestries Reported - German (%)
Ancestries Reported - Greek (%)
Ancestries Reported - Hungarian (%)
Ancestries Reported - Irish (%)
Ancestries Reported - Italian (%)
Ancestries Reported - Lithuanian (%)
Ancestries Reported - Norwegian (%)
Ancestries Reported - Polish (%)
Ancestries Reported - Portuguese (%)
Ancestries Reported - Russian (%)
Ancestries Reported - Scotch-Irish (%)
Ancestries Reported - Scottish (%)
Ancestries Reported - Slovak (%)
Ancestries Reported - Subsaharan African (%)
Ancestries Reported - Swedish (%)
Ancestries Reported - Swiss (%)
Ancestries Reported - Ukrainian (%)
Ancestries Reported - United States (%)
Ancestries Reported - Welsh (%)
Ancestries Reported - West Indian (%)
Ancestries Reported - Other (%)
Educational Attainment - No schooling completed (%)
Educational Attainment - Less than high school (%)
Educational Attainment - High school or equivalent (%)
Educational Attainment - Less than 1 year of college (%)
Educational Attainment - 1 or more years of college (%)
Educational Attainment - Associate degree (%)
Educational Attainment - Bachelor's degree (%)
Educational Attainment - Master's degree (%)
Educational Attainment - Professional school degree (%)
Educational Attainment - Doctorate degree (%)
School Enrollment - Nursery, preschool (%)
School Enrollment - Kindergarten (%)
School Enrollment - Grade 1 to 4 (%)
School Enrollment - Grade 5 to 8 (%)
School Enrollment - Grade 9 to 12 (%)
School Enrollment - College undergrad (%)
School Enrollment - Graduate or professional (%)
School Enrollment - Not enrolled in school (%)
School enrollment - Public schools (%)
School enrollment - Private schools (%)
School enrollment - Not enrolled (%)
Median number of rooms in houses and condos
Median number of rooms in apartments
Housing units lacking complete plumbing facilities (%)
Housing units lacking complete kitchen facilities (%)
Density of houses
Urban houses (%)
Rural houses (%)
Households with people 60 years and over (%)
Households with people 65 years and over (%)
Households with people 75 years and over (%)
Households with one or more nonrelatives (%)
Households with no nonrelatives (%)
Population in households (%)
Family households (%)
Nonfamily households (%)
Population in families (%)
Family households with own children (%)
Median number of bedrooms in owner occupied houses
Mean number of bedrooms in owner occupied houses
Median number of bedrooms in renter occupied houses
Mean number of bedrooms in renter occupied houses
Median number of vehichles in owner occupied houses
Mean number of vehichles in owner occupied houses
Median number of vehichles in renter occupied houses
Mean number of vehichles in renter occupied houses
Mortgage status - with mortgage (%)
Mortgage status - with second mortgage (%)
Mortgage status - with home equity loan (%)
Mortgage status - with both second mortgage and home equity loan (%)
Mortgage status - without a mortgage (%)
Average family size
Average family size - White
Average family size - Black or African American
Average family size - Asian
Average family size - Hispanic or Latino
Average family size - American Indian and Alaska Native
Average family size - Multirace
Average family size - Other Race
Geographical mobility - Same house 1 year ago (%)
Geographical mobility - Moved within same county (%)
Geographical mobility - Moved from different county within same state (%)
Geographical mobility - Moved from different state (%)
Geographical mobility - Moved from abroad (%)
Place of birth - Born in state of residence (%)
Place of birth - Born in other state (%)
Place of birth - Native, outside of US (%)
Place of birth - Foreign born (%)
Housing units in structures - 1, detached (%)
Housing units in structures - 1, attached (%)
Housing units in structures - 2 (%)
Housing units in structures - 3 or 4 (%)
Housing units in structures - 5 to 9 (%)
Housing units in structures - 10 to 19 (%)
Housing units in structures - 20 to 49 (%)
Housing units in structures - 50 or more (%)
Housing units in structures - Mobile home (%)
Housing units in structures - Boat, RV, van, etc. (%)
House/condo owner moved in on average (years ago)
Renter moved in on average (years ago)
Year householder moved into unit - Moved in 1999 to March 2000 (%)
Year householder moved into unit - Moved in 1995 to 1998 (%)
Year householder moved into unit - Moved in 1990 to 1994 (%)
Year householder moved into unit - Moved in 1980 to 1989 (%)
Year householder moved into unit - Moved in 1970 to 1979 (%)
Year householder moved into unit - Moved in 1969 or earlier (%)
Means of transportation to work - Drove car alone (%)
Means of transportation to work - Carpooled (%)
Means of transportation to work - Public transportation (%)
Means of transportation to work - Bus or trolley bus (%)
Means of transportation to work - Streetcar or trolley car (%)
Means of transportation to work - Subway or elevated (%)
Means of transportation to work - Railroad (%)
Means of transportation to work - Ferryboat (%)
Means of transportation to work - Taxicab (%)
Means of transportation to work - Motorcycle (%)
Means of transportation to work - Bicycle (%)
Means of transportation to work - Walked (%)
Means of transportation to work - Other means (%)
Working at home (%)
Industry diversity
Most Common Industries - Agriculture, forestry, fishing and hunting, and mining (%)
Most Common Industries - Agriculture, forestry, fishing and hunting (%)
Most Common Industries - Mining, quarrying, and oil and gas extraction (%)
Most Common Industries - Construction (%)
Most Common Industries - Manufacturing (%)
Most Common Industries - Wholesale trade (%)
Most Common Industries - Retail trade (%)
Most Common Industries - Transportation and warehousing, and utilities (%)
Most Common Industries - Transportation and warehousing (%)
Most Common Industries - Utilities (%)
Most Common Industries - Information (%)
Most Common Industries - Finance and insurance, and real estate and rental and leasing (%)
Most Common Industries - Finance and insurance (%)
Most Common Industries - Real estate and rental and leasing (%)
Most Common Industries - Professional, scientific, and management, and administrative and waste management services (%)
Most Common Industries - Professional, scientific, and technical services (%)
Most Common Industries - Management of companies and enterprises (%)
Most Common Industries - Administrative and support and waste management services (%)
Most Common Industries - Educational services, and health care and social assistance (%)
Most Common Industries - Educational services (%)
Most Common Industries - Health care and social assistance (%)
Most Common Industries - Arts, entertainment, and recreation, and accommodation and food services (%)
Most Common Industries - Arts, entertainment, and recreation (%)
Most Common Industries - Accommodation and food services (%)
Most Common Industries - Other services, except public administration (%)
Most Common Industries - Public administration (%)
Occupation diversity
Most Common Occupations - Management, business, science, and arts occupations (%)
Most Common Occupations - Management, business, and financial occupations (%)
Most Common Occupations - Management occupations (%)
Most Common Occupations - Business and financial operations occupations (%)
Most Common Occupations - Computer, engineering, and science occupations (%)
Most Common Occupations - Computer and mathematical occupations (%)
Most Common Occupations - Architecture and engineering occupations (%)
Most Common Occupations - Life, physical, and social science occupations (%)
Most Common Occupations - Education, legal, community service, arts, and media occupations (%)
Most Common Occupations - Community and social service occupations (%)
Most Common Occupations - Legal occupations (%)
Most Common Occupations - Education, training, and library occupations (%)
Most Common Occupations - Arts, design, entertainment, sports, and media occupations (%)
Most Common Occupations - Healthcare practitioners and technical occupations (%)
Most Common Occupations - Health diagnosing and treating practitioners and other technical occupations (%)
Most Common Occupations - Health technologists and technicians (%)
Most Common Occupations - Service occupations (%)
Most Common Occupations - Healthcare support occupations (%)
Most Common Occupations - Protective service occupations (%)
Most Common Occupations - Fire fighting and prevention, and other protective service workers including supervisors (%)
Most Common Occupations - Law enforcement workers including supervisors (%)
Most Common Occupations - Food preparation and serving related occupations (%)
Most Common Occupations - Building and grounds cleaning and maintenance occupations (%)
Most Common Occupations - Personal care and service occupations (%)
Most Common Occupations - Sales and office occupations (%)
Most Common Occupations - Sales and related occupations (%)
Most Common Occupations - Office and administrative support occupations (%)
Most Common Occupations - Natural resources, construction, and maintenance occupations (%)
Most Common Occupations - Farming, fishing, and forestry occupations (%)
Most Common Occupations - Construction and extraction occupations (%)
Most Common Occupations - Installation, maintenance, and repair occupations (%)
Most Common Occupations - Production, transportation, and material moving occupations (%)
Most Common Occupations - Production occupations (%)
Most Common Occupations - Transportation occupations (%)
Most Common Occupations - Material moving occupations (%)
People in Group quarters - Institutionalized population (%)
People in Group quarters - Correctional institutions (%)
People in Group quarters - Federal prisons and detention centers (%)
People in Group quarters - Halfway houses (%)
People in Group quarters - Local jails and other confinement facilities (including police lockups) (%)
People in Group quarters - Military disciplinary barracks (%)
People in Group quarters - State prisons (%)
People in Group quarters - Other types of correctional institutions (%)
People in Group quarters - Nursing homes (%)
People in Group quarters - Hospitals/wards, hospices, and schools for the handicapped (%)
People in Group quarters - Hospitals/wards and hospices for chronically ill (%)
People in Group quarters - Hospices or homes for chronically ill (%)
People in Group quarters - Military hospitals or wards for chronically ill (%)
People in Group quarters - Other hospitals or wards for chronically ill (%)
People in Group quarters - Hospitals or wards for drug/alcohol abuse (%)
People in Group quarters - Mental (Psychiatric) hospitals or wards (%)
People in Group quarters - Schools, hospitals, or wards for the mentally retarded (%)
People in Group quarters - Schools, hospitals, or wards for the physically handicapped (%)
People in Group quarters - Institutions for the deaf (%)
People in Group quarters - Institutions for the blind (%)
People in Group quarters - Orthopedic wards and institutions for the physically handicapped (%)
People in Group quarters - Wards in general hospitals for patients who have no usual home elsewhere (%)
People in Group quarters - Wards in military hospitals for patients who have no usual home elsewhere (%)
People in Group quarters - Juvenile institutions (%)
People in Group quarters - Long-term care (%)
People in Group quarters - Homes for abused, dependent, and neglected children (%)
People in Group quarters - Residential treatment centers for emotionally disturbed children (%)
People in Group quarters - Training schools for juvenile delinquents (%)
People in Group quarters - Short-term care, detention or diagnostic centers for delinquent children (%)
People in Group quarters - Type of juvenile institution unknown (%)
People in Group quarters - Noninstitutionalized population (%)
People in Group quarters - College dormitories (includes college quarters off campus) (%)
People in Group quarters - Military quarters (%)
People in Group quarters - On base (%)
People in Group quarters - Barracks, unaccompanied personnel housing (UPH), (Enlisted/Officer), ;and similar group living quarters for military personnel (%)
People in Group quarters - Transient quarters for temporary residents (%)
People in Group quarters - Military ships (%)
People in Group quarters - Group homes (%)
People in Group quarters - Homes or halfway houses for drug/alcohol abuse (%)
People in Group quarters - Homes for the mentally ill (%)
People in Group quarters - Homes for the mentally retarded (%)
People in Group quarters - Homes for the physically handicapped (%)
People in Group quarters - Other group homes (%)
People in Group quarters - Religious group quarters (%)
People in Group quarters - Dormitories (%)
People in Group quarters - Agriculture workers' dormitories on farms (%)
People in Group quarters - Job Corps and vocational training facilities (%)
People in Group quarters - Other workers' dormitories (%)
People in Group quarters - Crews of maritime vessels (%)
People in Group quarters - Other nonhousehold living situations (%)
People in Group quarters - Other noninstitutional group quarters (%)
Residents speaking English at home (%)
Residents speaking English at home - Born in the United States (%)
Residents speaking English at home - Native, born elsewhere (%)
Residents speaking English at home - Foreign born (%)
Residents speaking Spanish at home (%)
Residents speaking Spanish at home - Born in the United States (%)
Residents speaking Spanish at home - Native, born elsewhere (%)
Residents speaking Spanish at home - Foreign born (%)
Residents speaking other language at home (%)
Residents speaking other language at home - Born in the United States (%)
Residents speaking other language at home - Native, born elsewhere (%)
Residents speaking other language at home - Foreign born (%)
Class of Workers - Employee of private company (%)
Class of Workers - Self-employed in own incorporated business (%)
Class of Workers - Private not-for-profit wage and salary workers (%)
Class of Workers - Local government workers (%)
Class of Workers - State government workers (%)
Class of Workers - Federal government workers (%)
Class of Workers - Self-employed workers in own not incorporated business and Unpaid family workers (%)
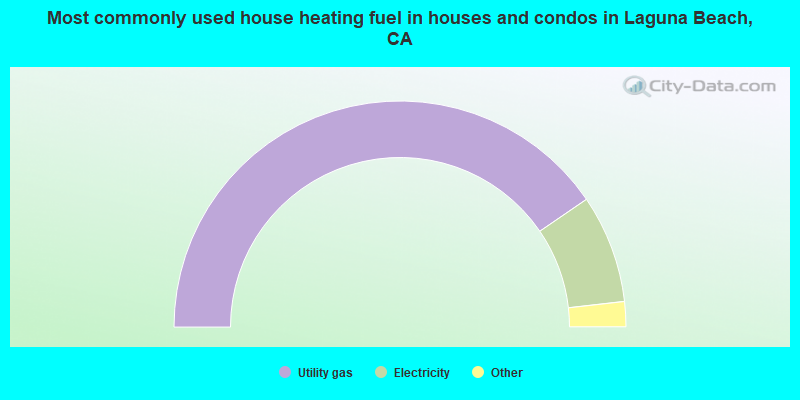
House heating fuel used in houses and condos - Utility gas (%)
House heating fuel used in houses and condos - Bottled, tank, or LP gas (%)
House heating fuel used in houses and condos - Electricity (%)
House heating fuel used in houses and condos - Fuel oil, kerosene, etc. (%)
House heating fuel used in houses and condos - Coal or coke (%)
House heating fuel used in houses and condos - Wood (%)
House heating fuel used in houses and condos - Solar energy (%)
House heating fuel used in houses and condos - Other fuel (%)
House heating fuel used in houses and condos - No fuel used (%)
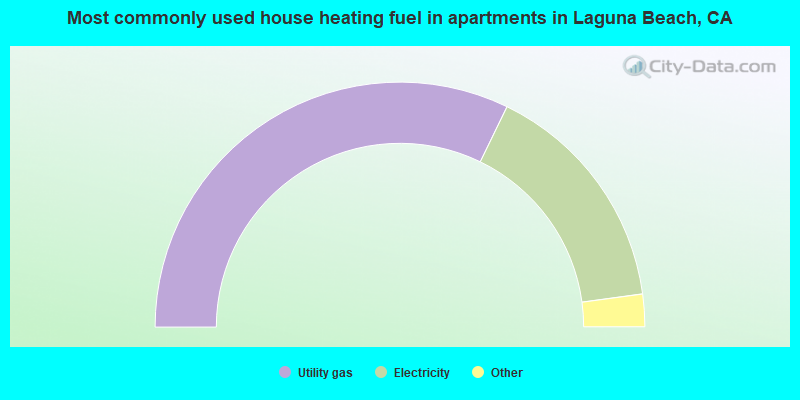
House heating fuel used in apartments - Utility gas (%)
House heating fuel used in apartments - Bottled, tank, or LP gas (%)
House heating fuel used in apartments - Electricity (%)
House heating fuel used in apartments - Fuel oil, kerosene, etc. (%)
House heating fuel used in apartments - Coal or coke (%)
House heating fuel used in apartments - Wood (%)
House heating fuel used in apartments - Solar energy (%)
House heating fuel used in apartments - Other fuel (%)
House heating fuel used in apartments - No fuel used (%)
Armed forces status - In Armed Forces (%)
Armed forces status - Civilian (%)
Armed forces status - Civilian - Veteran (%)
Armed forces status - Civilian - Nonveteran (%)
Fatal accidents locations in years 2005-2021
Fatal accidents locations in 2005
Fatal accidents locations in 2006
Fatal accidents locations in 2007
Fatal accidents locations in 2008
Fatal accidents locations in 2009
Fatal accidents locations in 2010
Fatal accidents locations in 2011
Fatal accidents locations in 2012
Fatal accidents locations in 2013
Fatal accidents locations in 2014
Fatal accidents locations in 2015
Fatal accidents locations in 2016
Fatal accidents locations in 2017
Fatal accidents locations in 2018
Fatal accidents locations in 2019
Fatal accidents locations in 2020
Fatal accidents locations in 2021
Alcohol use - People drinking some alcohol every month (%)
Alcohol use - People not drinking at all (%)
Alcohol use - Average days/month drinking alcohol
Alcohol use - Average drinks/week
Alcohol use - Average days/year people drink much
Audiometry - Average condition of hearing (%)
Audiometry - People that can hear a whisper from across a quiet room (%)
Audiometry - People that can hear normal voice from across a quiet room (%)
Audiometry - Ears ringing, roaring, buzzing (%)
Audiometry - Had a job exposure to loud noise (%)
Audiometry - Had off-work exposure to loud noise (%)
Blood Pressure & Cholesterol - Has high blood pressure (%)
Blood Pressure & Cholesterol - Checking blood pressure at home (%)
Blood Pressure & Cholesterol - Frequently checking blood cholesterol (%)
Blood Pressure & Cholesterol - Has high cholesterol level (%)
Consumer Behavior - Money monthly spent on food at supermarket/grocery store
Consumer Behavior - Money monthly spent on food at other stores
Consumer Behavior - Money monthly spent on eating out
Consumer Behavior - Money monthly spent on carryout/delivered foods
Consumer Behavior - Income spent on food at supermarket/grocery store (%)
Consumer Behavior - Income spent on food at other stores (%)
Consumer Behavior - Income spent on eating out (%)
Consumer Behavior - Income spent on carryout/delivered foods (%)
Current Health Status - General health condition (%)
Current Health Status - Blood donors (%)
Current Health Status - Has blood ever tested for HIV virus (%)
Current Health Status - Left-handed people (%)
Dermatology - People using sunscreen (%)
Diabetes - Diabetics (%)
Diabetes - Had a blood test for high blood sugar (%)
Diabetes - People taking insulin (%)
Diet Behavior & Nutrition - Diet health (%)
Diet Behavior & Nutrition - Milk product consumption (# of products/month)
Diet Behavior & Nutrition - Meals not home prepared (#/week)
Diet Behavior & Nutrition - Meals from fast food or pizza place (#/week)
Diet Behavior & Nutrition - Ready-to-eat foods (#/month)
Diet Behavior & Nutrition - Frozen meals/pizza (#/month)
Drug Use - People that ever used marijuana or hashish (%)
Drug Use - Ever used hard drugs (%)
Drug Use - Ever used any form of cocaine (%)
Drug Use - Ever used heroin (%)
Drug Use - Ever used methamphetamine (%)
Health Insurance - People covered by health insurance (%)
Kidney Conditions-Urology - Avg. # of times urinating at night
Medical Conditions - People with asthma (%)
Medical Conditions - People with anemia (%)
Medical Conditions - People with psoriasis (%)
Medical Conditions - People with overweight (%)
Medical Conditions - Elderly people having difficulties in thinking or remembering (%)
Medical Conditions - People who ever received blood transfusion (%)
Medical Conditions - People having trouble seeing even with glass/contacts (%)
Medical Conditions - People with arthritis (%)
Medical Conditions - People with gout (%)
Medical Conditions - People with congestive heart failure (%)
Medical Conditions - People with coronary heart disease (%)
Medical Conditions - People with angina pectoris (%)
Medical Conditions - People who ever had heart attack (%)
Medical Conditions - People who ever had stroke (%)
Medical Conditions - People with emphysema (%)
Medical Conditions - People with thyroid problem (%)
Medical Conditions - People with chronic bronchitis (%)
Medical Conditions - People with any liver condition (%)
Medical Conditions - People who ever had cancer or malignancy (%)
Mental Health - People who have little interest in doing things (%)
Mental Health - People feeling down, depressed, or hopeless (%)
Mental Health - People who have trouble sleeping or sleeping too much (%)
Mental Health - People feeling tired or having little energy (%)
Mental Health - People with poor appetite or overeating (%)
Mental Health - People feeling bad about themself (%)
Mental Health - People who have trouble concentrating on things (%)
Mental Health - People moving or speaking slowly or too fast (%)
Mental Health - People having thoughts they would be better off dead (%)
Oral Health - Average years since last visit a dentist
Oral Health - People embarrassed because of mouth (%)
Oral Health - People with gum disease (%)
Oral Health - General health of teeth and gums (%)
Oral Health - Average days a week using dental floss/device
Oral Health - Average days a week using mouthwash for dental problem
Oral Health - Average number of teeth
Pesticide Use - Households using pesticides to control insects (%)
Pesticide Use - Households using pesticides to kill weeds (%)
Physical Activity - People doing vigorous-intensity work activities (%)
Physical Activity - People doing moderate-intensity work activities (%)
Physical Activity - People walking or bicycling (%)
Physical Activity - People doing vigorous-intensity recreational activities (%)
Physical Activity - People doing moderate-intensity recreational activities (%)
Physical Activity - Average hours a day doing sedentary activities
Physical Activity - Average hours a day watching TV or videos
Physical Activity - Average hours a day using computer
Physical Functioning - People having limitations keeping them from working (%)
Physical Functioning - People limited in amount of work they can do (%)
Physical Functioning - People that need special equipment to walk (%)
Physical Functioning - People experiencing confusion/memory problems (%)
Physical Functioning - People requiring special healthcare equipment (%)
Prescription Medications - Average number of prescription medicines taking
Preventive Aspirin Use - Adults 40+ taking low-dose aspirin (%)
Reproductive Health - Vaginal deliveries (%)
Reproductive Health - Cesarean deliveries (%)
Reproductive Health - Deliveries resulted in a live birth (%)
Reproductive Health - Pregnancies resulted in a delivery (%)
Reproductive Health - Women breastfeeding newborns (%)
Reproductive Health - Women that had a hysterectomy (%)
Reproductive Health - Women that had both ovaries removed (%)
Reproductive Health - Women that have ever taken birth control pills (%)
Reproductive Health - Women taking birth control pills (%)
Reproductive Health - Women that have ever used Depo-Provera or injectables (%)
Reproductive Health - Women that have ever used female hormones (%)
Sexual Behavior - People 18+ that ever had sex (vaginal, anal, or oral) (%)
Sexual Behavior - Males 18+ that ever had vaginal sex with a woman (%)
Sexual Behavior - Males 18+ that ever performed oral sex on a woman (%)
Sexual Behavior - Males 18+ that ever had anal sex with a woman (%)
Sexual Behavior - Males 18+ that ever had any sex with a man (%)
Sexual Behavior - Females 18+ that ever had vaginal sex with a man (%)
Sexual Behavior - Females 18+ that ever performed oral sex on a man (%)
Sexual Behavior - Females 18+ that ever had anal sex with a man (%)
Sexual Behavior - Females 18+ that ever had any kind of sex with a woman (%)
Sexual Behavior - Average age people first had sex
Sexual Behavior - Average number of female sex partners in lifetime (males 18+)
Sexual Behavior - Average number of female vaginal sex partners in lifetime (males 18+)
Sexual Behavior - Average age people first performed oral sex on a woman (18+)
Sexual Behavior - Average number of woman performed oral sex on in lifetime (18+)
Sexual Behavior - Average number of male sex partners in lifetime (males 18+)
Sexual Behavior - Average number of male anal sex partners in lifetime (males 18+)
Sexual Behavior - Average age people first performed oral sex on a man (18+)
Sexual Behavior - Average number of male oral sex partners in lifetime (18+)
Sexual Behavior - People using protection when performing oral sex (%)
Sexual Behavior - Average number of times people have vaginal or anal sex a year
Sexual Behavior - People having sex without condom (%)
Sexual Behavior - Average number of male sex partners in lifetime (females 18+)
Sexual Behavior - Average number of male vaginal sex partners in lifetime (females 18+)
Sexual Behavior - Average number of female sex partners in lifetime (females 18+)
Sexual Behavior - Circumcised males 18+ (%)
Sleep Disorders - Average hours sleeping at night
Sleep Disorders - People that has trouble sleeping (%)
Smoking-Cigarette Use - People smoking cigarettes (%)
Taste & Smell - People 40+ having problems with smell (%)
Taste & Smell - People 40+ having problems with taste (%)
Taste & Smell - People 40+ that ever had wisdom teeth removed (%)
Taste & Smell - People 40+ that ever had tonsils teeth removed (%)
Taste & Smell - People 40+ that ever had a loss of consciousness because of a head injury (%)
Taste & Smell - People 40+ that ever had a broken nose or other serious injury to face or skull (%)
Taste & Smell - People 40+ that ever had two or more sinus infections (%)
Weight - Average height (inches)
Weight - Average weight (pounds)
Weight - Average BMI
Weight - People that are obese (%)
Weight - People that ever were obese (%)
Weight - People trying to lose weight (%)
18,208 80.0% White alone 1,615 7.1% Hispanic 1,429 6.3% Two or more races 724 3.2% Asian alone 217 1.0% Other race alone 94 0.4% Black alone 36 0.2% Native Hawaiian and Other
According to our research of California and other state lists, there were 9 registered sex offenders living in Laguna Beach, California as of April 27, 2024 . The ratio of all residents to sex offenders in Laguna Beach is 2,611 to 1.The ratio of registered sex offenders to all residents in this city is much lower than the state average.
Officers per 1,000 residents here:
2.29California average:
2.30
Latest news from Laguna Beach, CA collected exclusively by city-data.com from local newspapers, TV, and radio stations
Laguna Beach, CA City Guides: Ancestries: English (10.6%), German (9.7%), Irish (7.6%), European (7.0%), American (5.2%), Iranian (4.7%).
Current Local Time:
Land area: 8.85 square miles.
Population density: 2,552 people per square mile (average).
2,460 residents are foreign born (4.1% Europe , 4.1% Asia , 1.1% Latin America ).
This city:
10.8%California:
26.5%
Median real estate property taxes paid for housing units with mortgages in 2022: $10,194 (0.5%)Median real estate property taxes paid for housing units with no mortgage in 2022: $8,378 (0.4%)
Nearest city with pop. 50,000+: Laguna Niguel, CA
Nearest city with pop. 200,000+: South Coast, CA (4.2 miles
Nearest city with pop. 1,000,000+: Los Angeles, CA
Nearest cities:
Latitude: 33.53 N, Longitude: 117.77 W
Daytime population change due to commuting: +4,311 (+18.9%)Workers who live and work in this city: 5,925 (53.4%)
Laguna Beach tourist attractions:
Single-family new house construction building permits:
2022: 78 buildings , average cost: $410,0002021: 60 buildings , average cost: $448,3002020: 23 buildings , average cost: $346,2002019: 22 buildings , average cost: $655,0002018: 16 buildings , average cost: $839,4002017: 31 buildings , average cost: $847,4002016: 21 buildings , average cost: $645,3002015: 16 buildings , average cost: $641,9002014: 22 buildings , average cost: $593,3002013: 17 buildings , average cost: $792,5002012: 21 buildings , average cost: $779,1002011: 13 buildings , average cost: $698,3002010: 19 buildings , average cost: $857,8002009: 21 buildings , average cost: $745,6002008: 34 buildings , average cost: $695,8002007: 28 buildings , average cost: $508,8002006: 48 buildings , average cost: $547,8002005: 47 buildings , average cost: $539,3002004: 49 buildings , average cost: $462,8002003: 38 buildings , average cost: $490,2002002: 50 buildings , average cost: $361,6002001: 47 buildings , average cost: $381,9002000: 66 buildings , average cost: $353,4001999: 57 buildings , average cost: $420,3001998: 64 buildings , average cost: $373,4001997: 51 buildings , average cost: $378,200Unemployment in December 2023:
Population change in the 1990s: +302 (+1.3%).
Most common occupations in Laguna Beach, CA (%)
Both Males Females
Other management occupations, except farmers and farm managers (8.5%)
Other sales and related occupations, including supervisors (7.0%)
Sales representatives, services, wholesale and manufacturing (6.3%)
Top executives (5.9%)
Art and design workers (4.8%)
Advertising, marketing, promotions, public relations, and sales managers (3.9%)
Preschool, kindergarten, elementary, and middle school teachers (3.5%)
Top executives (8.8%)
Other management occupations, except farmers and farm managers (8.1%)
Sales representatives, services, wholesale and manufacturing (6.5%)
Other sales and related occupations, including supervisors (6.5%)
Art and design workers (4.3%)
Advertising, marketing, promotions, public relations, and sales managers (4.0%)
Retail sales workers, except cashiers (3.4%)
Other management occupations, except farmers and farm managers (9.0%)
Other sales and related occupations, including supervisors (7.6%)
Preschool, kindergarten, elementary, and middle school teachers (6.8%)
Sales representatives, services, wholesale and manufacturing (5.9%)
Art and design workers (5.4%)
Other office and administrative support workers, including supervisors (5.1%)
Advertising, marketing, promotions, public relations, and sales managers (3.7%)
Earthquake activity:
Laguna Beach-area historical earthquake activity is significantly above California state average. It is 6617% greater than the overall U.S. average. On 6/28/1992 at 11:57:34, a magnitude 7.6 (6.2 MB, 7.6 MS, 7.3 MW, Depth: 0.7 mi, Class: Major, Intensity: VIII - XII) earthquake occurred 84.2 miles away from Laguna Beach center, causing 3 deaths ( 1 shaking deaths, 2 other deaths) and 400 injuries, causing $100,000,000 total damage and $40,000,000 insured lossesOn 7/21/1952 at 11:52:14, a magnitude 7.7 (7.7 UK) earthquake occurred 123.6 miles away from the city center, causing $50,000,000 total damage On 10/16/1999 at 09:46:44, a magnitude 7.4 (6.3 MB, 7.4 MS, 7.2 MW, 7.3 ML) earthquake occurred 102.3 miles away from the city center On 5/19/1940 at 04:36:40, a magnitude 7.2 (7.2 UK) earthquake occurred 121.6 miles away from the city center, causing $33,000,000 total damage On 4/21/1918 at 22:32:30, a magnitude 6.8 (6.8 UK, Class: Strong, Intensity: VII - IX) earthquake occurred 27.1 miles away from the city center On 11/4/1927 at 13:51:53, a magnitude 7.5 (7.5 UK) earthquake occurred 209.6 miles away from Laguna Beach center Magnitude types: body-wave magnitude (MB), local magnitude (ML), surface-wave magnitude (MS), moment magnitude (MW) Natural disasters: The number of natural disasters in Orange County (32) is a lot greater than the US average (15).Major Disasters (Presidential) Declared: 22Emergencies Declared: 2Floods: 15, Fires: 13, Storms: 9, Landslides: 6, Winter Storms: 6, Mudslides: 5, Earthquakes: 2, Heavy Rain: 1, Hurricane: 1, Snow: 1, Tornado: 1, Wind: 1, Other: 1 (Note: some incidents may be assigned to more than one category). Hospitals and medical centers in Laguna Beach: SOUTH COAST MEDICAL CENTER HOME CARE (31862 S COAST HIGHWAY, #202)
SOUTH COAST MEDICAL CTR D/P SN (31872 COAST HIGHWAY)
Other hospitals and medical centers near Laguna Beach: THE COVINGTON CARE CENTER (Nursing Home, about 3 miles away; ALISO VIEJO, CA)
SEA BRIGHT PLACE (Hospital, about 6 miles away; DANA POINT, CA)
PALM TERRACE HEALTHCARE AND REHABILITATION CENTER (Nursing Home, about 6 miles away; LAGUNA HILLS, CA)
MISSION HOSPITAL REGIONAL MED CENTER (about 7 miles away; MISSION VIEJO, CA)
MISSION HOSPITAL - TCU (Nursing Home, about 7 miles away; MISSION VIEJO, CA)
WIN HEALTH CARE SERVICES INC (Home Health Center, about 7 miles away; MISSION VIEJO, CA)
VILLA VALENCIA HEALTH CARE CENTER (Nursing Home, about 7 miles away; LAGUNA HILLS, CA)
Amtrak station: LAGUNA BEACH (TRANSIT DEPOT, BROADWAY BTW. BEACH & FOR) - Bus Station
Operable nuclear power plants near Laguna Beach:
11 miles: San Onofre 2 and 3 in San Clemente, CA.
College/University in Laguna Beach: Laguna College of Art and Design Full-time enrollment: 462; Location: 2222 Laguna Canyon Rd; Private, not-for-profit; Website: www.lcad.edu; Offers Master's degree )
Colleges/universities with over 2000 students nearest to Laguna Beach:
Saddleback College (about 7 miles; Mission Viejo, CA ; Full-time enrollment: 13,716)
Coastline Community College (about 8 miles; Fountain Valley, CA ; FT enrollment: 4,591)
Brandman University (about 9 miles; Irvine, CA ; FT enrollment: 6,027)
Concordia University-Irvine (about 9 miles; Irvine, CA ; FT enrollment: 3,284)
University of California-Irvine (about 10 miles; Irvine, CA ; FT enrollment: 28,587)
Irvine Valley College (about 10 miles; Irvine, CA ; FT enrollment: 8,005)
Vanguard University of Southern California (about 12 miles; Costa Mesa, CA ; FT enrollment: 2,104)
Public high school in Laguna Beach:
Public elementary/middle schools in Laguna Beach:
Private elementary/middle schools in Laguna Beach: ANNELIESE'S SCHOOLS Students: 418, Location: 20062 LAGUNA CANYON RD, Grades: PK-6)
ST CATHERINE OF SIENA PARISH SCHOOL Students: 184, Location: 30516 COAST HWY, Grades: KG-8)
See full list of schools located in Laguna Beach User-submitted facts and corrections:
laguna beach has a tv show added by joe
Notable locations in Laguna Beach: (A) , Laguna Beach Country Club (B) , Aliso Pier (C) , Laguna Beach City Hall (D) , Laguna Beach Branch Orange County Public Library (E) , Laguna Museum of Art (F) , Festival of the Arts Amphitheater (G) , City of Laguna Beach Fire Department Station 4 (H) , City of Laguna Beach Fire Department Station 3 (I) , City of Laguna Beach Fire Department Station 2 (J) , City of Laguna Beach Fire Department Station 1 (K) . Display/hide their locations on the map
Shopping Centers: (1) , Lumberyard Plaza Shopping Center (2) , Boat Canyon Shopping Center (3) . Display/hide their locations on the map
Churches in Laguna Beach include: (A) , Cathedral Chapel of Saint Francis By-The Sea (B) , The Church of Jesus Christ of Latter Day Saints (C) , First Church of Christ Scientist (D) , Laguna Beach United Methodist Church (E) , Laguna Presbyterian Church (F) , Saint Catherine Catholic Church (G) , Saint Marys Episcopal Church (H) . Display/hide their locations on the map
Creek: (A) . Display/hide its location on the map
Parks in Laguna Beach include: (1) , Irvine Bowl Park (2) , Aliso Beach County Park (3) , Jahraus Park (4) , Main Beach Park (5) , Alta Laguna Park (6) , Bluebird Park (7) , Boat Canyon Park (8) , Lang Park (9) . Display/hide their locations on the map
Beaches: (A) , Coast Royale Beach (B) , Aliso Beach (C) , Victoria Beach (D) , Arch Beach (E) . Display/hide their locations on the map
Hotels: (1) , Vacation Village (647 S Coast Hwy) (2) , Best Western Laguna Brisas Spa (1600 South Coast Highway) (3) , Best Inn (1404 North Coast Highway) (4) , Beach & Desert Cities Hotel Reservations (1027 N Coast Hwy) (5) , Best Western Laguna Reef Inn (30806 Coast Highway) (6) . Display/hide their approximate locations on the map
Birthplace of: Colt Brennan - Football player, Derek Sherinian - Keyboardist, Lauren Conrad - Television personality, Alyson Noël - Novelist, Bianca Butler - Figure skater, Chase Johnson - Rock musician, Don Ed Hardy - Fashion designer, Graham Phillips (actor) - Child actor, Jennifer Crittenden - Screenwriter and producer, Lo Bosworth - Relevision personality.
Orange County has a predicted average indoor radon screening level less than 2 pCi/L (pico curies per liter) - Low Potential Drinking water stations with addresses in Laguna Beach and their reported violations in the past:
CABANA HOLIDAY WS (Population served: 400, Groundwater):
Past health violations:
MCL, Monthly (TCR) - In OCT-2010, Contaminant: Coliform. Follow-up actions: St Violation/Reminder Notice (NOV-22-2010), St Public Notif requested (NOV-22-2010)
Population served: 100, Groundwater):
Past monitoring violations:
One regular monitoring violation
Average household size: This city:
2.1 peopleCalifornia:
2.9 people
Percentage of family households: This city:
53.5%Whole state:
68.7%
Percentage of households with unmarried partners: This city:
8.0%Whole state:
7.2%
Likely homosexual households (counted as self-reported same-sex unmarried-partner households)
Lesbian couples: 0.8% of all households Gay men: 2.0% of all households
People in group quarters in Laguna Beach in 2010:
69 people in emergency and transitional shelters (with sleeping facilities) for people experiencing homelessness
13 people in other noninstitutional facilities
7 people in residential treatment centers for adults
People in group quarters in Laguna Beach in 2000:
51 people in other noninstitutional group quarters
42 people in homes or halfway houses for drug/alcohol abuse
15 people in other nonhousehold living situations
11 people in hospitals/wards and hospices for chronically ill
11 people in other hospitals or wards for chronically ill
3 people in religious group quarters
Banks with branches in Laguna Beach (2011 data):
Bank of America, National Association: Laguna Beach Branch at 299 Ocean Avenue, branch established on 1936/03/23. Info updated 2009/11/18: Bank assets: $1,451,969.3 mil, Deposits: $1,077,176.8 mil, headquarters in Charlotte, NC, positive income , 5782 total offices , Holding Company: Bank Of America Corporation
Wells Fargo Bank, National Association: Laguna Beach Branch at 260 Ocean Avenue, branch established on 1935/06/24. Info updated 2011/04/05: Bank assets: $1,161,490.0 mil, Deposits: $905,653.0 mil, headquarters in Sioux Falls, SD, positive income , 6395 total offices , Holding Company: Wells Fargo & Company
U.S. Bank National Association: Laguna Beach Branch at 310 Glenneyre Street, branch established on 1954/05/07. Info updated 2012/01/30: Bank assets: $330,470.8 mil, Deposits: $236,091.5 mil, headquarters in Cincinnati, OH, positive income , 3121 total offices , Holding Company: U.S. Bancorp
Citizens Business Bank: Laguna Beach Branch at 800 Glenneyre Street, branch established on 1981/12/01. Info updated 2011/03/30: Bank assets: $6,475.4 mil, Deposits: $4,625.6 mil, headquarters in Ontario, CA, positive income , Commercial Lending Specialization, 46 total offices , Holding Company: Cvb Financial Corp.
Union Bank, National Association: Laguna Beach Branch at 229 Broadway Street, branch established on 2009/08/17. Info updated 2011/09/01: Bank assets: $88,967.5 mil, Deposits: $65,286.4 mil, headquarters in San Francisco, CA, positive income , Commercial Lending Specialization, 403 total offices , Holding Company: Mitsubishi Ufj Financial Group, Inc.
For population 15 years and over in Laguna Beach:
Never married: 24.9%Now married: 55.4%Separated: 1.4%Widowed: 4.9%Divorced: 13.5% For population 25 years and over in Laguna Beach:
High school or higher: 98.2%Bachelor's degree or higher: 65.0%Graduate or professional degree: 28.7%Unemployed: 3.6%Mean travel time to work (commute): 18.0 minutes
Education Gini index (Inequality in education) Here:
9.3California average:
15.5
Religion statistics for Laguna Beach, CA (based on Orange County data)
Religion Adherents Congregations Catholic 797,473 67 Evangelical Protestant 345,893 894 Other 141,815 329 Mainline Protestant 76,574 202 Orthodox 13,406 19 Black Protestant 2,424 8 None 1,632,647 -
Source: Clifford Grammich, Kirk Hadaway, Richard Houseal, Dale E.Jones, Alexei Krindatch, Richie Stanley and Richard H.Taylor. 2012. 2010 U.S.Religion Census: Religious Congregations & Membership Study. Association of Statisticians of American Religious Bodies. Jones, Dale E., et al. 2002. Congregations and Membership in the United States 2000. Nashville, TN: Glenmary Research Center. Graphs represent county-level data
Food Environment Statistics: Number of grocery stores : 530This county :
1.78 / 10,000 pop.State :
2.14 / 10,000 pop.
Number of supercenters and club stores : 18This county :
0.06 / 10,000 pop.California :
0.04 / 10,000 pop.
Number of convenience stores (no gas) : 147Orange County :
0.49 / 10,000 pop.California :
0.62 / 10,000 pop.
Number of convenience stores (with gas) : 434Orange County :
1.46 / 10,000 pop.State :
1.49 / 10,000 pop.
Number of full-service restaurants : 2,438Orange County :
8.19 / 10,000 pop.California :
7.42 / 10,000 pop.
Adult diabetes rate : This county :
6.3%California :
7.3%
Adult obesity rate : Orange County :
18.5%California :
21.3%
Low-income preschool obesity rate : Orange County :
16.4%California :
17.9%
Health and Nutrition: Healthy diet rate : Laguna Beach:
55.7%California:
49.4%
Average overall health of teeth and gums : Here:
55.7%California:
48.0%
Average BMI : This city:
28.0California:
28.1
People feeling badly about themselves : Laguna Beach:
18.7%California:
20.2%
People not drinking alcohol at all : This city:
7.2%State:
11.2%
Average hours sleeping at night : Laguna Beach:
6.9California:
6.8
Overweight people : This city:
34.3%State:
31.5%
General health condition : Laguna Beach:
61.9%State:
56.4%
Average condition of hearing : Laguna Beach:
80.6%State:
80.9%
More about Health and Nutrition of Laguna Beach, CA Residents
Local government employment and payroll (March 2022)
Function
Full-time employees
Monthly full-time payroll
Average yearly full-time wage
Part-time employees
Monthly part-time payroll
Police Protection - Officers
51 $683,632 $160,855 0 $0 Firefighters
37 $540,295 $175,231 0 $0 Police - Other
36 $317,599 $105,866 15 $33,719 Housing and Community Development (Local)
30 $249,734 $99,894 1 $705 Other and Unallocable
29 $216,734 $89,683 0 $0 Sewerage
16 $131,334 $98,501 0 $0 Parks and Recreation
15 $161,178 $128,942 58 $60,702 Streets and Highways
11 $92,615 $101,035 2 $3,007 Financial Administration
10 $120,568 $144,682 1 $3,516 Other Government Administration
9 $138,360 $184,480 6 $11,344 Transit
8 $68,043 $102,065 51 $99,063 Fire - Other
5 $39,645 $95,148 1 $2,135 Solid Waste Management
1 $9,610 $115,320 1 $2,124
Totals for Government
258 $2,769,345 $128,807 136 $216,314
Laguna Beach government finances - Expenditure in 2017 (per resident):
Construction - Regular Highways: $2,682,000 ($118.76)
Sewerage: $2,606,000 ($115.40)General - Other: $1,188,000 ($52.61)Parks and Recreation: $1,069,000 ($47.34)Parking Facilities: $673,000 ($29.80)Central Staff Services: $306,000 ($13.55)Health - Other: $282,000 ($12.49)Local Fire Protection: $196,000 ($8.68)Protective Inspection and Regulation - Other: $108,000 ($4.78)Current Operations - Police Protection: $19,547,000 ($865.56)
Parks and Recreation: $11,686,000 ($517.47)Local Fire Protection: $11,063,000 ($489.88)Central Staff Services: $6,703,000 ($296.82)Transit Utilities: $5,739,000 ($254.13)Protective Inspection and Regulation - Other: $5,626,000 ($249.13)Sewerage: $4,888,000 ($216.45)Regular Highways: $3,916,000 ($173.40)Parking Facilities: $3,009,000 ($133.24)Solid Waste Management: $2,121,000 ($93.92)Health - Other: $1,295,000 ($57.34)General - Other: $332,000 ($14.70)Financial Administration: $158,000 ($7.00)Libraries: $12,000 ($0.53)General - Interest on Debt: $517,000 ($22.89)
Other Capital Outlay - Regular Highways: $77,000 ($3.41)
Police Protection: $61,000 ($2.70)Health - Other: $10,000 ($0.44)Central Staff Services: $3,000 ($0.13)Total Salaries and Wages: $1,911,000 ($84.62)
Laguna Beach government finances - Revenue in 2017 (per resident):
Charges - Parking Facilities: $7,856,000 ($347.87)
Sewerage: $7,700,000 ($340.96)Solid Waste Management: $2,128,000 ($94.23)Other: $1,540,000 ($68.19)Regular Highways: $1,538,000 ($68.10)Parks and Recreation: $1,101,000 ($48.75)Federal Intergovernmental - Transit Utilities: $1,712,000 ($75.81)
Housing and Community Development: $189,000 ($8.37)Other: $5,000 ($0.22)Local Intergovernmental - Transit Utilities: $1,034,000 ($45.79)
Miscellaneous - General Revenue - Other: $2,879,000 ($127.49)
Fines and Forfeits: $1,002,000 ($44.37)Rents: $464,000 ($20.55)Donations From Private Sources: $313,000 ($13.86)Interest Earnings: $54,000 ($2.39)Sale of Property: $5,000 ($0.22)Revenue - Transit Utilities: $1,613,000 ($71.43)
State Intergovernmental - Other: $789,000 ($34.94)
Highways: $514,000 ($22.76)Transit Utilities: $486,000 ($21.52)General Local Government Support: $188,000 ($8.32)Tax - Property: $33,022,000 ($1462.25)
Other Selective Sales: $14,055,000 ($622.37)General Sales and Gross Receipts: $5,577,000 ($246.96)Other License: $2,947,000 ($130.50)Public Utilities Sales: $1,201,000 ($53.18)Occupation and Business License - Other: $947,000 ($41.93)Documentary and Stock Transfer: $735,000 ($32.55)Other: $561,000 ($24.84)
Laguna Beach government finances - Debt in 2017 (per resident):
Long Term Debt - Beginning Outstanding - Unspecified Public Purpose: $12,928,000 ($572.47)
Outstanding Unspecified Public Purpose: $11,487,000 ($508.66)Retired Unspecified Public Purpose: $1,441,000 ($63.81)
Laguna Beach government finances - Cash and Securities in 2017 (per resident):
Bond Funds - Cash and Securities: $1,298,000 ($57.48)
Other Funds - Cash and Securities: $85,693,000 ($3794.58)
4.86% of this county's 2021 resident taxpayers lived in other counties in 2020 ($95,983 average adjusted gross income )
Here:
4.86%California average:
5.19%
0.01% of residents moved from foreign countries ($132 average AGI )Orange County:
0.01%California average:
0.03%
Top counties from which taxpayers relocated into this county between 2020 and 2021:
5.71% of this county's 2020 resident taxpayers moved to other counties in 2021 ($106,828 average adjusted gross income )
Here:
5.71%California average:
6.14%
0.01% of residents moved to foreign countries ($180 average AGI )Orange County:
0.01%California average:
0.02%
Top counties to which taxpayers relocated from this county between 2020 and 2021:
Businesses in Laguna Beach, CA
Name Count Name Count
Ace Hardware 1 KFC 1 Albertsons 1 Kroger 1 Best Western 1 Nike 1 CVS 1 Safeway 1 Chico's 1 Starbucks 3 Circle K 1 Taco Bell 1 Domino's Pizza 1 U-Haul 1 FedEx 4 UPS 3 Holiday Inn 1 Vans 2 Johnny Rockets 1 Vons 1 Jones New York 2 Whole Foods Market 1
Strongest AM radio stations in Laguna Beach:
KFI (640 AM; 50 kW; LOS ANGELES, CA; Owner: CAPSTAR TX LIMITED PARTNERSHIP)
KPLS (830 AM; 50 kW; ORANGE, CA; Owner: CRN LICENSES, LLC)
KLAC (570 AM; 50 kW; LOS ANGELES, CA; Owner: AMFM RADIO LICENSES, L.L.C.)
KTNQ (1020 AM; 50 kW; LOS ANGELES, CA; Owner: KTNQ-AM LICENSE CORP.)
KXTA (1150 AM; 50 kW; LOS ANGELES, CA; Owner: CITICASTERS LICENSES, L.P.)
KNX (1070 AM; 50 kW; LOS ANGELES, CA; Owner: INFINITY BROADCASTING OPERATIONS, INC.)
KFWB (980 AM; 50 kW; LOS ANGELES, CA; Owner: INFINITY BROADCASTING OPERATIONS, INC.)
KDIS (1110 AM; 50 kW; PASADENA, CA; Owner: ABC,INC.)
KSPN (710 AM; 50 kW; LOS ANGELES, CA; Owner: KABC-AM RADIO, INC.)
KMPC (1540 AM; 50 kW; LOS ANGELES, CA; Owner: ROSE CITY RADIO CORPORATION)
KFMB (760 AM; 50 kW; SAN DIEGO, CA; Owner: MIDWEST TELEVISION, INC.)
KBLA (1580 AM; 50 kW; SANTA MONICA, CA)
KVNR (1480 AM; 5 kW; SANTA ANA, CA; Owner: LBI RADIO LICENSE CORP.)
Strongest FM radio stations in Laguna Beach:
KWVE (107.9 FM; SAN CLEMENTE, CA; Owner: CALVARY CHAPEL OF COSTA MESA)
KDLE (103.1 FM; NEWPORT BEACH, CA; Owner: ENTRAVISION HOLDINGS, LLC.)
KSBR (88.5 FM; MISSION VIEJO, CA; Owner: SADDLEBACK COMMUNITY COLLEGE DIST.)
KRTM (88.9 FM; TEMECULA, CA; Owner: PENFOLD COMMUNICATIONS, INC.)
KCBS-FM (93.1 FM; LOS ANGELES, CA; Owner: INFINITY BROADCASTING OPERATIONS, INC.)
K206AA (89.1 FM; LAGUNA BEACH, CA; Owner: SADDLEBACK COMM COLL DIST.)
KZLA-FM (93.9 FM; LOS ANGELES, CA; Owner: EMMIS RADIO LICENSE CORPORATION)
KSCA (101.9 FM; GLENDALE, CA; Owner: HBC LICENSE CORPORATION)
KLOS (95.5 FM; LOS ANGELES, CA; Owner: KLOS-FM RADIO, INC.)
K212FA (90.3 FM; TEMPLE CITY, CA; Owner: EDUCATIONAL MEDIA FOUNDATION)
KOST (103.5 FM; LOS ANGELES, CA; Owner: CAPSTAR TX LIMITED PARTNERSHIP)
KPWR (105.9 FM; LOS ANGELES, CA; Owner: EMMIS RADIO LICENSE CORPORATION)
KLSX (97.1 FM; LOS ANGELES, CA; Owner: INFINITY BROADCASTING OPERATIONS, INC.)
KLRD (90.1 FM; YUCAIPA, CA; Owner: EDUCATIONAL MEDIA FOUNDATION)
KUSC (91.5 FM; LOS ANGELES, CA; Owner: UNIVERSITY OF SOUTHERN CALIFORNIA)
KLVE (107.5 FM; LOS ANGELES, CA; Owner: KLVE-FM LICENSE CORP.)
KIIS-FM (102.7 FM; LOS ANGELES, CA; Owner: CITICASTERS LICENSES, L.P.)
KKLA-FM (99.5 FM; LOS ANGELES, CA; Owner: NEW INSPIRATION BROADCASTING CO., INC.)
KPCC (89.3 FM; PASADENA, CA; Owner: PASADENA AREA COMMUNITY COLLEGE DISTRICT)
KHHT (92.3 FM; LOS ANGELES, CA; Owner: AMFM RADIO LICENSES, L.L.C.)
TV broadcast stations around Laguna Beach:
KTRO-LP (Channel 50; LANCASTER, CA; Owner: ROBERT D. ADELMAN)
National Bridge Inventory (NBI) Statistics 25 Number of bridges420ft / 128m Total length $626,000 Total costs880,724 Total average daily traffic24,742 Total average daily truck traffic
New bridges - historical statistics
4 1920-1929 1 1940-1949 1 1950-1959 1 1960-1969 1 1970-1979 13 1990-1999 4 2000-2009
See full National Bridge Inventory statistics for Laguna Beach, CA
Home Mortgage Disclosure Act Aggregated Statistics For Year 2009(Based on 3 full and 4 partial tracts) A) FHA, FSA/RHS & VA B) Conventional C) Refinancings D) Home Improvement Loans E) Loans on Dwellings For 5+ Families F) Non-occupant Loans on G) Loans On Manufactured Number Average Value Number Average Value Number Average Value Number Average Value Number Average Value Number Average Value Number Average Value
LOANS ORIGINATED 9 $692,212 164 $861,442 843 $539,570 29 $567,580 0 $0 144 $841,486 0 $0 APPLICATIONS APPROVED, NOT ACCEPTED 2 $547,750 27 $746,925 98 $547,500 3 $386,847 0 $0 24 $641,552 1 $121,460 APPLICATIONS DENIED 2 $487,245 59 $809,650 309 $681,693 8 $195,681 2 $1,665,000 48 $568,241 3 $104,530 APPLICATIONS WITHDRAWN 1 $384,610 40 $744,491 163 $540,729 12 $415,455 0 $0 22 $701,542 0 $0 FILES CLOSED FOR INCOMPLETENESS 0 $0 6 $929,600 48 $563,651 4 $217,850 0 $0 7 $358,360 0 $0
Aggregated Statistics For Year 2008(Based on 3 full and 4 partial tracts) A) FHA, FSA/RHS & VA B) Conventional C) Refinancings D) Home Improvement Loans E) Loans on Dwellings For 5+ Families F) Non-occupant Loans on G) Loans On Manufactured Number Average Value Number Average Value Number Average Value Number Average Value Number Average Value Number Average Value Number Average Value
LOANS ORIGINATED 1 $500,640 175 $969,728 330 $787,759 30 $361,784 3 $1,321,333 99 $1,009,491 1 $35,840 APPLICATIONS APPROVED, NOT ACCEPTED 0 $0 35 $818,441 72 $691,500 5 $264,272 1 $999,000 16 $1,310,161 1 $117,340 APPLICATIONS DENIED 2 $537,370 65 $761,333 190 $1,086,419 17 $430,124 2 $1,794,880 45 $881,513 4 $113,578 APPLICATIONS WITHDRAWN 0 $0 43 $727,292 98 $810,101 9 $264,818 1 $800,000 21 $999,669 0 $0 FILES CLOSED FOR INCOMPLETENESS 0 $0 12 $1,070,647 31 $1,185,795 5 $341,774 0 $0 6 $974,377 0 $0
Aggregated Statistics For Year 2007(Based on 3 full and 4 partial tracts) A) FHA, FSA/RHS & VA B) Conventional C) Refinancings D) Home Improvement Loans E) Loans on Dwellings For 5+ Families F) Non-occupant Loans on G) Loans On Manufactured Number Average Value Number Average Value Number Average Value Number Average Value Number Average Value Number Average Value Number Average Value
LOANS ORIGINATED 3 $764,723 317 $1,008,441 589 $969,119 72 $649,854 4 $3,623,750 167 $876,194 1 $142,730 APPLICATIONS APPROVED, NOT ACCEPTED 0 $0 68 $926,692 128 $972,410 17 $913,071 0 $0 43 $958,538 0 $0 APPLICATIONS DENIED 0 $0 99 $1,079,703 274 $1,137,409 22 $1,202,981 0 $0 76 $1,109,475 6 $148,635 APPLICATIONS WITHDRAWN 0 $0 66 $1,441,570 124 $1,162,932 15 $731,125 1 $1,000,000 38 $1,521,811 0 $0 FILES CLOSED FOR INCOMPLETENESS 0 $0 8 $729,042 37 $1,116,803 2 $535,240 0 $0 12 $1,643,968 0 $0
Aggregated Statistics For Year 2006(Based on 3 full and 4 partial tracts) B) Conventional C) Refinancings D) Home Improvement Loans E) Loans on Dwellings For 5+ Families F) Non-occupant Loans on G) Loans On Manufactured Number Average Value Number Average Value Number Average Value Number Average Value Number Average Value Number Average Value
LOANS ORIGINATED 357 $931,135 756 $836,714 89 $661,932 8 $1,778,654 202 $860,961 4 $107,932 APPLICATIONS APPROVED, NOT ACCEPTED 63 $884,781 127 $861,876 22 $550,277 0 $0 24 $921,326 6 $102,880 APPLICATIONS DENIED 111 $1,056,856 246 $1,192,802 31 $845,202 1 $3,150,000 47 $906,223 4 $104,902 APPLICATIONS WITHDRAWN 84 $1,360,825 179 $1,118,251 16 $921,095 1 $2,100,000 35 $776,237 0 $0 FILES CLOSED FOR INCOMPLETENESS 7 $1,062,799 30 $1,021,072 4 $824,625 0 $0 6 $1,042,357 0 $0
Aggregated Statistics For Year 2005(Based on 3 full and 4 partial tracts) B) Conventional C) Refinancings D) Home Improvement Loans E) Loans on Dwellings For 5+ Families F) Non-occupant Loans on G) Loans On Manufactured Number Average Value Number Average Value Number Average Value Number Average Value Number Average Value Number Average Value
LOANS ORIGINATED 505 $918,522 952 $761,009 83 $575,501 11 $2,038,275 227 $803,376 3 $119,850 APPLICATIONS APPROVED, NOT ACCEPTED 90 $847,657 131 $705,311 19 $584,592 0 $0 38 $604,156 8 $102,486 APPLICATIONS DENIED 138 $829,288 237 $900,763 32 $617,010 1 $1,465,560 56 $763,695 8 $142,852 APPLICATIONS WITHDRAWN 110 $876,195 143 $749,883 18 $666,179 1 $1,863,000 30 $805,049 3 $180,507 FILES CLOSED FOR INCOMPLETENESS 29 $860,052 62 $715,927 4 $640,320 0 $0 6 $832,288 0 $0
Aggregated Statistics For Year 2004(Based on 3 full and 4 partial tracts) B) Conventional C) Refinancings D) Home Improvement Loans E) Loans on Dwellings For 5+ Families F) Non-occupant Loans on G) Loans On Manufactured Number Average Value Number Average Value Number Average Value Number Average Value Number Average Value Number Average Value
LOANS ORIGINATED 594 $783,754 1,302 $614,162 73 $414,255 9 $1,870,978 268 $591,259 2 $160,455 APPLICATIONS APPROVED, NOT ACCEPTED 115 $778,056 181 $639,076 16 $200,764 1 $894,240 34 $773,219 3 $87,940 APPLICATIONS DENIED 125 $886,733 240 $739,370 27 $443,667 0 $0 41 $651,691 2 $119,530 APPLICATIONS WITHDRAWN 94 $771,730 209 $537,422 13 $768,663 0 $0 34 $610,994 4 $131,575 FILES CLOSED FOR INCOMPLETENESS 23 $956,933 53 $625,652 4 $294,392 0 $0 9 $652,591 0 $0
Aggregated Statistics For Year 2003(Based on 3 full and 4 partial tracts) A) FHA, FSA/RHS & VA B) Conventional C) Refinancings D) Home Improvement Loans E) Loans on Dwellings For 5+ Families F) Non-occupant Loans on Number Average Value Number Average Value Number Average Value Number Average Value Number Average Value Number Average Value
LOANS ORIGINATED 0 $0 633 $618,657 2,916 $461,202 24 $184,910 7 $947,347 358 $452,089 APPLICATIONS APPROVED, NOT ACCEPTED 1 $90,580 100 $622,301 387 $432,852 6 $282,495 0 $0 41 $461,303 APPLICATIONS DENIED 1 $729,300 120 $710,058 413 $517,874 8 $73,500 0 $0 47 $585,680 APPLICATIONS WITHDRAWN 1 $616,000 90 $617,843 368 $437,174 13 $196,258 0 $0 46 $385,654 FILES CLOSED FOR INCOMPLETENESS 0 $0 17 $577,913 95 $458,357 3 $218,667 0 $0 9 $320,873
Aggregated Statistics For Year 2002(Based on 3 full and 2 partial tracts) B) Conventional C) Refinancings D) Home Improvement Loans E) Loans on Dwellings For 5+ Families F) Non-occupant Loans on Number Average Value Number Average Value Number Average Value Number Average Value Number Average Value
LOANS ORIGINATED 531 $507,318 1,916 $444,573 41 $260,604 11 $1,052,076 266 $446,282 APPLICATIONS APPROVED, NOT ACCEPTED 82 $463,989 269 $444,980 6 $75,118 0 $0 26 $341,453 APPLICATIONS DENIED 75 $555,648 249 $488,797 6 $145,032 0 $0 42 $414,230 APPLICATIONS WITHDRAWN 66 $588,450 262 $417,304 7 $290,529 0 $0 30 $456,949 FILES CLOSED FOR INCOMPLETENESS 29 $398,573 77 $423,603 1 $298,080 1 $600,000 6 $225,062
Aggregated Statistics For Year 2001(Based on 3 full and 2 partial tracts) A) FHA, FSA/RHS & VA B) Conventional C) Refinancings D) Home Improvement Loans E) Loans on Dwellings For 5+ Families F) Non-occupant Loans on Number Average Value Number Average Value Number Average Value Number Average Value Number Average Value Number Average Value
LOANS ORIGINATED 3 $148,470 392 $423,276 1,204 $430,736 58 $106,740 6 $904,313 130 $327,664 APPLICATIONS APPROVED, NOT ACCEPTED 0 $0 59 $435,904 188 $399,452 17 $121,888 0 $0 20 $396,665 APPLICATIONS DENIED 0 $0 79 $445,115 240 $435,200 22 $94,930 0 $0 23 $364,709 APPLICATIONS WITHDRAWN 0 $0 48 $332,742 182 $335,029 8 $43,394 1 $1,192,320 15 $303,345 FILES CLOSED FOR INCOMPLETENESS 0 $0 36 $275,507 66 $486,878 2 $119,805 0 $0 5 $193,742
Aggregated Statistics For Year 2000(Based on 3 full and 2 partial tracts) A) FHA, FSA/RHS & VA B) Conventional C) Refinancings D) Home Improvement Loans E) Loans on Dwellings For 5+ Families F) Non-occupant Loans on Number Average Value Number Average Value Number Average Value Number Average Value Number Average Value Number Average Value
LOANS ORIGINATED 4 $262,092 486 $433,752 303 $394,155 70 $87,985 6 $1,243,670 82 $351,873 APPLICATIONS APPROVED, NOT ACCEPTED 1 $196,240 76 $488,940 60 $465,633 12 $118,903 0 $0 8 $371,698 APPLICATIONS DENIED 0 $0 104 $432,480 112 $436,761 24 $63,682 1 $850,000 11 $367,475 APPLICATIONS WITHDRAWN 0 $0 67 $388,301 54 $283,193 11 $55,143 2 $1,154,500 6 $274,755 FILES CLOSED FOR INCOMPLETENESS 0 $0 21 $314,600 35 $444,331 5 $75,772 3 $860,333 4 $514,068
Aggregated Statistics For Year 1999(Based on 2 full and 4 partial tracts) A) FHA, FSA/RHS & VA B) Conventional C) Refinancings D) Home Improvement Loans E) Loans on Dwellings For 5+ Families F) Non-occupant Loans on Number Average Value Number Average Value Number Average Value Number Average Value Number Average Value Number Average Value
LOANS ORIGINATED 87 $173,594 1,039 $272,101 1,073 $286,370 93 $53,502 6 $629,228 146 $252,608 APPLICATIONS APPROVED, NOT ACCEPTED 5 $188,484 147 $285,355 196 $280,962 32 $45,132 3 $304,357 24 $268,503 APPLICATIONS DENIED 17 $173,989 226 $294,650 323 $371,139 36 $34,083 1 $1,462,330 37 $331,754 APPLICATIONS WITHDRAWN 13 $272,183 175 $256,189 196 $260,789 7 $60,601 0 $0 14 $352,882 FILES CLOSED FOR INCOMPLETENESS 3 $193,377 61 $260,338 90 $272,477 1 $22,180 0 $0 8 $249,968
Detailed HMDA statistics for the following Tracts:
0423.05
, 0423.25 , 0626.05 , 0626.19 , 0626.20 , 0626.23 , 0626.32
Private Mortgage Insurance Companies Aggregated Statistics For Year 2009(Based on 1 full and 2 partial tracts) A) Conventional Number Average Value
LOANS ORIGINATED 2 $175,400 APPLICATIONS APPROVED, NOT ACCEPTED 0 $0 APPLICATIONS DENIED 2 $434,470 APPLICATIONS WITHDRAWN 0 $0 FILES CLOSED FOR INCOMPLETENESS 0 $0
Aggregated Statistics For Year 2008(Based on 1 full and 3 partial tracts) A) Conventional B) Refinancings C) Non-occupant Loans on Number Average Value Number Average Value Number Average Value
LOANS ORIGINATED 3 $256,013 1 $111,280 0 $0 APPLICATIONS APPROVED, NOT ACCEPTED 2 $234,355 0 $0 1 $143,640 APPLICATIONS DENIED 4 $587,092 0 $0 0 $0 APPLICATIONS WITHDRAWN 0 $0 0 $0 0 $0 FILES CLOSED FOR INCOMPLETENESS 0 $0 0 $0 0 $0
Aggregated Statistics For Year 2007(Based on 2 full and 3 partial tracts) A) Conventional B) Refinancings C) Non-occupant Loans on Number Average Value Number Average Value Number Average Value
LOANS ORIGINATED 7 $463,161 2 $533,820 3 $669,833 APPLICATIONS APPROVED, NOT ACCEPTED 1 $449,570 2 $432,220 0 $0 APPLICATIONS DENIED 0 $0 2 $1,656,995 1 $1,728,860 APPLICATIONS WITHDRAWN 1 $1,326,000 0 $0 1 $1,326,000 FILES CLOSED FOR INCOMPLETENESS 0 $0 0 $0 0 $0
Aggregated Statistics For Year 2006(Based on 3 partial tracts) A) Conventional B) Refinancings Number Average Value Number Average Value
LOANS ORIGINATED 1 $425,530 1 $325,970 APPLICATIONS APPROVED, NOT ACCEPTED 0 $0 0 $0 APPLICATIONS DENIED 0 $0 0 $0 APPLICATIONS WITHDRAWN 1 $249,150 0 $0 FILES CLOSED FOR INCOMPLETENESS 0 $0 0 $0
Aggregated Statistics For Year 2005(Based on 3 partial tracts) A) Conventional C) Non-occupant Loans on D) Loans On Manufactured Number Average Value Number Average Value Number Average Value
LOANS ORIGINATED 3 $352,780 0 $0 0 $0 APPLICATIONS APPROVED, NOT ACCEPTED 1 $344,430 0 $0 0 $0 APPLICATIONS DENIED 0 $0 0 $0 0 $0 APPLICATIONS WITHDRAWN 0 $0 0 $0 0 $0 FILES CLOSED FOR INCOMPLETENESS 1 $154,400 1 $154,400 1 $154,400
Aggregated Statistics For Year 2004(Based on 1 full and 4 partial tracts) A) Conventional B) Refinancings C) Non-occupant Loans on Number Average Value Number Average Value Number Average Value
LOANS ORIGINATED 1 $373,430 1 $824,480 1 $315,000 APPLICATIONS APPROVED, NOT ACCEPTED 3 $214,233 3 $242,493 2 $237,745 APPLICATIONS DENIED 0 $0 0 $0 0 $0 APPLICATIONS WITHDRAWN 0 $0 0 $0 0 $0 FILES CLOSED FOR INCOMPLETENESS 0 $0 0 $0 0 $0
Aggregated Statistics For Year 2003(Based on 3 full and 4 partial tracts) A) Conventional B) Refinancings C) Non-occupant Loans on Number Average Value Number Average Value Number Average Value
LOANS ORIGINATED 11 $339,665 5 $363,184 1 $332,910 APPLICATIONS APPROVED, NOT ACCEPTED 4 $302,908 2 $365,165 1 $375,080 APPLICATIONS DENIED 1 $645,840 0 $0 0 $0 APPLICATIONS WITHDRAWN 0 $0 1 $380,150 1 $380,150 FILES CLOSED FOR INCOMPLETENESS 0 $0 0 $0 0 $0
Aggregated Statistics For Year 2002(Based on 3 full and 2 partial tracts) A) Conventional B) Refinancings C) Non-occupant Loans on Number Average Value Number Average Value Number Average Value
LOANS ORIGINATED 17 $281,568 5 $423,466 2 $203,435 APPLICATIONS APPROVED, NOT ACCEPTED 3 $251,157 2 $118,510 0 $0 APPLICATIONS DENIED 0 $0 0 $0 0 $0 APPLICATIONS WITHDRAWN 1 $423,460 0 $0 0 $0 FILES CLOSED FOR INCOMPLETENESS 1 $187,230 0 $0 0 $0
Aggregated Statistics For Year 2001(Based on 3 full and 2 partial tracts) A) Conventional B) Refinancings C) Non-occupant Loans on Number Average Value Number Average Value Number Average Value
LOANS ORIGINATED 17 $312,697 4 $300,622 1 $74,070 APPLICATIONS APPROVED, NOT ACCEPTED 5 $259,168 0 $0 0 $0 APPLICATIONS DENIED 0 $0 0 $0 0 $0 APPLICATIONS WITHDRAWN 0 $0 1 $192,580 0 $0 FILES CLOSED FOR INCOMPLETENESS 0 $0 0 $0 0 $0
Aggregated Statistics For Year 2000(Based on 3 full and 2 partial tracts) A) Conventional B) Refinancings C) Non-occupant Loans on Number Average Value Number Average Value Number Average Value
LOANS ORIGINATED 20 $292,439 5 $319,820 5 $268,110 APPLICATIONS APPROVED, NOT ACCEPTED 7 $336,231 2 $434,405 2 $253,510 APPLICATIONS DENIED 6 $347,080 0 $0 0 $0 APPLICATIONS WITHDRAWN 1 $366,500 0 $0 0 $0 FILES CLOSED FOR INCOMPLETENESS 0 $0 0 $0 0 $0
Aggregated Statistics For Year 1999(Based on 2 full and 4 partial tracts) A) Conventional B) Refinancings C) Non-occupant Loans on Number Average Value Number Average Value Number Average Value
LOANS ORIGINATED 141 $224,924 35 $205,061 4 $233,822 APPLICATIONS APPROVED, NOT ACCEPTED 20 $261,289 14 $186,090 1 $238,580 APPLICATIONS DENIED 13 $219,332 6 $260,513 0 $0 APPLICATIONS WITHDRAWN 4 $234,118 4 $241,218 0 $0 FILES CLOSED FOR INCOMPLETENESS 1 $227,430 1 $201,250 0 $0
Detailed PMIC statistics for the following Tracts:
0423.05
, 0423.25 , 0626.05 , 0626.19 , 0626.20 , 0626.23 , 0626.32 Fire-safe hotels and motels in Laguna Beach, California:
The Inn at Laguna Beach, 211 N Pacific Coast Hwy, Laguna Beach, California 92651 Phone: (949) 497-9722, Fax: (949) 497-9972
Best Western Laguna Brisas, 1600 S Coast Hwy, Laguna Beach, California 92651 Phone: (949) 497-7272, Fax: (949) 497-8306
Art Hotel Laguna Beach, 1404 N Coast Hwy, Laguna Beach, California 92651 Phone: (949) 494-6464, Fax: (949) 494-6776
Holiday Inn-laguna Beach, 696 S Coast Hwy, Laguna Beach, California 92651 Phone: (949) 494-1001, Fax: (949) 497-7107
Pacific Edge Hotel On Laguna Beach, 647 Soutch Coast Hwy, Laguna Beach, California 92651 Phone: (949) 494-8566, Fax: (949) 494-1386
Casa Laguna Hotel, 2510 S Coast Hwy, Laguna beach, California 92651 Phone: (949) 494-2996, Fax: (424) 228-2033
Montage Laguna Beach, 30801 S Coast ,Hwy Laguna ,Bch CA, Laguna beach, California 92651 Phone: (949) 715-6000, Fax: (949) 715-6150
All 7 fire-safe hotels and motels in Laguna Beach, California
Most common first names in Laguna Beach, CA among deceased individuals Name Count Lived (average)
Robert 172 73.7 years John 171 75.1 years William 161 74.8 years Mary 146 82.9 years Helen 93 82.4 years Margaret 88 83.1 years James 87 72.0 years Charles 83 77.2 years Ruth 82 84.0 years George 78 77.9 years
Most common last names in Laguna Beach, CA among deceased individuals Last name Count Lived (average)
Smith 59 78.4 years Johnson 41 79.7 years Miller 35 76.2 years Martin 27 78.1 years Brown 26 78.1 years Adams 26 75.1 years Williams 25 74.7 years Anderson 24 78.0 years Wilson 24 76.9 years Jones 24 76.3 years
Laguna Beach compared to California state average:
Median household income above state average. Median house value significantly above state average. Unemployed percentage significantly below state average. Black race population percentage significantly below state average. Hispanic race population percentage significantly below state average. Median age significantly above state average. Foreign-born population percentage significantly below state average. Length of stay since moving in significantly above state average. Percentage of population with a bachelor's degree or higher significantly above state average. Laguna Beach on our top lists :
#6 on the list of "Top 100 cities with highest median house value"
#16 on the list of "Top 101 cities with the largest percentage of likely gay men couples (counted as self-reported male-male unmarried-partner households) (population 5,000+)"
#24 on the list of "Top 101 cities with the largest percentage of likely homosexual households (counted as self-reported same-sex unmarried-partner households) (population 5,000+)"
#33 on the list of "Top 101 cities with the most local government spending on current operations of parking facilities per resident (population 10,000+)"
#38 on the list of "Top 101 cities with largest percentage of males in occupations: arts, design, entertainment, sports, and media occupations (population 5,000+)"
#41 on the list of "Top 100 cities with highest ratio of median house value to median household income (pop. 5,000+)"
#51 on the list of "Top 101 cities with largest percentage of females in occupations: arts, design, entertainment, sports, and media occupations (population 5,000+)"
#68 on the list of "Top 101 cities with the highest cost per building permit(population 5,000+)"
#83 on the list of "Top 101 cities with the most recent year of entry for the foreign-born population (2,000+ people)+"
#4 on the list of "Top 101 counties with the highest total withdrawal of fresh water for public supply"
#5 on the list of "Top 101 counties with the most Catholic adherents"
#6 on the list of "Top 101 counties with the highest ground withdrawal of fresh water for public supply"
#7 on the list of "Top 101 counties with the most Evangelical Protestant adherents"
#8 on the list of "Top 101 counties with the highest Particulate Matter (PM2.5 ) Annual air pollution readings in 2012 (µg/m3 )"
Top Patent Applicants
Axel Scherer (60)
Robert M. Burk (49)
Jay A. Lenker (43)
Rhett M. Schiffman (42)
Sabrina Tai-Chen Yeh (32)
Matthew Blake Mcrae (24)
Horst Leitner (21)
James D. Bennett (21)
James Stuart Cumming (18)
G. Gregory Carpenter (17)
Total of 1307 patent applications in 2008-2024.

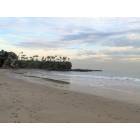

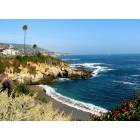


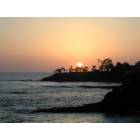
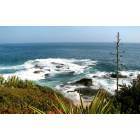

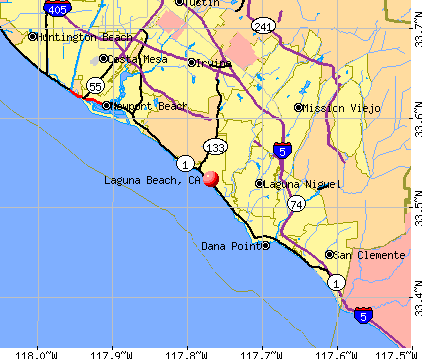


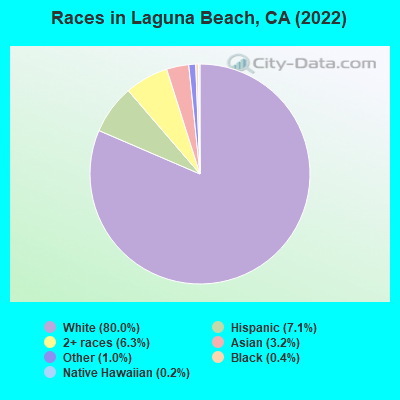
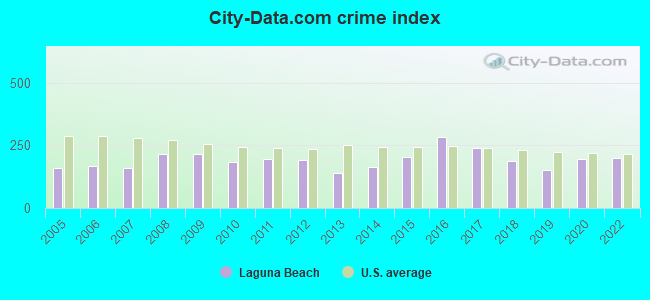
 Recent articles from our blog. Our writers, many of them Ph.D. graduates or candidates, create easy-to-read articles on a wide variety of topics.

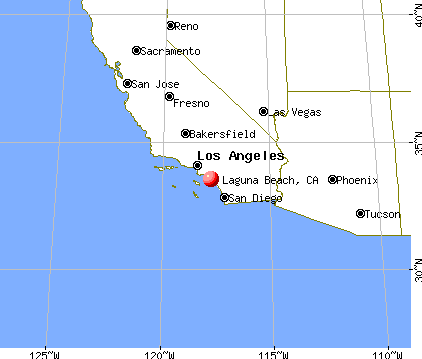
 (3.8 miles
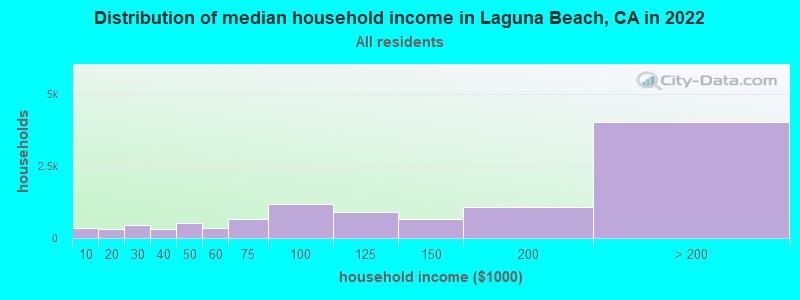
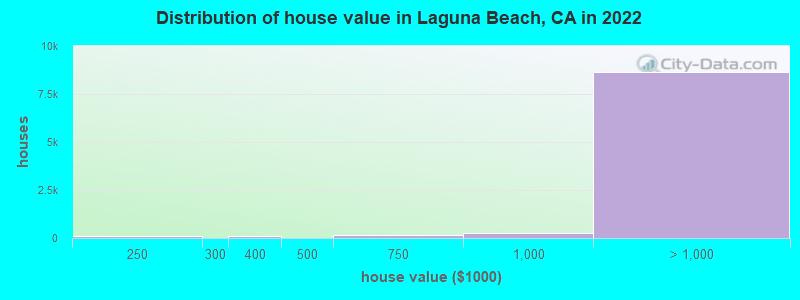
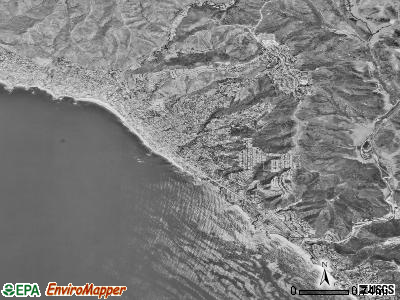
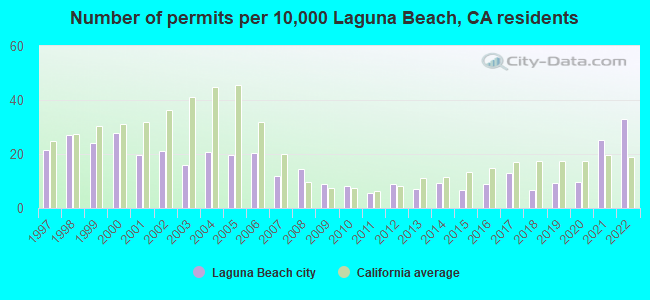
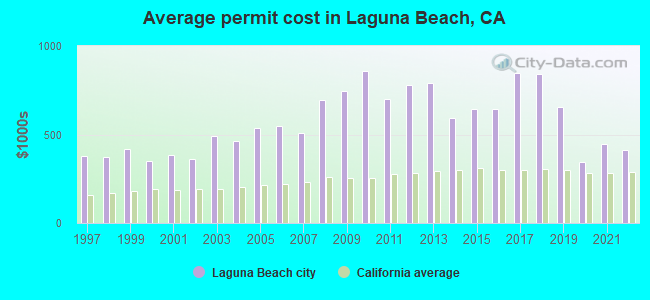
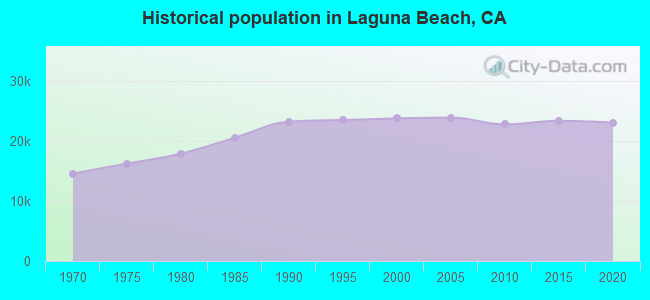
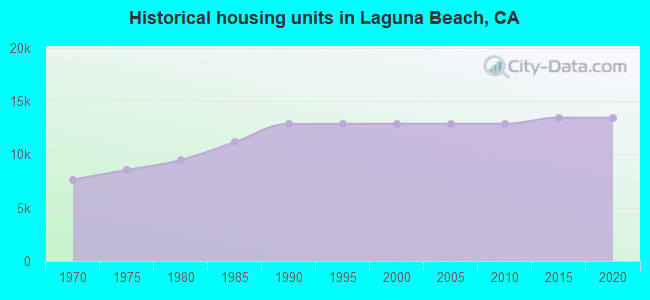
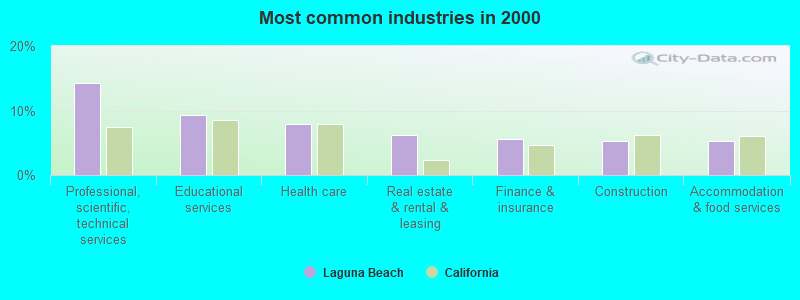
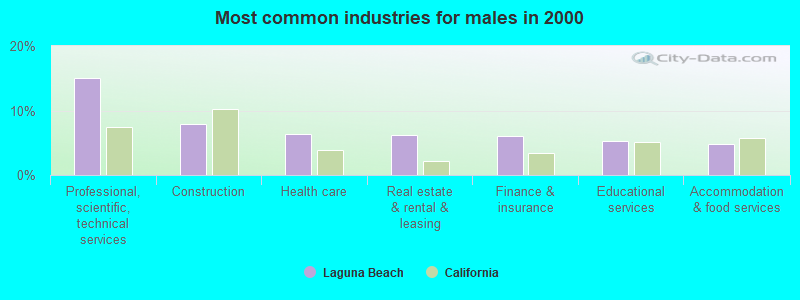
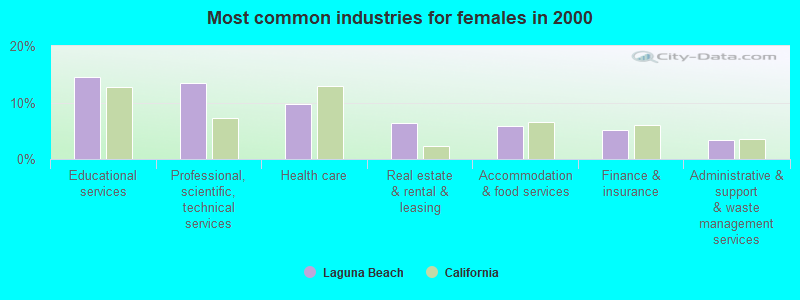
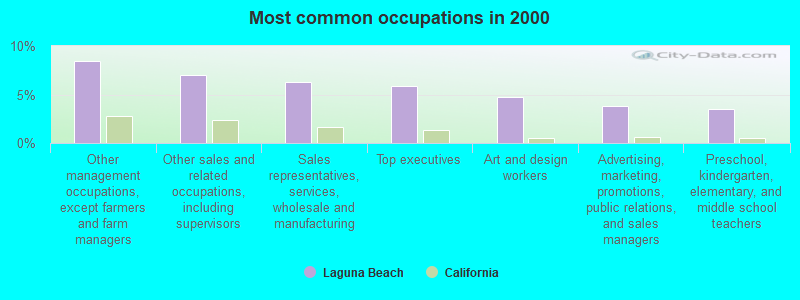
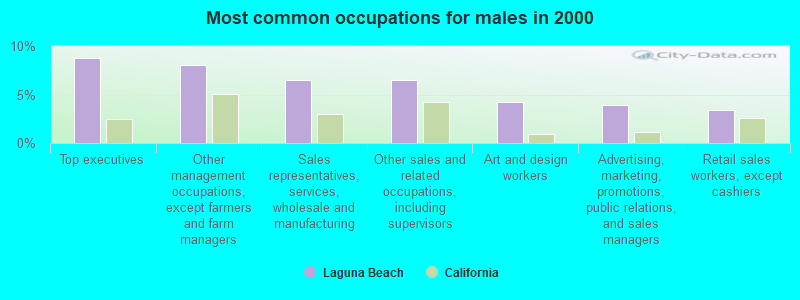
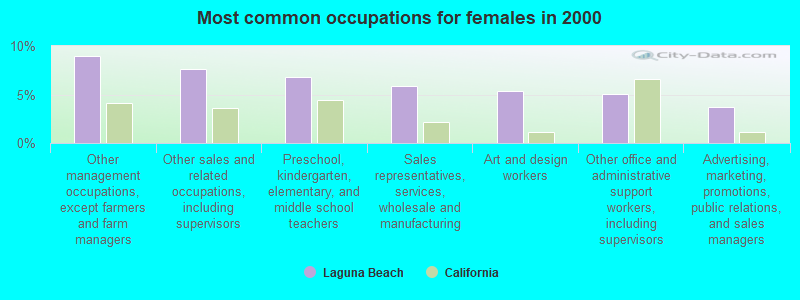
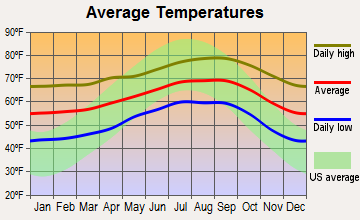
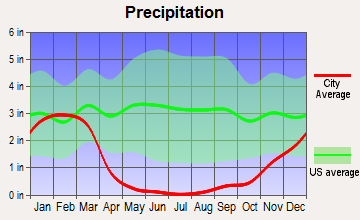
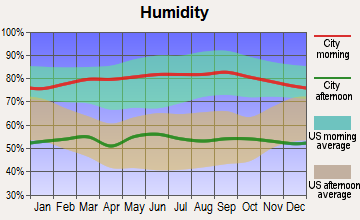
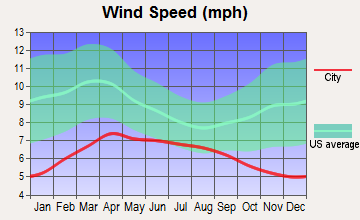
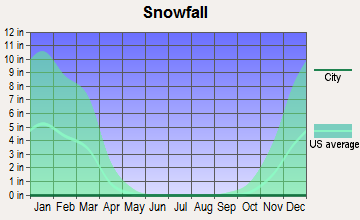
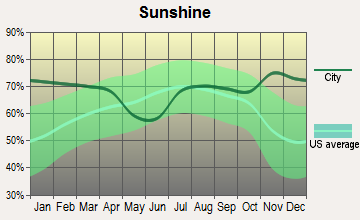
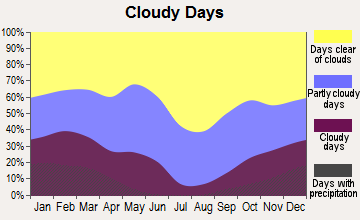


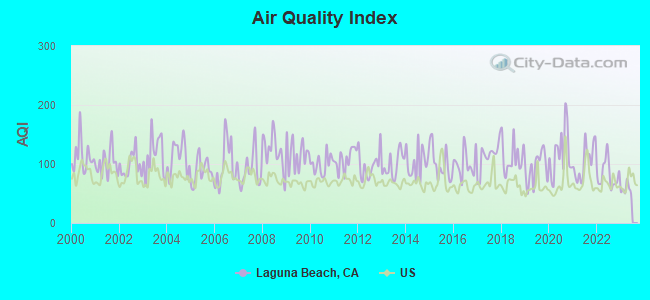
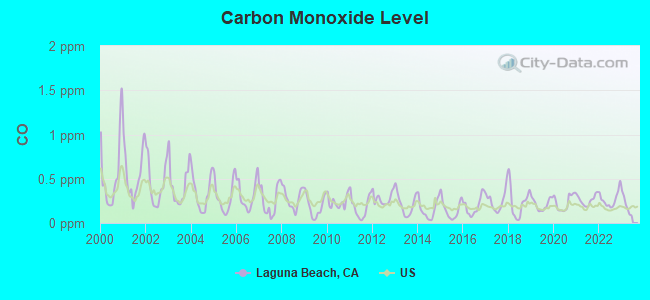
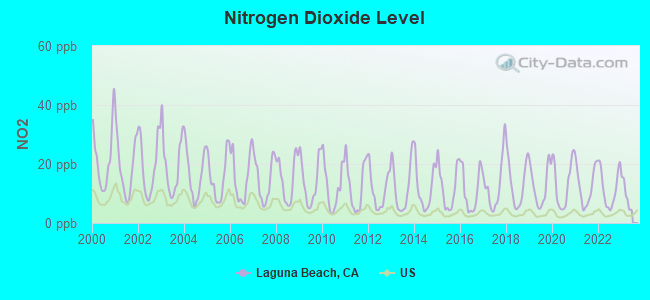
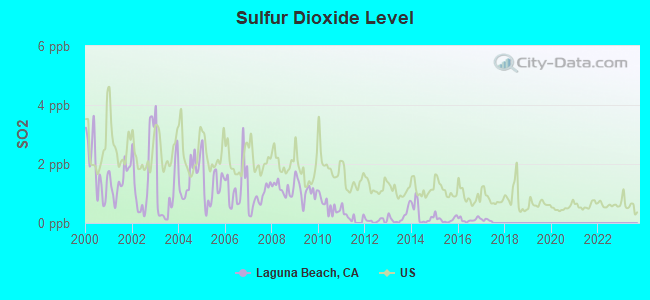
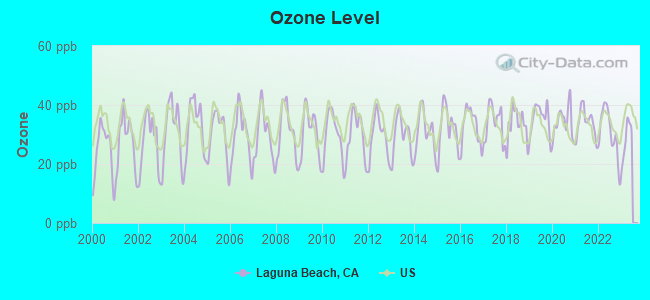
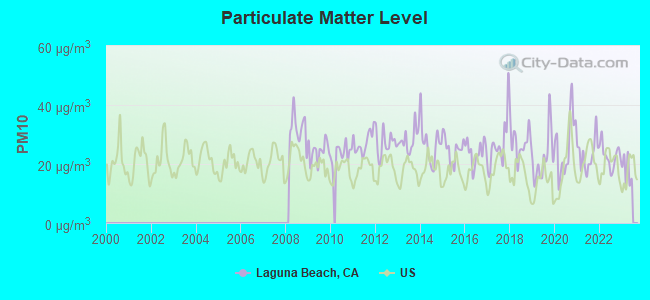
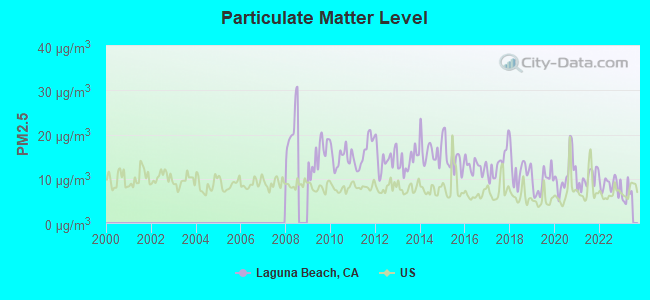
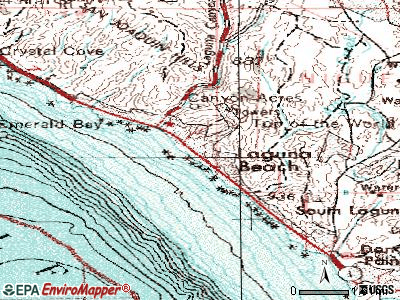
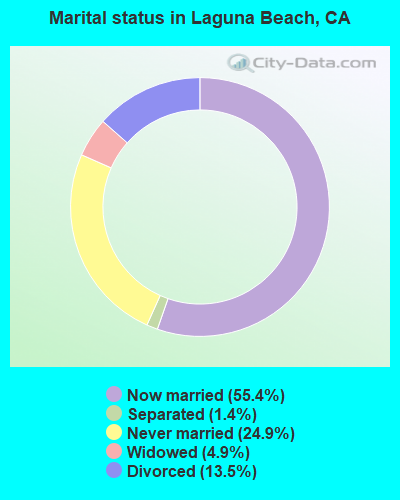
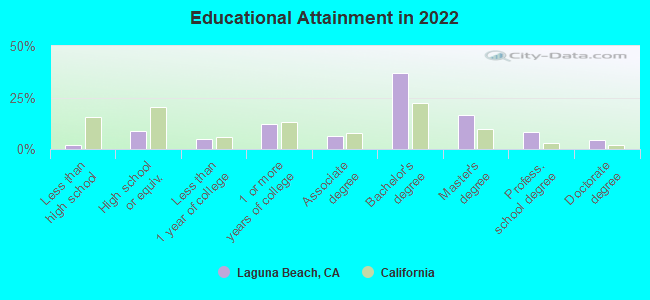
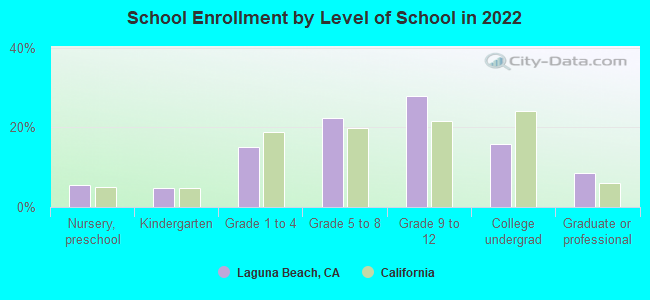
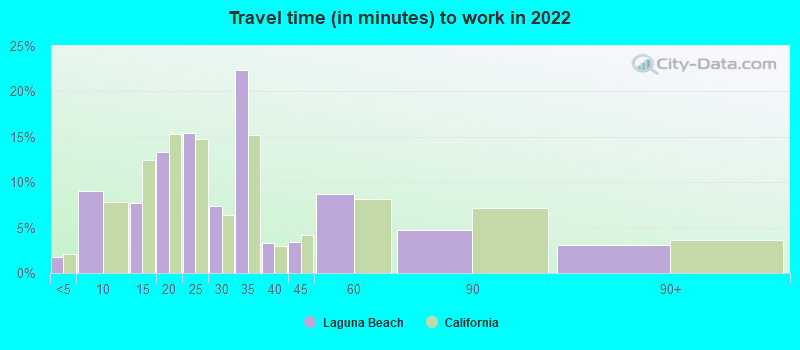
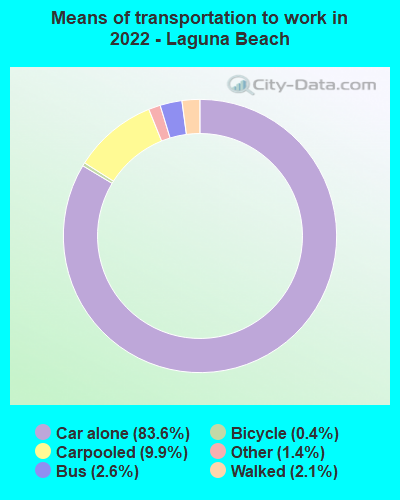


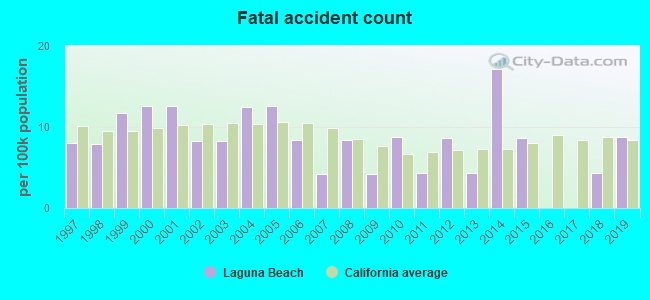
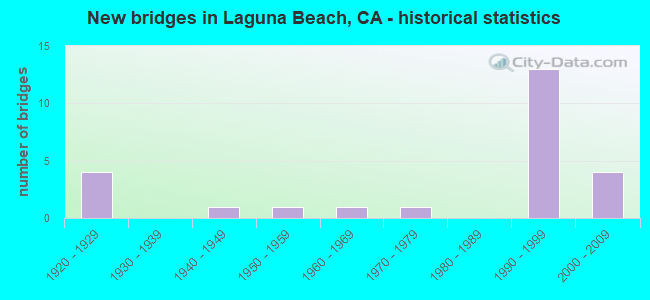
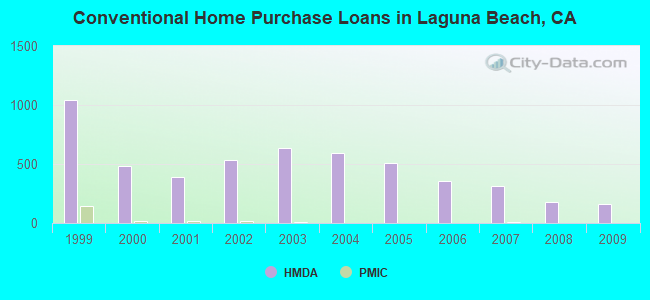
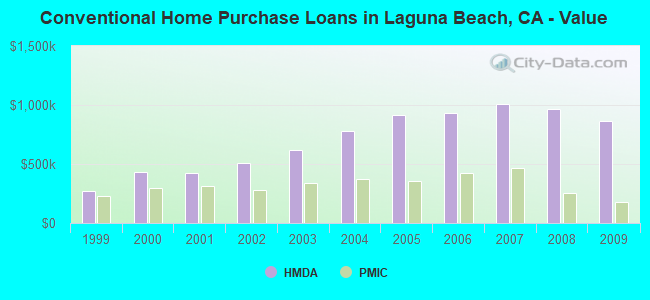
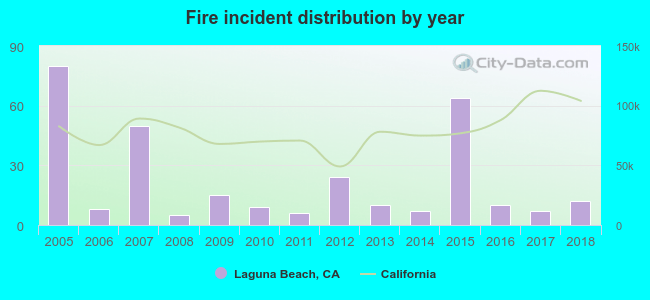 According to the data from the years 2005 - 2018 the average number of fire incidents per year is 22. The highest number of reported fire incidents - 80 took place in 2005, and the least - 5 in 2008. The data has a declining trend.
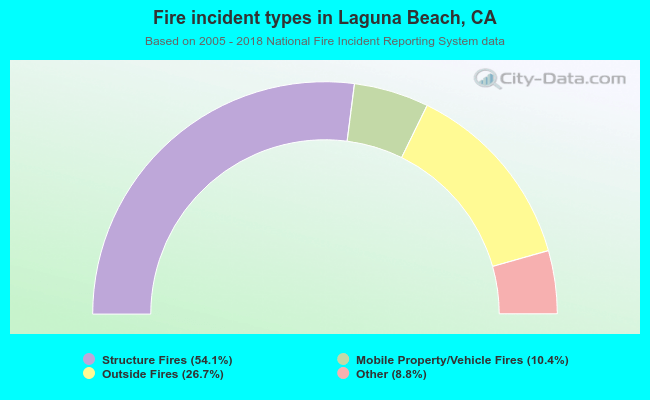 When looking into fire subcategories, the most reports belonged to: Structure Fires (54.1%), and Outside Fires (26.7%).