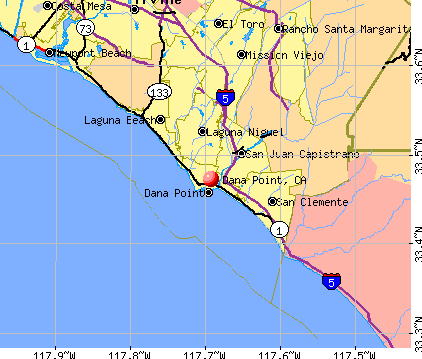
Dana Point, California
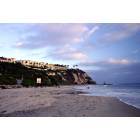
Dana Point: Dana Point at Sunset
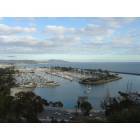
Dana Point: Dana Point Harbor
Dana Point: Small Ship off Dana Point

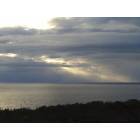
Dana Point: Sunset as seen from Salt Creek Beach
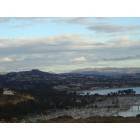
Dana Point: Dana Point Harbor and Hills
Dana Point: View from Salt Creek Beach

Dana Point: Dana Rocks and Gulls
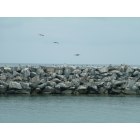
Dana Point: harbor wall

Dana Point: pines park

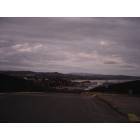
Dana Point: bluff sunset
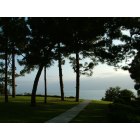
Dana Point: pines park
- see
20
more - add
your
Submit your own pictures of this city and show them to the world
- OSM Map
- General Map
- Google Map
- MSN Map
Population change since 2000: -7.5%
 |
| Males: 15,713 | |
| Females: 16,752 |
| Median resident age: | 50.5 years |
| California median age: | 37.9 years |
Zip codes: 92624, 92629, 92672, 92675.
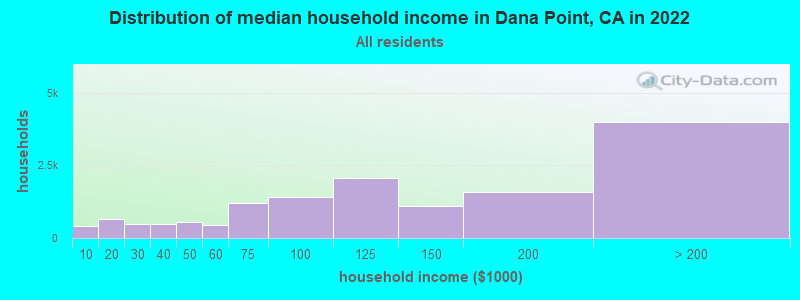
Dana Point Zip Code Map| Dana Point: | $116,184 |
| CA: | $91,551 |
Estimated per capita income in 2022: $75,853 (it was $37,938 in 2000)
Dana Point city income, earnings, and wages data
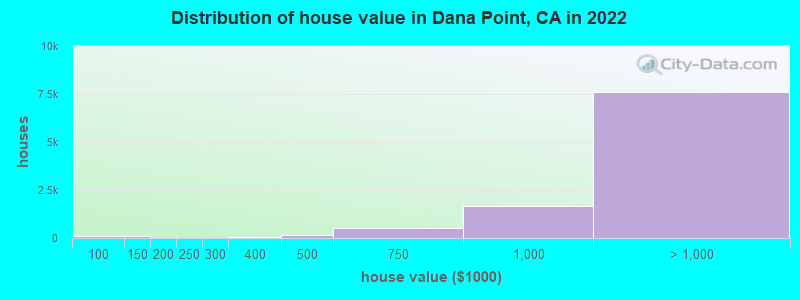
Estimated median house or condo value in 2022: over $1,000,000 (it was $365,400 in 2000)
| Dana Point: | over $1,000,000 |
| CA: | $715,900 |
Mean prices in 2022: all housing units: over $1,000,000; detached houses: over $1,000,000; townhouses or other attached units: over $1,000,000; in 2-unit structures: over $1,000,000; in 3-to-4-unit structures: over $1,000,000; in 5-or-more-unit structures: $729,666; mobile homes: $166,636
Median gross rent in 2022: $2,609.
(5.3% for White Non-Hispanic residents, 7.0% for Black residents, 8.5% for Hispanic or Latino residents, 14.9% for other race residents, 10.0% for two or more races residents)
Detailed information about poverty and poor residents in Dana Point, CA


Compare current foreclosures near Dana Point, CA:
| Photo | Address | Area | Beds / Baths | Price | Details |
|---|---|---|---|---|---|

|
#1
Silver Lantern St
Dana Point, CA 92629
|
3,066 sq. feet
|
4 baths 3 beds |
show details | |

|
#2
Santa Clara Ave
Dana Point, CA 92629
|
3,820 sq. feet
|
3 baths 4 beds |
show details | |

|
#3
Silver Lantern St
Dana Point, CA 92629
|
3,387 sq. feet
|
4 baths 6 beds |
show details | |

|
#4
Palo Alto St
Dana Point, CA 92629
|
1,628 sq. feet
|
2 baths 4 beds |
show details | |

|
#5
Quail Run Unit 96
Dana Point, CA 92629
|
870 sq. feet
|
2 baths 2 beds |
show details | |

|
#6
Sea Aire
Dana Point, CA 92629
|
2,718 sq. feet
|
3 baths 4 beds |
show details | |

|
#7
Priscilla Dr
Dana Point, CA 92629
|
2,067 sq. feet
|
3 baths 4 beds |
show details | |

|
#8
Bayside Ln
Dana Point, CA 92629
|
1,672 sq. feet
|
3 baths 3 beds |
show details | |

|
#9
Tawny Prt
Dana Point, CA 92629
|
- sq. feet
|
- baths - beds |
show details | |

|
#10
Summerwind
Dana Point, CA 92629
|
- sq. feet
|
- baths - beds |
show details |
| Photo | Address | Area | Beds / Baths | Price | Details |
|---|---|---|---|---|---|

|
#11
Bright Water Dr
Dana Point, CA 92629
|
- sq. feet
|
- baths - beds |
show details | |

|
#12
Corniche Dr Unit E
Dana Point, CA 92629
|
- sq. feet
|
- baths - beds |
show details | |

|
#13
Malaga Dr
Dana Point, CA 92629
|
- sq. feet
|
- baths - beds |
show details | |

|
#14
Malaga Dr
Dana Point, CA 92629
|
- sq. feet
|
- baths - beds |
show details | |

|
#15
Amber Lantern St Apt A
Dana Point, CA 92629
|
- sq. feet
|
- baths - beds |
show details | |

|
#16
La Paloma
Dana Point, CA 92629
|
- sq. feet
|
- baths - beds |
show details | |

|
#17
Copper Lantern St Apt A
Dana Point, CA 92629
|
- sq. feet
|
- baths - beds |
show details | |

|
#18
Brookview
Dana Point, CA 92629
|
- sq. feet
|
- baths - beds |
show details | |

|
#19
Pacific Coast Hwy, Ste 14 # 441
Dana Point, CA 92629
|
- sq. feet
|
- baths - beds |
show details | |

|
#20
Mariner Dr Apt 14
Dana Point, CA 92629
|
- sq. feet
|
- baths - beds |
show details |
| Photo | Address | Area | Beds / Baths | Price | Details |
|---|---|---|---|---|---|

|
#21
Olinda Dr Apt 4
Dana Point, CA 92629
|
- sq. feet
|
- baths - beds |
show details | |

|
#22
Danapoplar
Dana Point, CA 92629
|
1,895 sq. feet
|
- baths - beds |
show details | |

|
#23
Pacific Coast Hwy # 441
Dana Point, CA 92629
|
- sq. feet
|
- baths - beds |
show details | |

|
#24
Via Mariposa E Unit C
Laguna Hills, CA 92637
|
1,325 sq. feet
|
2 baths 2 beds |
$409,000
|
show details |

|
#25
Vista Sole St
Dana Point, CA 92629
|
- sq. feet
|
- baths - beds |
show details | |

|
#26
Quail R 96
Dana Point, CA 92629
|
- sq. feet
|
- baths - beds |
show details | |

|
#27
Saint John
Dana Point, CA 92629
|
- sq. feet
|
- baths - beds |
show details | |

|
#28
Greenmoor
Irvine, CA 92614
|
1,171 sq. feet
|
2 baths 2 beds |
show details | |

|
#29
Hidden Trail Rd
Laguna Hills, CA 92653
|
5,762 sq. feet
|
4 baths 5 beds |
show details | |

|
#30
32981 N. Peak Dr.
Trabuco Canyon, CA 92679
|
2,647 sq. feet
|
2 baths 4 beds |
show details |
| Photo | Address | Area | Beds / Baths | Price | Details |
|---|---|---|---|---|---|

|
#31
Scholarship
Irvine, CA 92612
|
1,349 sq. feet
|
1 baths 1 beds |
show details | |

|
#32
Tobago
Laguna Niguel, CA 92677
|
1,605 sq. feet
|
3 baths 3 beds |
show details | |

|
#33
Carmel Dr
Lake Forest, CA 92630
|
1,549 sq. feet
|
2 baths 3 beds |
show details | |

|
#34
Daybreak Ln
Rancho Santa Margarita, CA 92688
|
1,420 sq. feet
|
2 baths 3 beds |
show details | |

|
#35
Seton Rd
Irvine, CA 92612
|
1,779 sq. feet
|
2 baths 3 beds |
show details | |

|
#36
Shady Ln
Laguna Beach, CA 92651
|
995 sq. feet
|
2 baths 3 beds |
show details | |

|
#37
Black Hawk
Irvine, CA 92603
|
4,887 sq. feet
|
4 baths 4 beds |
show details | |

|
#38
Geranium
Irvine, CA 92618
|
1,344 sq. feet
|
2 baths 2 beds |
show details | |

|
#39
Zancon
Mission Viejo, CA 92692
|
1,123 sq. feet
|
2 baths 3 beds |
show details | |

|
#40
E Marquita
San Clemente, CA 92672
|
1,443 sq. feet
|
3 baths 3 beds |
show details |
| Photo | Address | Area | Beds / Baths | Price | Details |
|---|---|---|---|---|---|

|
#41
Flower St
Costa Mesa, CA 92627
|
- sq. feet
|
1 baths 3 beds |
show details | |

|
#42
Glocamora Ln
San Juan Capistrano, CA 92675
|
4,337 sq. feet
|
3 baths 3 beds |
show details | |

|
#43
Via Joaquin
Rancho Santa Margarita, CA 92688
|
1,100 sq. feet
|
2 baths 3 beds |
show details | |

|
#44
Twig St
Lake Forest, CA 92630
|
2,077 sq. feet
|
3 baths 5 beds |
show details | |

|
#45
Saddleback Dr
Mission Viejo, CA 92691
|
2,291 sq. feet
|
3 baths 5 beds |
show details | |

|
#46
Exeter
Irvine, CA 92612
|
981 sq. feet
|
1 baths 2 beds |
show details | |

|
#47
Tabuenca
Mission Viejo, CA 92692
|
1,651 sq. feet
|
2 baths 4 beds |
show details | |

|
#48
Rustling Wind # 8
Irvine, CA 92612
|
2,088 sq. feet
|
2 baths 3 beds |
show details | |

|
#49
Darlington
Mission Viejo, CA 92692
|
1,965 sq. feet
|
3 baths 3 beds |
show details | |

|
Check over 1 million property listings on Foreclosure.com!
|
browse all offers | |||


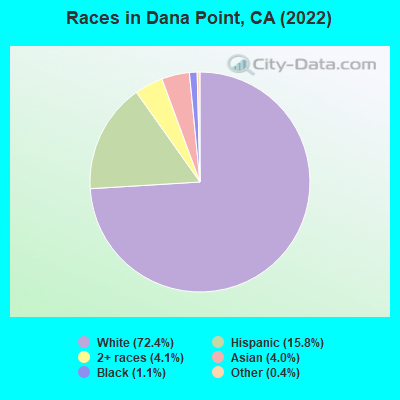
- 23,72472.4%White alone
- 5,18015.8%Hispanic
- 1,3434.1%Two or more races
- 1,3244.0%Asian alone
- 3741.1%Black alone
- 1450.4%Other race alone
- 290.09%Native Hawaiian and Other
Pacific Islander alone
According to our research of California and other state lists, there were 8 registered sex offenders living in Dana Point, California as of April 26, 2024.
The ratio of all residents to sex offenders in Dana Point is 4,306 to 1.
The ratio of registered sex offenders to all residents in this city is much lower than the state average.
Type |
2009 |
2010 |
2011 |
2012 |
2013 |
2014 |
2015 |
2016 |
2017 |
2018 |
2019 |
2020 |
2021 |
2022 |
|---|---|---|---|---|---|---|---|---|---|---|---|---|---|---|
| Murders (per 100,000) | 0 (0.0) | 0 (0.0) | 0 (0.0) | 0 (0.0) | 0 (0.0) | 0 (0.0) | 0 (0.0) | 0 (0.0) | 0 (0.0) | 0 (0.0) | 0 (0.0) | 0 (0.0) | 0 (0.0) | 1 (3.1) |
| Rapes (per 100,000) | 3 (8.4) | 2 (6.0) | 0 (0.0) | 5 (14.6) | 9 (26.3) | 12 (35.0) | 9 (26.2) | 11 (32.0) | 6 (17.6) | 7 (20.6) | 0 (0.0) | 6 (17.9) | 3 (9.0) | 3 (9.2) |
| Robberies (per 100,000) | 13 (36.4) | 13 (39.0) | 5 (14.8) | 13 (38.0) | 10 (29.2) | 7 (20.4) | 12 (35.0) | 17 (49.5) | 22 (64.5) | 13 (38.2) | 18 (53.3) | 8 (23.8) | 4 (12.0) | 9 (27.7) |
| Assaults (per 100,000) | 31 (86.7) | 51 (152.9) | 48 (142.3) | 47 (137.5) | 51 (148.9) | 52 (151.9) | 36 (104.9) | 36 (104.8) | 36 (105.5) | 49 (144.0) | 34 (100.7) | 18 (53.6) | 12 (35.9) | 42 (129.1) |
| Burglaries (per 100,000) | 113 (316.0) | 129 (386.8) | 101 (299.3) | 129 (377.5) | 133 (388.2) | 61 (178.1) | 120 (349.7) | 121 (352.3) | 85 (249.1) | 73 (214.6) | 61 (180.6) | 33 (98.2) | 33 (98.7) | 65 (199.8) |
| Thefts (per 100,000) | 516 (1,443) | 438 (1,313) | 489 (1,449) | 444 (1,299) | 429 (1,252) | 374 (1,092) | 417 (1,215) | 400 (1,165) | 399 (1,169) | 395 (1,161) | 311 (920.7) | 383 (1,140) | 158 (472.4) | 261 (802.2) |
| Auto thefts (per 100,000) | 43 (120.3) | 28 (84.0) | 37 (109.7) | 31 (90.7) | 24 (70.0) | 28 (81.8) | 52 (151.6) | 38 (110.6) | 31 (90.8) | 36 (105.8) | 27 (79.9) | 34 (101.2) | 34 (101.6) | 77 (236.7) |
| Arson (per 100,000) | 7 (19.6) | 4 (12.0) | 0 (0.0) | 2 (5.9) | 0 (0.0) | 2 (5.8) | 1 (2.9) | 0 (0.0) | 1 (2.9) | 0 (0.0) | 0 (0.0) | 1 (3.0) | 1 (3.0) | 2 (6.1) |
| City-Data.com crime index | 124.4 | 133.4 | 120.6 | 136.3 | 142.4 | 127.2 | 137.7 | 141.5 | 126.0 | 126.7 | 92.0 | 92.7 | 51.9 | 112.7 |
The City-Data.com crime index weighs serious crimes and violent crimes more heavily. Higher means more crime, U.S. average is 246.1. It adjusts for the number of visitors and daily workers commuting into cities.
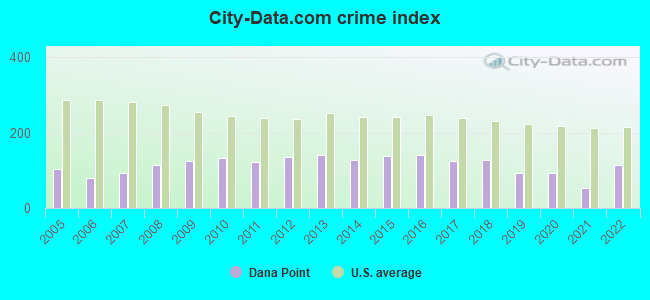
Crime rate in Dana Point detailed stats: murders, rapes, robberies, assaults, burglaries, thefts, arson
Full-time law enforcement employees in 2015, including police officers: 1 (1 officers - 1 male; 0 female).
| Officers per 1,000 residents here: | 0.03 |
| California average: | 1.98 |
 Recent articles from our blog. Our writers, many of them Ph.D. graduates or candidates, create easy-to-read articles on a wide variety of topics.


Latest news from Dana Point, CA collected exclusively by city-data.com from local newspapers, TV, and radio stations
Dana Point, CA City Guides:
Ancestries: English (8.7%), Irish (8.4%), German (6.6%), American (5.9%), Italian (4.5%), European (3.9%).
Current Local Time: PST time zone
Elevation: 160 feet
Land area: 6.64 square miles.
Population density: 4,892 people per square mile (average).
4,497 residents are foreign born (3.9% Europe, 3.7% Asia, 3.7% Latin America).
| This city: | 13.7% |
| California: | 26.5% |
Median real estate property taxes paid for housing units with mortgages in 2022: $7,680 (0.6%)
Median real estate property taxes paid for housing units with no mortgage in 2022: $7,473 (0.6%)
Nearest city with pop. 50,000+: South Coast, CA (3.2 miles  , pop. 288,147).
Nearest city with pop. 1,000,000+: San Diego, CA (57.4 miles , pop. 1,223,400).
Nearest cities:
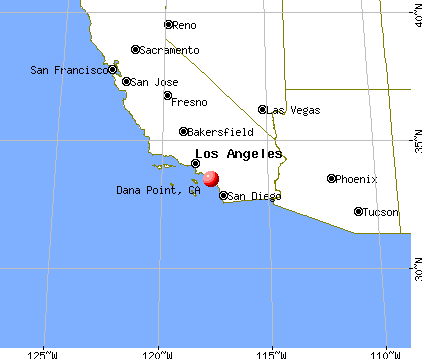
), ), )Latitude: 33.47 N, Longitude: 117.69 W
Daytime population change due to commuting: -2,625 (-8.0%)
Workers who live and work in this city: 6,923 (41.6%)
Dana Point tourist attractions:
Dana Point, California accommodation & food services, waste management - Economy and Business Data
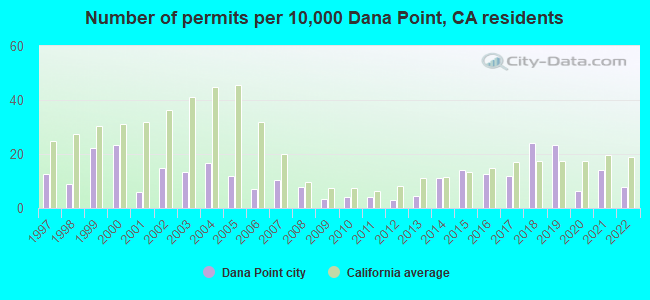
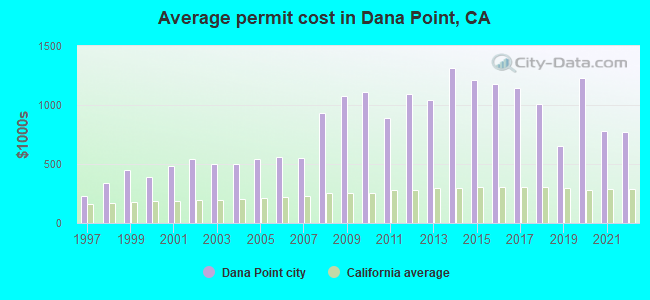
Single-family new house construction building permits:
- 2022: 27 buildings, average cost: $769,700
- 2021: 49 buildings, average cost: $782,900
- 2020: 22 buildings, average cost: $1,226,300
- 2019: 82 buildings, average cost: $649,300
- 2018: 85 buildings, average cost: $1,012,300
- 2017: 41 buildings, average cost: $1,146,000
- 2016: 44 buildings, average cost: $1,179,400
- 2015: 49 buildings, average cost: $1,211,600
- 2014: 39 buildings, average cost: $1,314,200
- 2013: 15 buildings, average cost: $1,041,700
- 2012: 11 buildings, average cost: $1,088,700
- 2011: 14 buildings, average cost: $891,700
- 2010: 14 buildings, average cost: $1,107,600
- 2009: 12 buildings, average cost: $1,077,200
- 2008: 27 buildings, average cost: $931,300
- 2007: 37 buildings, average cost: $551,300
- 2006: 25 buildings, average cost: $556,300
- 2005: 41 buildings, average cost: $540,600
- 2004: 59 buildings, average cost: $500,800
- 2003: 47 buildings, average cost: $500,400
- 2002: 52 buildings, average cost: $539,000
- 2001: 21 buildings, average cost: $482,100
- 2000: 82 buildings, average cost: $389,300
- 1999: 78 buildings, average cost: $446,400
- 1998: 31 buildings, average cost: $334,800
- 1997: 44 buildings, average cost: $229,300
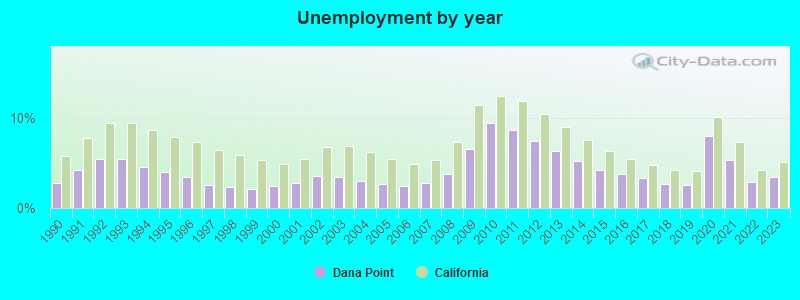
| Here: | 3.4% |
| California: | 5.1% |
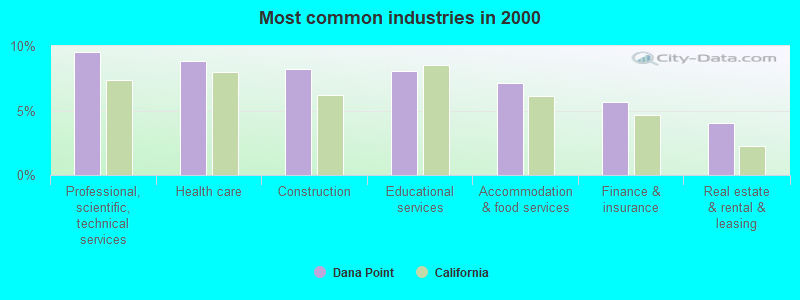
- Professional, scientific, technical services (9.5%)
- Health care (8.8%)
- Construction (8.2%)
- Educational services (8.1%)
- Accommodation & food services (7.1%)
- Finance & insurance (5.7%)
- Real estate & rental & leasing (4.1%)
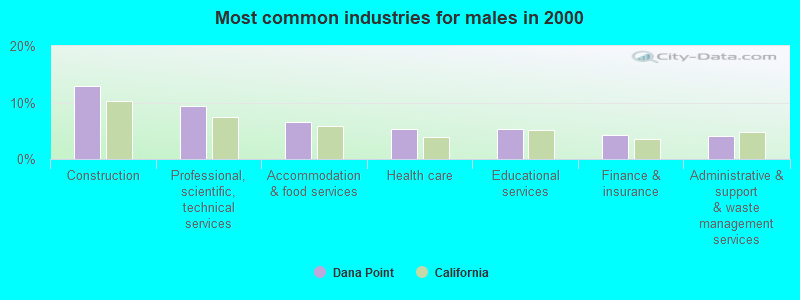
- Construction (12.8%)
- Professional, scientific, technical services (9.5%)
- Accommodation & food services (6.6%)
- Health care (5.3%)
- Educational services (5.3%)
- Finance & insurance (4.3%)
- Administrative & support & waste management services (4.0%)
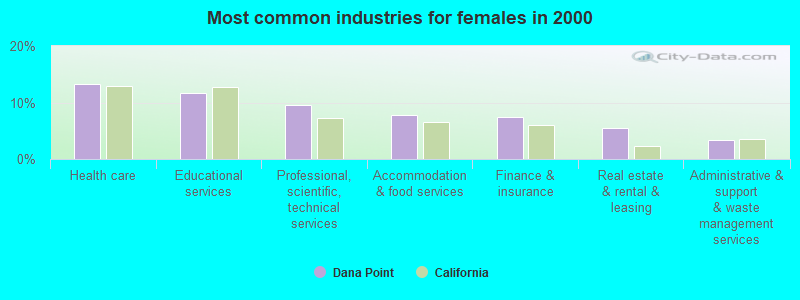
- Health care (13.3%)
- Educational services (11.7%)
- Professional, scientific, technical services (9.6%)
- Accommodation & food services (7.8%)
- Finance & insurance (7.5%)
- Real estate & rental & leasing (5.5%)
- Administrative & support & waste management services (3.4%)
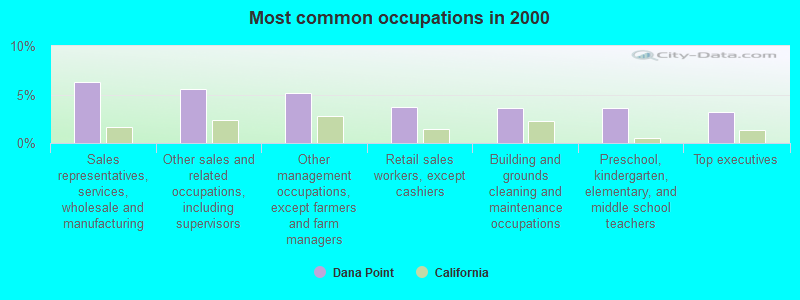
- Sales representatives, services, wholesale and manufacturing (6.2%)
- Other sales and related occupations, including supervisors (5.6%)
- Other management occupations, except farmers and farm managers (5.2%)
- Retail sales workers, except cashiers (3.7%)
- Building and grounds cleaning and maintenance occupations (3.6%)
- Preschool, kindergarten, elementary, and middle school teachers (3.6%)
- Top executives (3.2%)
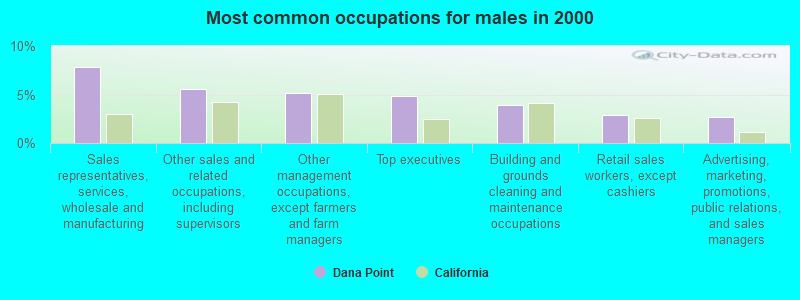
- Sales representatives, services, wholesale and manufacturing (7.8%)
- Other sales and related occupations, including supervisors (5.6%)
- Other management occupations, except farmers and farm managers (5.2%)
- Top executives (4.9%)
- Building and grounds cleaning and maintenance occupations (3.9%)
- Retail sales workers, except cashiers (2.9%)
- Advertising, marketing, promotions, public relations, and sales managers (2.7%)
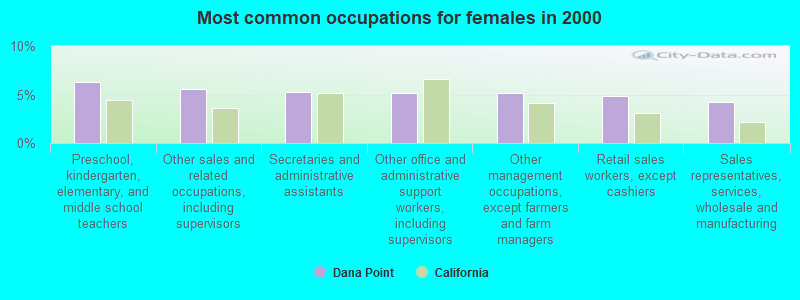
- Preschool, kindergarten, elementary, and middle school teachers (6.3%)
- Other sales and related occupations, including supervisors (5.6%)
- Secretaries and administrative assistants (5.3%)
- Other office and administrative support workers, including supervisors (5.1%)
- Other management occupations, except farmers and farm managers (5.1%)
- Retail sales workers, except cashiers (4.8%)
- Sales representatives, services, wholesale and manufacturing (4.2%)
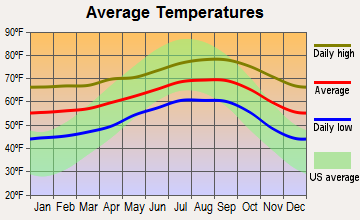
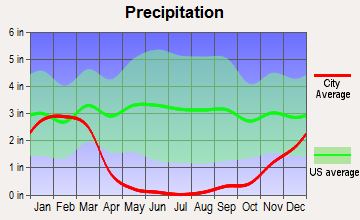
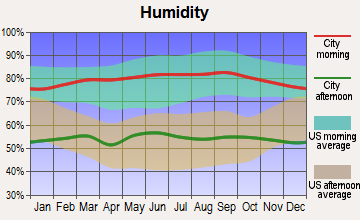
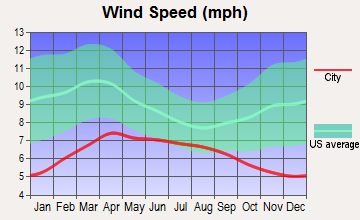
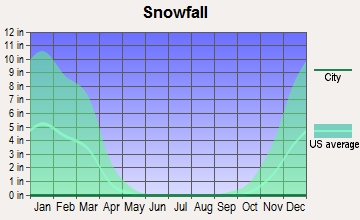
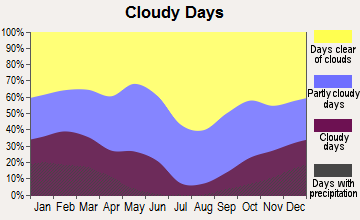
Average climate in Dana Point, California
Based on data reported by over 4,000 weather stations
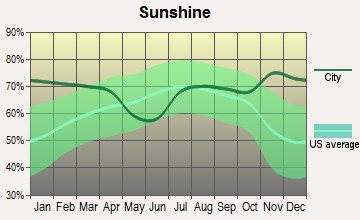
(lower is better)
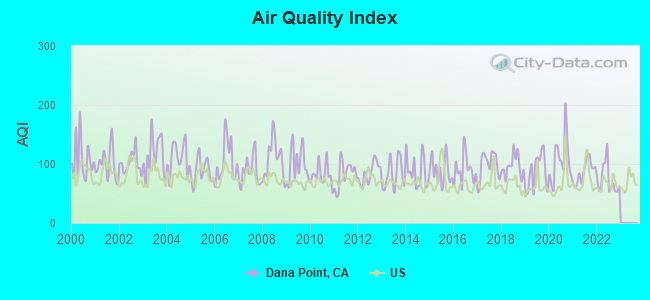
Air Quality Index (AQI) level in 2022 was 73.3. This is about average.
| City: | 73.3 |
| U.S.: | 72.6 |
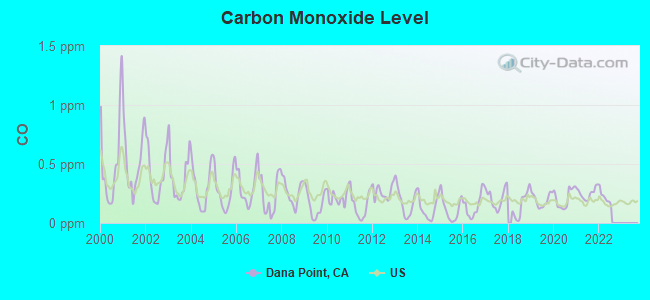
Carbon Monoxide (CO) [ppm] level in 2022 was 0.220. This is about average. Closest monitor was 7.2 miles away from the city center.
| City: | 0.220 |
| U.S.: | 0.251 |
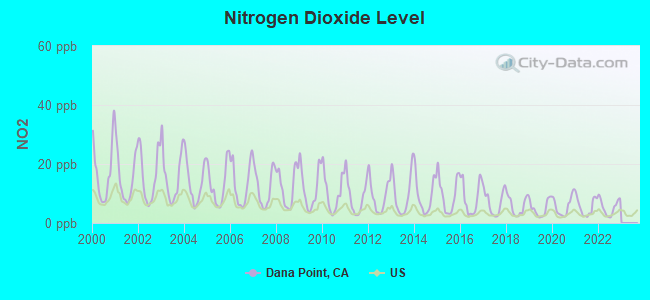
Nitrogen Dioxide (NO2) [ppb] level in 2022 was 5.41. This is about average. Closest monitor was 10.7 miles away from the city center.
| City: | 5.41 |
| U.S.: | 5.11 |
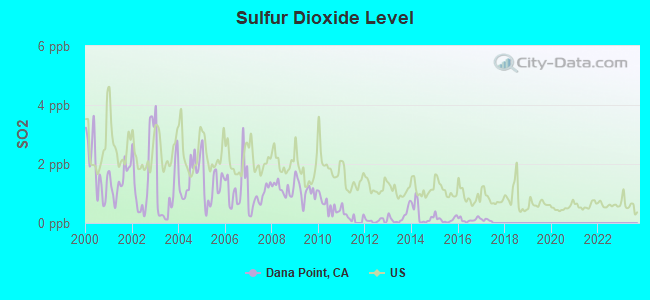
Sulfur Dioxide (SO2) [ppb] level in 2016 was 0.113. This is significantly better than average. Closest monitor was 10.7 miles away from the city center.
| City: | 0.113 |
| U.S.: | 1.515 |
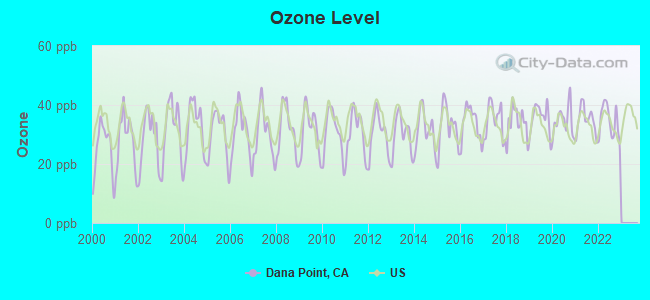
Ozone [ppb] level in 2022 was 34.3. This is about average. Closest monitor was 10.7 miles away from the city center.
| City: | 34.3 |
| U.S.: | 33.3 |
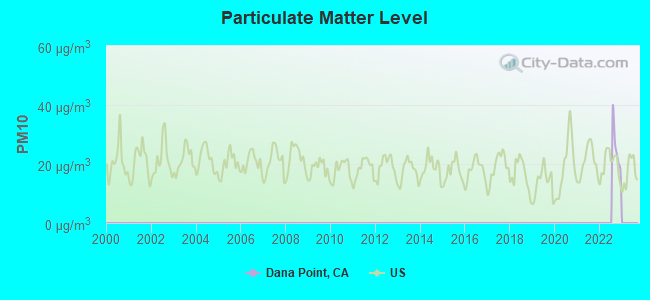
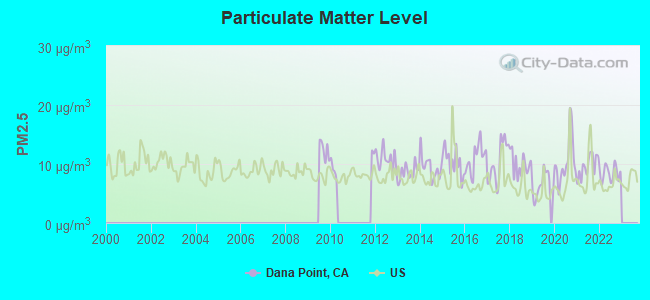
Particulate Matter (PM2.5) [µg/m3] level in 2022 was 8.42. This is about average. Closest monitor was 11.0 miles away from the city center.
| City: | 8.42 |
| U.S.: | 8.11 |
Earthquake activity:
Dana Point-area historical earthquake activity is significantly above California state average. It is 6569% greater than the overall U.S. average.On 6/28/1992 at 11:57:34, a magnitude 7.6 (6.2 MB, 7.6 MS, 7.3 MW, Depth: 0.7 mi, Class: Major, Intensity: VIII - XII) earthquake occurred 82.9 miles away from Dana Point center, causing 3 deaths (1 shaking deaths, 2 other deaths) and 400 injuries, causing $100,000,000 total damage and $40,000,000 insured losses
On 7/21/1952 at 11:52:14, a magnitude 7.7 (7.7 UK) earthquake occurred 129.4 miles away from the city center, causing $50,000,000 total damage
On 10/16/1999 at 09:46:44, a magnitude 7.4 (6.3 MB, 7.4 MS, 7.2 MW, 7.3 ML) earthquake occurred 102.0 miles away from the city center
On 5/19/1940 at 04:36:40, a magnitude 7.2 (7.2 UK) earthquake occurred 116.6 miles away from the city center, causing $33,000,000 total damage
On 4/21/1918 at 22:32:30, a magnitude 6.8 (6.8 UK, Class: Strong, Intensity: VII - IX) earthquake occurred 27.7 miles away from Dana Point center
On 11/4/1927 at 13:51:53, a magnitude 7.5 (7.5 UK) earthquake occurred 215.5 miles away from Dana Point center
Magnitude types: body-wave magnitude (MB), local magnitude (ML), surface-wave magnitude (MS), moment magnitude (MW)
Natural disasters:
The number of natural disasters in Orange County (32) is a lot greater than the US average (15).Major Disasters (Presidential) Declared: 22
Emergencies Declared: 2
Causes of natural disasters: Floods: 15, Fires: 13, Storms: 9, Landslides: 6, Winter Storms: 6, Mudslides: 5, Earthquakes: 2, Heavy Rain: 1, Hurricane: 1, Snow: 1, Tornado: 1, Wind: 1, Other: 1 (Note: some incidents may be assigned to more than one category).

Hospitals and medical centers in Dana Point:
Other hospitals and medical centers near Dana Point:
- SADDLEBACK MEMORIAL MEDICAL CENTER - SAN CLEMENTE (Hospital, about 3 miles away; SAN CLEMENTE, CA)
- SAN CLEMENTE HOSP AND MED D/P SNF (Nursing Home, about 3 miles away; SAN CLEMENTE, CA)
- SILVERADO HOSPICE INC (Hospital, about 3 miles away; SAN JUAN CAPISTRANO, CA)
- CAPISTRANO BEACH CARE CENTER (Nursing Home, about 3 miles away; CAPISTRANO BEACH, CA)
- SAN JUAN CAPISTRANO SOUTH DIALYSIS (Dialysis Facility, about 4 miles away; SAN JUAN CAPISTRANO, CA)
- EMERITUS AT SAN JUAN CAPISTRANO (Nursing Home, about 4 miles away; SAN JUAN CAPISTRANO, CA)
- SOUTH COAST MEDICAL CENTER HOME CARE (Home Health Center, about 4 miles away; LAGUNA BEACH, CA)
Amtrak stations near Dana Point:
- 3 miles: SAN JUAN CAPISTRANO (LEE HALL, MONTEREY AVE. & SAN GORGONIO WAY) . Services: ticket office, fully wheelchair accessible, enclosed waiting area, public restrooms, public payphones, full-service food facilities, paid short-term parking, paid long-term parking, call for taxi service, intercity bus service, public transit connection.
- 6 miles: SAN CLEMENTE PIER (SAN CLEMENTE, MUNICIPAL PIER) . Services: free short-term parking, paid long-term parking, public transit connection.
- 8 miles: LAGUNA BEACH (TRANSIT DEPOT, BROADWAY BTW. BEACH & FOR) - Bus Station
Operable nuclear power plants near Dana Point:
- 5 miles: San Onofre 2 and 3 in San Clemente, CA.
Colleges/universities with over 2000 students nearest to Dana Point:
- Saddleback College (about 6 miles; Mission Viejo, CA; Full-time enrollment: 13,716)
- Brandman University (about 14 miles; Irvine, CA; FT enrollment: 6,027)
- Coastline Community College (about 14 miles; Fountain Valley, CA; FT enrollment: 4,591)
- Concordia University-Irvine (about 15 miles; Irvine, CA; FT enrollment: 3,284)
- Irvine Valley College (about 15 miles; Irvine, CA; FT enrollment: 8,005)
- University of California-Irvine (about 15 miles; Irvine, CA; FT enrollment: 28,587)
- Vanguard University of Southern California (about 18 miles; Costa Mesa, CA; FT enrollment: 2,104)
Public high schools in Dana Point:
- DANA HILLS HIGH (Students: 2,063, Location: 33333 GOLDEN LANTERN, Grades: 9-12)
- OPPORTUNITIES FOR LEARNING - CAPISTRANO (Location: 33621 DEL OBISPO ST., STE. E, Grades: KG-12, Charter school)
Public elementary/middle schools in Dana Point:
- RICHARD HENRY DANA ELEMENTARY (Students: 220, Location: 24242 LA CRESTA DR., Grades: KG-5)
- RICHARD HENRY DANA EXCEPTIONAL NEEDS (Students: 40, Location: 24242 LA CRESTA DR., Grades: KG-6)
Private elementary/middle schools in Dana Point:
Points of interest:
Notable locations in Dana Point: Serra (A), Orange County Marine Institute (B), Ken Sampson Overlook (C), Dana Niguel Branch Orange County Public Library (D), Orange County Fire Authority Station 30 (E), Orange County Fire Authority Station 29 (F). Display/hide their locations on the map
Shopping Centers: Monarch Bay Plaza Shopping Center (1), Lantern Bay Village Shopping Center (2), Capistrano Valley Plaza Shopping Center (3). Display/hide their locations on the map
Streams, rivers, and creeks: Arroyo Salado (A), Salt Creek (B), San Juan Creek (C). Display/hide their locations on the map
Parks in Dana Point include: Doheny State Beach (1), Capistrano Beach Park (2), Doheny Marine Life Refuge (3), Salt Creek Beach Park (4), Dana Cove Park (5), Del Obispo Community Park (6), Gazebo Park (7), Heritage Park (8), Lantern Bay County Park (9). Display/hide their locations on the map
Beach: Poche Beach (A). Display/hide its location on the map
Tourist attraction: Dana Point Historical Society (Cultural Attractions- Events- & Facilities; 24642 San Juan Avenue).
Hotels: Blue Lantern Inn (34343 Blue Lantern Street), BNBINNS (P.O. Box 669).
Birthplace of: Melinda Clarke - Actress, Brian Ireland - Drummer, Steve Hegg - Racing cyclist, Dana Brown - Documentary filmmaker.
Drinking water stations with addresses in Dana Point and their reported violations in the past:
ALPINE OAKS ESTATES LLC (Population served: 125, Groundwater):Past health violations:Past monitoring violations:
- MCL, Monthly (TCR) - In FEB-2011, Contaminant: Coliform. Follow-up actions: St Boil Water Order (FEB-24-2011)
- MCL, Acute (TCR) - In FEB-2008, Contaminant: Coliform. Follow-up actions: St Boil Water Order (MAR-06-2008)
- Initial Tap Sampling for Pb and Cu - In JUL-01-1993, Contaminant: Lead and Copper Rule. Follow-up actions: Fed Compliance achieved (SEP-30-2005)
- 2 routine major monitoring violations
- One regular monitoring violation
| This city: | 2.3 people |
| California: | 2.9 people |
| This city: | 61.9% |
| Whole state: | 68.7% |
| This city: | 6.5% |
| Whole state: | 7.2% |
Likely homosexual households (counted as self-reported same-sex unmarried-partner households)
- Lesbian couples: 0.4% of all households
- Gay men: 0.6% of all households
People in group quarters in Dana Point in 2010:
- 78 people in other noninstitutional facilities
- 77 people in nursing facilities/skilled-nursing facilities
- 51 people in group homes intended for adults
- 25 people in residential treatment centers for adults
- 6 people in workers' group living quarters and job corps centers
- 4 people in correctional residential facilities
People in group quarters in Dana Point in 2000:
- 95 people in nursing homes
- 81 people in homes or halfway houses for drug/alcohol abuse
- 38 people in other noninstitutional group quarters
- 15 people in homes for the mentally retarded
- 13 people in homes for the physically handicapped
Banks with branches in Dana Point (2011 data):
- Bank of America, National Association: Ocean Ranch Branch at 32595 Golden Lantern Street, branch established on 2006/06/19; Dana Point Branch at 24801 Del Prado, branch established on 1990/06/18. Info updated 2009/11/18: Bank assets: $1,451,969.3 mil, Deposits: $1,077,176.8 mil, headquarters in Charlotte, NC, positive income, 5782 total offices, Holding Company: Bank Of America Corporation
- U.S. Bank National Association: Dana Point Branch at 33621 Del Obispo Street, Suite A, branch established on 1996/02/12. Info updated 2012/01/30: Bank assets: $330,470.8 mil, Deposits: $236,091.5 mil, headquarters in Cincinnati, OH, positive income, 3121 total offices, Holding Company: U.S. Bancorp
- Union Bank, National Association: Dana Point Branch at 34177 Pacific Coast Highway, branch established on 1966/06/22. Info updated 2011/09/01: Bank assets: $88,967.5 mil, Deposits: $65,286.4 mil, headquarters in San Francisco, CA, positive income, Commercial Lending Specialization, 403 total offices, Holding Company: Mitsubishi Ufj Financial Group, Inc.
- Pacific Western Bank: Dana Point Office at 34180 Pacific Coast Highway, branch established on 2000/06/27. Info updated 2011/03/14: Bank assets: $5,513.1 mil, Deposits: $4,614.5 mil, headquarters in Los Angeles, CA, positive income, Commercial Lending Specialization, 78 total offices, Holding Company: Capgen Capital Group Ii Lp
- JPMorgan Chase Bank, National Association: Dana Point Branch at 5 Manarch Bay Plaza, branch established on 2007/07/09. Info updated 2011/11/10: Bank assets: $1,811,678.0 mil, Deposits: $1,190,738.0 mil, headquarters in Columbus, OH, positive income, International Specialization, 5577 total offices, Holding Company: Jpmorgan Chase & Co.
For population 15 years and over in Dana Point:
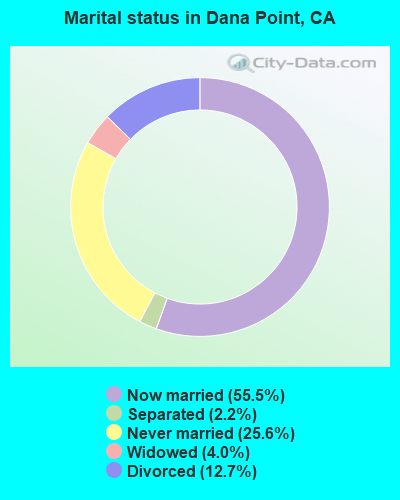
- Never married: 25.6%
- Now married: 55.5%
- Separated: 2.2%
- Widowed: 4.0%
- Divorced: 12.7%
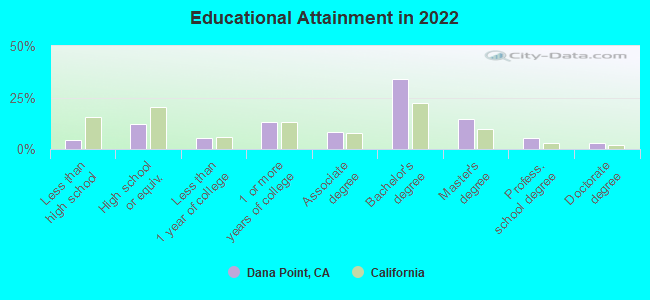
For population 25 years and over in Dana Point:
- High school or higher: 95.5%
- Bachelor's degree or higher: 55.2%
- Graduate or professional degree: 22.1%
- Unemployed: 3.8%
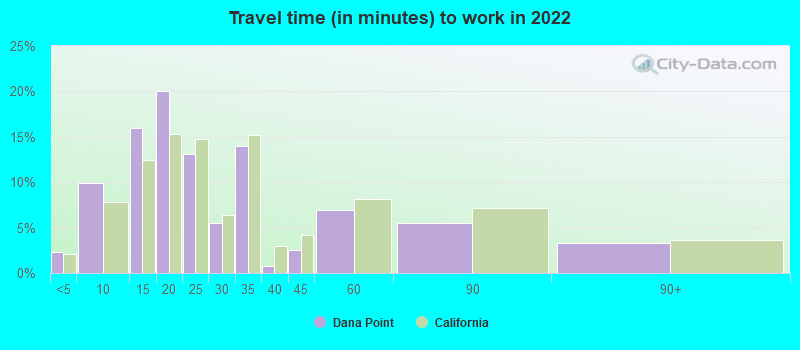
- Mean travel time to work (commute): 19.6 minutes
| Here: | 10.1 |
| California average: | 15.5 |


Graphs represent county-level data. Detailed 2008 Election Results
Religion statistics for Dana Point, CA (based on Orange County data)


| Religion | Adherents | Congregations |
|---|---|---|
| Catholic | 797,473 | 67 |
| Evangelical Protestant | 345,893 | 894 |
| Other | 141,815 | 329 |
| Mainline Protestant | 76,574 | 202 |
| Orthodox | 13,406 | 19 |
| Black Protestant | 2,424 | 8 |
| None | 1,632,647 | - |
Food Environment Statistics:
| Orange County: | 1.78 / 10,000 pop. |
| California: | 2.14 / 10,000 pop. |
| Orange County: | 0.06 / 10,000 pop. |
| State: | 0.04 / 10,000 pop. |
| Orange County: | 0.49 / 10,000 pop. |
| California: | 0.62 / 10,000 pop. |
| Orange County: | 1.46 / 10,000 pop. |
| California: | 1.49 / 10,000 pop. |
| This county: | 8.19 / 10,000 pop. |
| California: | 7.42 / 10,000 pop. |
| Orange County: | 6.3% |
| California: | 7.3% |
| Orange County: | 18.5% |
| California: | 21.3% |
| Orange County: | 16.4% |
| California: | 17.9% |
Health and Nutrition:
| This city: | 50.7% |
| State: | 49.4% |
| Dana Point: | 49.3% |
| California: | 48.0% |
| Dana Point: | 28.3 |
| California: | 28.1 |
| This city: | 21.2% |
| State: | 20.2% |
| Dana Point: | 8.7% |
| California: | 11.2% |
| Here: | 6.8 |
| California: | 6.8 |
| Dana Point: | 34.5% |
| California: | 31.5% |
| Here: | 57.7% |
| State: | 56.4% |
| Dana Point: | 79.4% |
| California: | 80.9% |
More about Health and Nutrition of Dana Point, CA Residents
| Local government employment and payroll (March 2022) | |||||
| Function | Full-time employees | Monthly full-time payroll | Average yearly full-time wage | Part-time employees | Monthly part-time payroll |
|---|---|---|---|---|---|
| Housing and Community Development (Local) | 23 | $229,158 | $119,561 | 3 | $11,661 |
| Streets and Highways | 16 | $178,365 | $133,774 | 1 | $1,370 |
| Parks and Recreation | 9 | $78,800 | $105,067 | 6 | $12,664 |
| Other Government Administration | 9 | $84,661 | $112,881 | 13 | $14,365 |
| Other and Unallocable | 4 | $45,487 | $136,461 | 1 | $1,982 |
| Financial Administration | 2 | $30,880 | $185,280 | 3 | $14,451 |
| Natural Resources | 1 | $9,211 | $110,532 | 1 | $1,808 |
| Totals for Government | 64 | $656,562 | $123,105 | 28 | $58,301 |
Dana Point government finances - Expenditure in 2017 (per resident):
- Construction - Regular Highways: $4,461,000 ($137.41)
- Current Operations - Police Protection: $11,667,000 ($359.37)
Parks and Recreation: $7,595,000 ($233.94)
Central Staff Services: $6,476,000 ($199.48)
Protective Inspection and Regulation - Other: $5,242,000 ($161.47)
Regular Highways: $4,476,000 ($137.87)
Financial Administration: $1,114,000 ($34.31)
General - Other: $346,000 ($10.66)
Health - Other: $334,000 ($10.29)
- General - Interest on Debt: $786,000 ($24.21)
- Intergovernmental to Local - Other - Police Protection: $12,621,000 ($388.76)
Other - General - Other: $142,000 ($4.37)
Dana Point government finances - Revenue in 2017 (per resident):
- Charges - Other: $1,462,000 ($45.03)
Parks and Recreation: $205,000 ($6.31)
- Local Intergovernmental - Other: $49,000 ($1.51)
- Miscellaneous - General Revenue - Other: $885,000 ($27.26)
Fines and Forfeits: $328,000 ($10.10)
Interest Earnings: $322,000 ($9.92)
Rents: $89,000 ($2.74)
- State Intergovernmental - Other: $1,043,000 ($32.13)
Highways: $646,000 ($19.90)
General Local Government Support: $47,000 ($1.45)
- Tax - Other Selective Sales: $13,099,000 ($403.48)
Property: $11,509,000 ($354.50)
General Sales and Gross Receipts: $5,862,000 ($180.56)
Other License: $1,786,000 ($55.01)
Public Utilities Sales: $1,372,000 ($42.26)
Other: $1,027,000 ($31.63)
Documentary and Stock Transfer: $591,000 ($18.20)
Dana Point government finances - Debt in 2017 (per resident):
- Long Term Debt - Beginning Outstanding - Unspecified Public Purpose: $19,652,000 ($605.33)
Outstanding Unspecified Public Purpose: $18,842,000 ($580.38)
Retired Unspecified Public Purpose: $810,000 ($24.95)
Dana Point government finances - Cash and Securities in 2017 (per resident):
- Bond Funds - Cash and Securities: $7,732,000 ($238.16)
- Other Funds - Cash and Securities: $22,624,000 ($696.87)
4.86% of this county's 2021 resident taxpayers lived in other counties in 2020 ($95,983 average adjusted gross income)
| Here: | 4.86% |
| California average: | 5.19% |
0.01% of residents moved from foreign countries ($132 average AGI)
Orange County: 0.01% California average: 0.03%
Top counties from which taxpayers relocated into this county between 2020 and 2021:
| from Los Angeles County, CA | |
| from Riverside County, CA | |
| from San Diego County, CA |
5.71% of this county's 2020 resident taxpayers moved to other counties in 2021 ($106,828 average adjusted gross income)
| Here: | 5.71% |
| California average: | 6.14% |
0.01% of residents moved to foreign countries ($180 average AGI)
Orange County: 0.01% California average: 0.02%
Top counties to which taxpayers relocated from this county between 2020 and 2021:
| to Los Angeles County, CA | |
| to Riverside County, CA | |
| to San Diego County, CA |
| Businesses in Dana Point, CA | ||||
| Name | Count | Name | Count | |
|---|---|---|---|---|
| AT&T | 1 | Holiday Inn | 1 | |
| Albertsons | 1 | Jamba Juice | 1 | |
| Baskin-Robbins | 1 | Jones New York | 1 | |
| Best Western | 1 | Kroger | 2 | |
| Burger King | 1 | Marriott | 2 | |
| CVS | 2 | MasterBrand Cabinets | 2 | |
| Carl\s Jr. | 1 | McDonald's | 1 | |
| Circle K | 3 | Nike | 1 | |
| Dennys | 1 | RadioShack | 1 | |
| Domino's Pizza | 1 | Rite Aid | 1 | |
| El Pollo Loco | 1 | Starbucks | 4 | |
| FedEx | 4 | T-Mobile | 1 | |
| GameStop | 1 | Taco Bell | 1 | |
| H&R Block | 1 | UPS | 2 | |
| Hilton | 1 | Vans | 3 | |
Strongest AM radio stations in Dana Point:
- KFI (640 AM; 50 kW; LOS ANGELES, CA; Owner: CAPSTAR TX LIMITED PARTNERSHIP)
- KPLS (830 AM; 50 kW; ORANGE, CA; Owner: CRN LICENSES, LLC)
- KLAC (570 AM; 50 kW; LOS ANGELES, CA; Owner: AMFM RADIO LICENSES, L.L.C.)
- KTNQ (1020 AM; 50 kW; LOS ANGELES, CA; Owner: KTNQ-AM LICENSE CORP.)
- KXTA (1150 AM; 50 kW; LOS ANGELES, CA; Owner: CITICASTERS LICENSES, L.P.)
- KNX (1070 AM; 50 kW; LOS ANGELES, CA; Owner: INFINITY BROADCASTING OPERATIONS, INC.)
- KFWB (980 AM; 50 kW; LOS ANGELES, CA; Owner: INFINITY BROADCASTING OPERATIONS, INC.)
- KDIS (1110 AM; 50 kW; PASADENA, CA; Owner: ABC,INC.)
- KFMB (760 AM; 50 kW; SAN DIEGO, CA; Owner: MIDWEST TELEVISION, INC.)
- KSPN (710 AM; 50 kW; LOS ANGELES, CA; Owner: KABC-AM RADIO, INC.)
- KMPC (1540 AM; 50 kW; LOS ANGELES, CA; Owner: ROSE CITY RADIO CORPORATION)
- KCBQ (1170 AM; 50 kW; SAN DIEGO, CA; Owner: RADIO 1210, INC.)
- KBLA (1580 AM; 50 kW; SANTA MONICA, CA)
Strongest FM radio stations in Dana Point:
- KWVE (107.9 FM; SAN CLEMENTE, CA; Owner: CALVARY CHAPEL OF COSTA MESA)
- KSBR (88.5 FM; MISSION VIEJO, CA; Owner: SADDLEBACK COMMUNITY COLLEGE DIST.)
- KRTM (88.9 FM; TEMECULA, CA; Owner: PENFOLD COMMUNICATIONS, INC.)
- KDLE (103.1 FM; NEWPORT BEACH, CA; Owner: ENTRAVISION HOLDINGS, LLC.)
- KLRD (90.1 FM; YUCAIPA, CA; Owner: EDUCATIONAL MEDIA FOUNDATION)
- KCBS-FM (93.1 FM; LOS ANGELES, CA; Owner: INFINITY BROADCASTING OPERATIONS, INC.)
- KUOR-FM (89.1 FM; REDLANDS, CA; Owner: UNIVERSITY OF REDLANDS)
- KZLA-FM (93.9 FM; LOS ANGELES, CA; Owner: EMMIS RADIO LICENSE CORPORATION)
- KSCA (101.9 FM; GLENDALE, CA; Owner: HBC LICENSE CORPORATION)
- KLOS (95.5 FM; LOS ANGELES, CA; Owner: KLOS-FM RADIO, INC.)
- K212FA (90.3 FM; TEMPLE CITY, CA; Owner: EDUCATIONAL MEDIA FOUNDATION)
- KOST (103.5 FM; LOS ANGELES, CA; Owner: CAPSTAR TX LIMITED PARTNERSHIP)
- KPWR (105.9 FM; LOS ANGELES, CA; Owner: EMMIS RADIO LICENSE CORPORATION)
- KLSX (97.1 FM; LOS ANGELES, CA; Owner: INFINITY BROADCASTING OPERATIONS, INC.)
- KLVE (107.5 FM; LOS ANGELES, CA; Owner: KLVE-FM LICENSE CORP.)
- KIIS-FM (102.7 FM; LOS ANGELES, CA; Owner: CITICASTERS LICENSES, L.P.)
- KUSC (91.5 FM; LOS ANGELES, CA; Owner: UNIVERSITY OF SOUTHERN CALIFORNIA)
- KPCC (89.3 FM; PASADENA, CA; Owner: PASADENA AREA COMMUNITY COLLEGE DISTRICT)
- KKLA-FM (99.5 FM; LOS ANGELES, CA; Owner: NEW INSPIRATION BROADCASTING CO., INC.)
- KHHT (92.3 FM; LOS ANGELES, CA; Owner: AMFM RADIO LICENSES, L.L.C.)
TV broadcast stations around Dana Point:
- KTRO-LP (Channel 50; LANCASTER, CA; Owner: ROBERT D. ADELMAN)
- National Bridge Inventory (NBI) Statistics
- 27Number of bridges
- 449ft / 137mTotal length
- 1,527,100Total average daily traffic
- 85,345Total average daily truck traffic
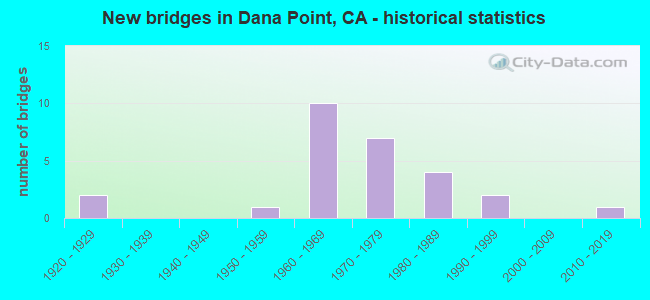
- New bridges - historical statistics
- 21920-1929
- 11950-1959
- 101960-1969
- 71970-1979
- 41980-1989
- 21990-1999
- 12010-2019
FCC Registered Private Land Mobile Towers: 1 (See the full list of FCC Registered Private Land Mobile Towers in Dana Point, CA)
FCC Registered Broadcast Land Mobile Towers: 20 (See the full list of FCC Registered Broadcast Land Mobile Towers)
FCC Registered Microwave Towers: 9 (See the full list of FCC Registered Microwave Towers in this town)
FCC Registered Maritime Coast & Aviation Ground Towers: 8 (See the full list of FCC Registered Maritime Coast & Aviation Ground Towers)
FCC Registered Amateur Radio Licenses: 221 (See the full list of FCC Registered Amateur Radio Licenses in Dana Point)
FAA Registered Aircraft Manufacturers and Dealers: 2 (See the full list of FAA Registered Manufacturers and Dealers in Dana Point)
FAA Registered Aircraft: 31 (See the full list of FAA Registered Aircraft)
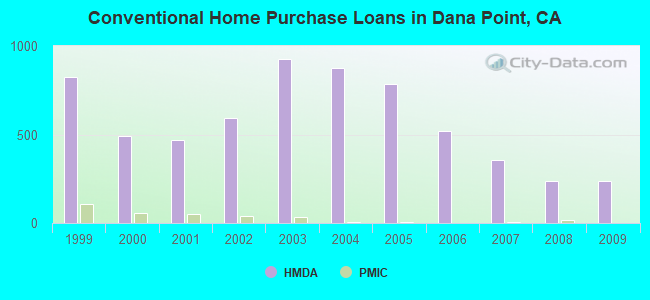
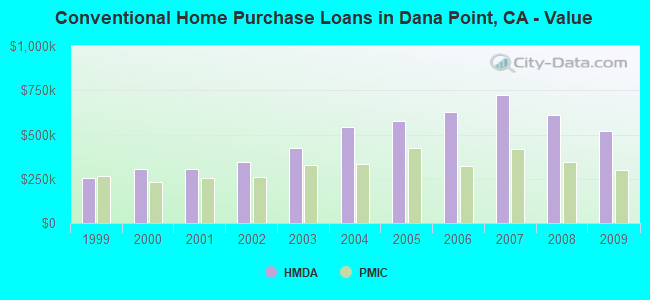
| Home Mortgage Disclosure Act Aggregated Statistics For Year 2009 (Based on 4 full and 6 partial tracts) | ||||||||||||
| A) FHA, FSA/RHS & VA Home Purchase Loans | B) Conventional Home Purchase Loans | C) Refinancings | D) Home Improvement Loans | F) Non-occupant Loans on < 5 Family Dwellings (A B C & D) | G) Loans On Manufactured Home Dwelling (A B C & D) | |||||||
|---|---|---|---|---|---|---|---|---|---|---|---|---|
| Number | Average Value | Number | Average Value | Number | Average Value | Number | Average Value | Number | Average Value | Number | Average Value | |
| LOANS ORIGINATED | 43 | $424,794 | 240 | $517,406 | 990 | $406,001 | 33 | $382,718 | 218 | $463,863 | 1 | $127,470 |
| APPLICATIONS APPROVED, NOT ACCEPTED | 3 | $340,870 | 30 | $556,809 | 128 | $454,072 | 5 | $105,050 | 28 | $671,769 | 1 | $121,570 |
| APPLICATIONS DENIED | 15 | $379,735 | 50 | $670,067 | 340 | $474,806 | 18 | $234,166 | 87 | $487,031 | 1 | $153,010 |
| APPLICATIONS WITHDRAWN | 8 | $413,869 | 49 | $666,971 | 183 | $495,635 | 5 | $318,368 | 39 | $491,999 | 0 | $0 |
| FILES CLOSED FOR INCOMPLETENESS | 4 | $547,750 | 8 | $735,308 | 59 | $446,059 | 2 | $104,765 | 7 | $484,614 | 0 | $0 |
Detailed mortgage data for all 10 tracts in Dana Point, CA
| Private Mortgage Insurance Companies Aggregated Statistics For Year 2009 (Based on 4 full and 4 partial tracts) | ||||||
| A) Conventional Home Purchase Loans | B) Refinancings | C) Non-occupant Loans on < 5 Family Dwellings (A & B) | ||||
|---|---|---|---|---|---|---|
| Number | Average Value | Number | Average Value | Number | Average Value | |
| LOANS ORIGINATED | 2 | $301,965 | 2 | $567,745 | 0 | $0 |
| APPLICATIONS APPROVED, NOT ACCEPTED | 6 | $381,658 | 1 | $249,050 | 1 | $301,000 |
| APPLICATIONS DENIED | 3 | $447,410 | 1 | $387,000 | 0 | $0 |
| APPLICATIONS WITHDRAWN | 1 | $285,770 | 1 | $387,000 | 0 | $0 |
| FILES CLOSED FOR INCOMPLETENESS | 1 | $313,000 | 0 | $0 | 1 | $313,000 |
2005 - 2018 National Fire Incident Reporting System (NFIRS) incidents
- Fire incident types reported to NFIRS in Dana Point, CA
- 22237.4%Structure Fires
- 19332.5%Outside Fires
- 12220.6%Mobile Property/Vehicle Fires
- 569.4%Other
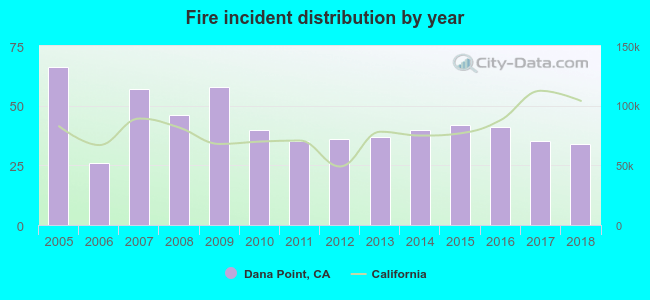 Based on the data from the years 2005 - 2018 the average number of fires per year is 42. The highest number of fire incidents - 66 took place in 2005, and the least - 26 in 2006. The data has a decreasing trend.
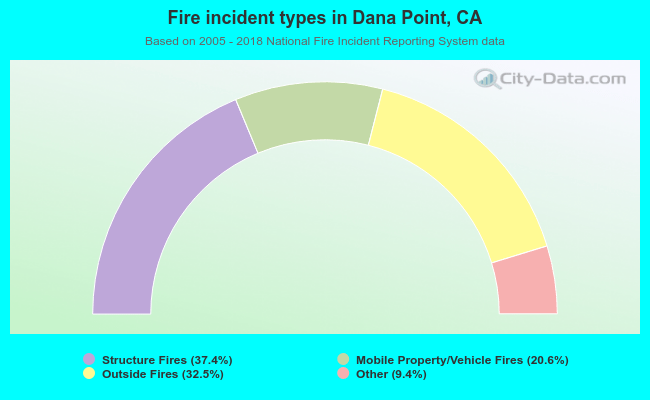 When looking into fire subcategories, the most incidents belonged to: Structure Fires (37.4%), and Outside Fires (32.5%).
Fire-safe hotels and motels in Dana Point, California:
- Doubletree Guest Suites-Doheny Beach, 34402 Pacific Coast Hwy, Dana Point, California 92629 , Phone: (949) 661-1100, Fax: (949) 489-0628
- Best Western Plus Dana Point Inn By The Sea, 34744 Pacific Coast Hwy, Dana Point, California 92624 , Phone: (949) 240-0150, Fax: (949) 240-4862
- Blue Lantern Inn, 34343 Blue Lantern St, Dana Point, California 92629 , Phone: (949) 661-1304, Fax: (949) 496-1483
- Ritz-carlton, 1 Ritz Carlton Dr, Dana Point, California 92629 , Phone: (949) 240-2000, Fax: (949) 496-4335
- Best Western Plus, Marina Shores Hotel, 34280 Pacific Coast Hwy, Dana Point, California 92629 , Phone: (800) 232-3262, Fax: (949) 661-3136
- Dana Point Harbor Inn, 25325 Dana Pt Harbor Dr, Dana Point, California 92629 , Phone: (949) 493-5001, Fax: (949) 661-6895
- St, Regis Monarch Beach Resort, One Monarch Bch Resort, Dana Point, California 92629 , Phone: (949) 234-3200, Fax: (949) 234-3385
- Laguna Cliffs Marriott Resort and Spa, 25135 Park Lantern, Dana point, California 92629 , Phone: (949) 661-5000, Fax: (949) 661-1461
| Most common first names in Dana Point, CA among deceased individuals | ||
| Name | Count | Lived (average) |
|---|---|---|
| John | 110 | 77.6 years |
| Robert | 110 | 71.5 years |
| William | 75 | 77.4 years |
| Mary | 63 | 81.5 years |
| James | 58 | 74.6 years |
| Charles | 42 | 75.4 years |
| Donald | 42 | 72.0 years |
| Dorothy | 41 | 83.9 years |
| Helen | 39 | 81.4 years |
| Joseph | 39 | 76.8 years |
| Most common last names in Dana Point, CA among deceased individuals | ||
| Last name | Count | Lived (average) |
|---|---|---|
| Smith | 25 | 81.8 years |
| Johnson | 17 | 81.6 years |
| Brown | 17 | 78.5 years |
| Miller | 14 | 82.9 years |
| Wilson | 13 | 75.9 years |
| Jones | 11 | 75.3 years |
| Clark | 11 | 75.0 years |
| Anderson | 11 | 82.2 years |
| Williams | 11 | 78.2 years |
| Adams | 10 | 78.6 years |
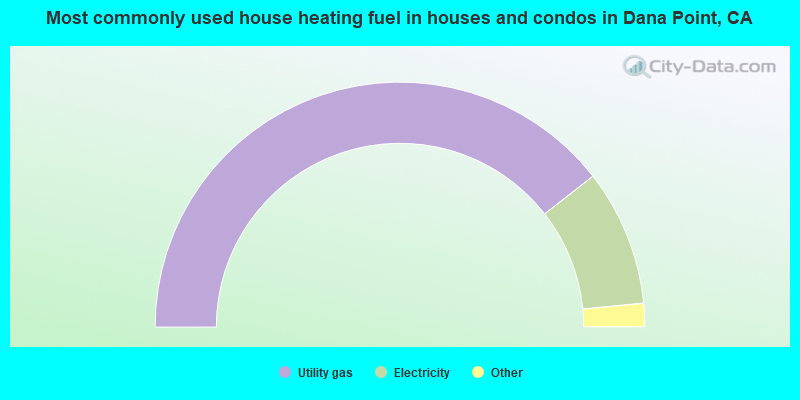
- 78.9%Utility gas
- 18.0%Electricity
- 1.8%Bottled, tank, or LP gas
- 0.6%No fuel used
- 0.5%Solar energy
- 0.1%Other fuel
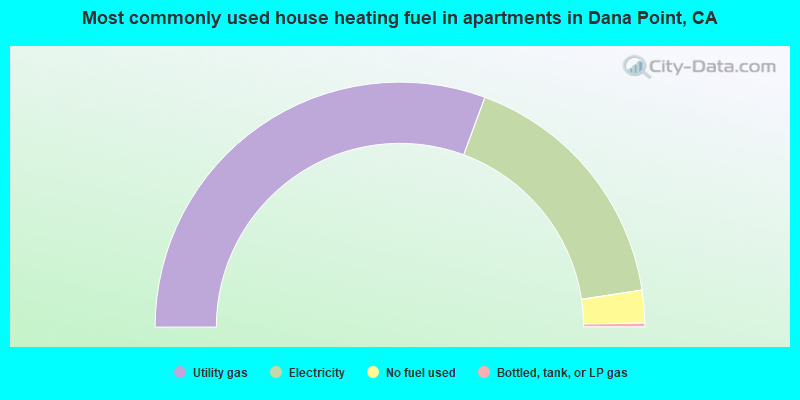
- 61.3%Utility gas
- 33.9%Electricity
- 4.3%No fuel used
- 0.5%Bottled, tank, or LP gas
Dana Point compared to California state average:
- Median house value above state average.
- Unemployed percentage significantly below state average.
- Black race population percentage significantly below state average.
- Hispanic race population percentage below state average.
- Median age significantly above state average.
- Foreign-born population percentage below state average.
- Length of stay since moving in above state average.
- Percentage of population with a bachelor's degree or higher above state average.
Dana Point on our top lists:
- #21 on the list of "Top 101 cities with the highest cost per building permit(population 5,000+)"
- #50 on the list of "Top 101 cities with largest percentage of females in industries: other services, except public administration (population 5,000+)"
- #84 on the list of "Top 100 cities with highest ratio of median house value to median household income (pop. 5,000+)"
- #4 on the list of "Top 101 counties with the highest total withdrawal of fresh water for public supply"
- #5 on the list of "Top 101 counties with the most Catholic adherents"
- #6 on the list of "Top 101 counties with the highest ground withdrawal of fresh water for public supply"
- #7 on the list of "Top 101 counties with the most Evangelical Protestant adherents"
- #8 on the list of "Top 101 counties with the highest Particulate Matter (PM2.5) Annual air pollution readings in 2012 (µg/m3)"

|
|
Total of 946 patent applications in 2008-2024.