Estimated zip code population in 2022: 37,704 Zip code population in 2010: 34,464 Zip code population in 2000: 34,932
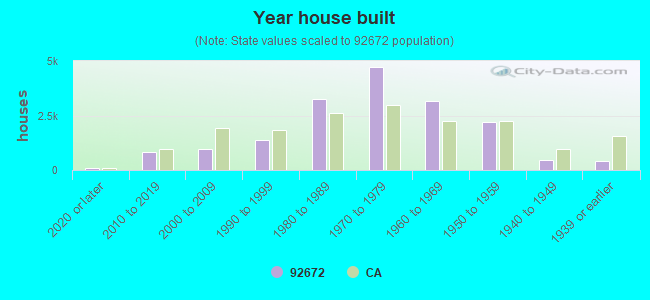
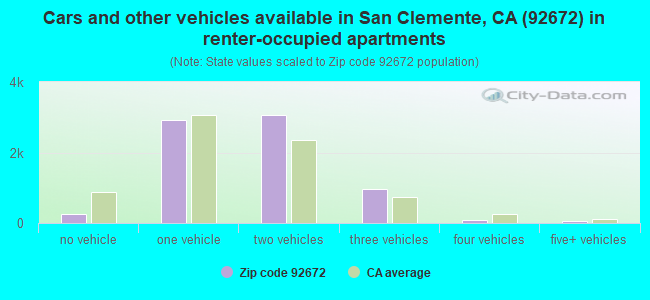
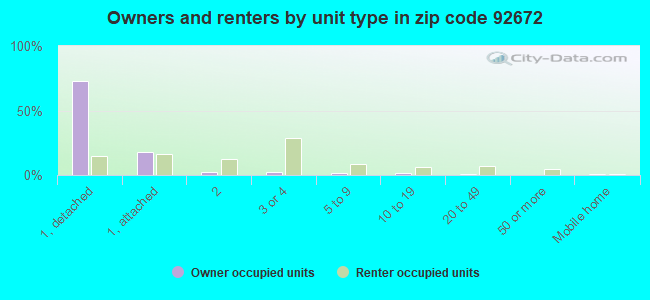
Houses and condos: 17,792 Renter-occupied apartments: 7,382
% of renters here:
49%
State:
44%
March 2022 cost of living index in zip code 92672: 89.7 (less than average, U.S. average is 100)
Land area: 8.0 sq. mi. Water area: 0.9 sq. mi.
Population density: 4,738 people per square mile
(average).
OSM Map
General Map
Google Map
MSN Map
OSM Map
General Map
Google Map
MSN Map
OSM Map
General Map
Google Map
MSN Map
OSM Map
General Map
Google Map
MSN Map
Please wait while loading the map...
Real estate property taxes paid for housing units in 2022:
This zip code:
0.5% ($6,434)
California:
0.7% ($4,831)
Median real estate property taxes paid for housing units with mortgages in 2022: $7,175 (0.6%) Median real estate property taxes paid for housing units with no mortgage in 2022: $4,413 (0.4%)
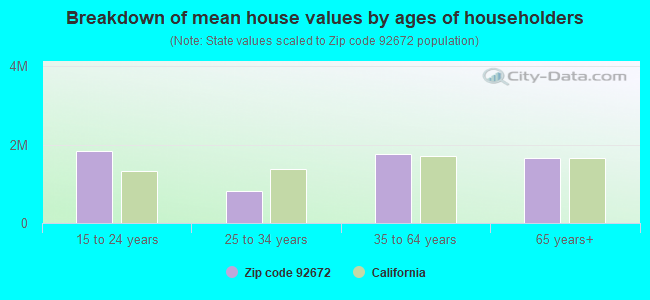
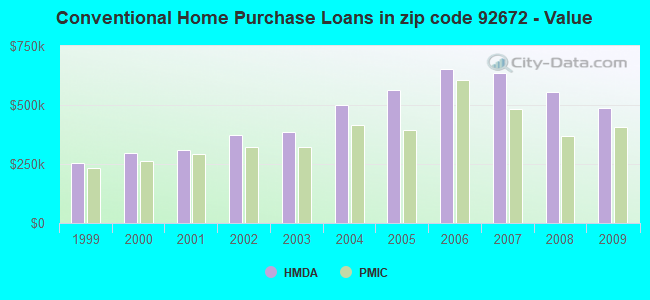
Estimated median house/condo value in 2022: $1,275,003
92672:
$1,275,003
California:
$715,900
According to our research of California and other state lists, there were 17 registered sex offenders living in 92672 zip code as of April 27, 2024. The ratio of all residents to sex offenders in zip code 92672 is 2,065 to 1. The ratio of registered sex offenders to all residents in this zip code is much lower than the state average.
Median resident age:
This zip code:
41.9 years
California median age:
37.9 years
Average household size:
This zip code:
2.4 people
California:
2.8 people
Averages for the 2020 tax year for zip code 92672, filed in 2021:
Average Adjusted Gross Income (AGI) in 2020: $133,254 (Individual Income Tax Returns)
Here:
$133,254
State:
$95,910
Salary/wage: $94,056 (reported on 75.9% of returns)
Here:
$94,056
State:
$77,331
(% of AGI for various income ranges: 1280.3% for AGIs below $25k, 4013.7% for AGIs $25k-50k, 7318.6% for AGIs $50k-75k, 10264.4% for AGIs $75k-100k, 19114.7% for AGIs $100k-200k, 118069.3% for AGIs over 200k)
Taxable interest for individuals: $3,349 (reported on 41.2% of returns)
This zip code:
$3,349
California:
$2,294
(% of AGI for various income ranges: 31.1% for AGIs below $25k, 45.6% for AGIs $25k-50k, 78.2% for AGIs $50k-75k, 124.5% for AGIs $75k-100k, 331.1% for AGIs $100k-200k, 2760.5% for AGIs over 200k)
Ordinary dividends: $10,762 (reported on 30.0% of returns)
Here:
$10,762
State:
$10,949
(% of AGI for various income ranges: 50.4% for AGIs below $25k, 88.3% for AGIs $25k-50k, 236.0% for AGIs $50k-75k, 314.5% for AGIs $75k-100k, 836.6% for AGIs $100k-200k, 6316.1% for AGIs over 200k)
Net capital gain/loss in AGI: +$62,246 (reported on 31.0% of returns)
Here:
+$62,246
State:
+$49,306
(% of AGI for various income ranges: 59.6% for AGIs below $25k, 90.4% for AGIs $25k-50k, 153.8% for AGIs $50k-75k, 286.7% for AGIs $75k-100k, 1193.3% for AGIs $100k-200k, 55870.5% for AGIs over 200k)
Profit/loss from business: +$20,362 (reported on 21.9% of returns)
Here:
+$20,362
State:
+$15,671
(% of AGI for various income ranges: 235.1% for AGIs below $25k, 361.0% for AGIs $25k-50k, 373.0% for AGIs $50k-75k, 656.3% for AGIs $75k-100k, 1160.7% for AGIs $100k-200k, 6425.2% for AGIs over 200k)
Taxable individual retirement arrangement distribution: $29,672 (reported on 10.2% of returns)
92672:
$29,672
California:
$23,505
(% of AGI for various income ranges: 62.4% for AGIs below $25k, 130.4% for AGIs $25k-50k, 285.0% for AGIs $50k-75k, 578.6% for AGIs $75k-100k, 1216.2% for AGIs $100k-200k, 3941.1% for AGIs over 200k)
Self-employed (Keogh) retirement plans: $34,696 (reported on 1.4% of returns)
92672:
$34,696
California:
$30,163
(% of AGI for various income ranges: 10.7% for AGIs $25k-50k, 24.3% for AGIs $75k-100k, 107.5% for AGIs $100k-200k, 1132.6% for AGIs over 200k)
Total itemized deductions: $44,091 (reported on 22.4% of returns)
Here:
$44,091
State:
$39,517
(% of AGI for various income ranges: 208.0% for AGIs below $25k, 335.3% for AGIs $25k-50k, 701.4% for AGIs $50k-75k, 1225.4% for AGIs $75k-100k, 3226.8% for AGIs $100k-200k, 16847.5% for AGIs over 200k)
Charity contributions: $14,607 (reported on 19.7% of returns)
Here:
$14,607
State:
$12,598
(% of AGI for various income ranges: 11.5% for AGIs below $25k, 30.5% for AGIs $25k-50k, 78.9% for AGIs $50k-75k, 159.5% for AGIs $75k-100k, 476.6% for AGIs $100k-200k, 7171.1% for AGIs over 200k)
Taxes paid: $8,859 (reported on 22.4% of returns)
92672:
$8,859
State:
$8,807
(% of AGI for various income ranges: 36.8% for AGIs below $25k, 70.2% for AGIs $25k-50k, 158.2% for AGIs $50k-75k, 328.6% for AGIs $75k-100k, 842.4% for AGIs $100k-200k, 2745.7% for AGIs over 200k)
Earned income credit: $1,868 (reported on 9.7% of returns)
Here:
$1,868
State:
$2,074
(% of AGI for various income ranges: 64.0% for AGIs below $25k, 60.5% for AGIs $25k-50k, 1.1% for AGIs $50k-75k)
Percentage of individuals using paid preparers for their 2020 taxes: 93.4%
Here:
93%
State:
92%
(% for various income ranges: 90.6% for AGIs below $25k, 94.4% for AGIs $25k-50k, 93.8% for AGIs $50k-75k, 93.8% for AGIs $75k-100k, 94.2% for AGIs $100k-200k, 96.0% for AGIs over 200k)
Averages for the 2012 tax year for zip code 92672, filed in 2013:
Average Adjusted Gross Income (AGI) in 2012: $84,373 (Individual Income Tax Returns)
Here:
$84,373
State:
$72,726
Salary/wage: $67,673 (reported on 78.5% of returns)
Here:
$67,673
State:
$59,079
(% of AGI for various income ranges: 73.9% for AGIs below $25k, 76.7% for AGIs $25k-50k, 70.0% for AGIs $50k-75k, 68.0% for AGIs $75k-100k, 66.8% for AGIs $100k-200k, 53.8% for AGIs over 200k)
Taxable interest for individuals: $2,466 (reported on 40.3% of returns)
This zip code:
$2,466
California:
$2,146
(% of AGI for various income ranges: 1.6% for AGIs below $25k, 1.0% for AGIs $25k-50k, 1.3% for AGIs $50k-75k, 1.4% for AGIs $75k-100k, 1.0% for AGIs $100k-200k, 1.2% for AGIs over 200k)
Ordinary dividends: $9,626 (reported on 25.4% of returns)
Here:
$9,626
State:
$9,308
(% of AGI for various income ranges: 2.4% for AGIs below $25k, 1.8% for AGIs $25k-50k, 1.9% for AGIs $50k-75k, 2.2% for AGIs $75k-100k, 2.1% for AGIs $100k-200k, 4.0% for AGIs over 200k)
Net capital gain/loss in AGI: +$19,862 (reported on 23.9% of returns)
Here:
+$19,862
State:
+$30,460
(% of AGI for various income ranges: 0.5% for AGIs $25k-50k, 0.6% for AGIs $50k-75k, 0.8% for AGIs $75k-100k, 1.9% for AGIs $100k-200k, 11.8% for AGIs over 200k)
Profit/loss from business: +$19,803 (reported on 21.5% of returns)
Here:
+$19,803
State:
+$17,064
(% of AGI for various income ranges: 13.3% for AGIs below $25k, 6.9% for AGIs $25k-50k, 5.7% for AGIs $50k-75k, 4.3% for AGIs $75k-100k, 4.9% for AGIs $100k-200k, 3.8% for AGIs over 200k)
Taxable individual retirement arrangement distribution: $22,660 (reported on 11.5% of returns)
92672:
$22,660
California:
$19,557
(% of AGI for various income ranges: 2.9% for AGIs below $25k, 2.6% for AGIs $25k-50k, 3.8% for AGIs $50k-75k, 4.3% for AGIs $75k-100k, 4.0% for AGIs $100k-200k, 2.3% for AGIs over 200k)
Self-employment retirement plans: $23,033 (reported on 1.3% of returns)
92672:
$23,033
California:
$24,530
(% of AGI for various income ranges: 0.2% for AGIs below $25k, 0.3% for AGIs $50k-75k, 0.3% for AGIs $100k-200k, 0.6% for AGIs over 200k)
Total itemized deductions: $38,713 (24% of AGI, reported on 40.2% of returns)
Here:
$38,713
State:
$34,004
Here:
23.9% of AGI
State:
22.7% of AGI
(% of AGI for various income ranges: 15.3% for AGIs below $25k, 13.5% for AGIs $25k-50k, 16.9% for AGIs $50k-75k, 19.6% for AGIs $75k-100k, 22.0% for AGIs $100k-200k, 17.9% for AGIs over 200k)
Charity contributions: $4,917 (reported on 34.2% of returns)
Here:
$4,917
State:
$4,659
(% of AGI for various income ranges: 0.8% for AGIs below $25k, 1.1% for AGIs $25k-50k, 1.7% for AGIs $50k-75k, 1.9% for AGIs $75k-100k, 2.2% for AGIs $100k-200k, 2.3% for AGIs over 200k)
Taxes paid: $15,847 (reported on 40.1% of returns)
92672:
$15,847
State:
$14,448
(% of AGI for various income ranges: 2.8% for AGIs below $25k, 2.8% for AGIs $25k-50k, 4.2% for AGIs $50k-75k, 6.0% for AGIs $75k-100k, 7.9% for AGIs $100k-200k, 10.0% for AGIs over 200k)
Earned income credit: $2,135 (reported on 14.0% of returns)
Here:
$2,135
State:
$2,286
(% of AGI for various income ranges: 4.9% for AGIs below $25k, 1.1% for AGIs $25k-50k)
Percentage of individuals using paid preparers for their 2012 taxes: 64.1%
Here:
64%
State:
64%
(% for various income ranges: 57.4% for AGIs below $25k, 58.9% for AGIs $25k-50k, 65.2% for AGIs $50k-75k, 67.9% for AGIs $75k-100k, 74.8% for AGIs $100k-200k, 82.4% for AGIs over 200k)
Averages for the 2004 tax year for zip code 92672, filed in 2005:
Average Adjusted Gross Income (AGI) in 2004: $70,361 (Individual Income Tax Returns)
Here:
$70,361
State:
$58,600
Salary/wage: $57,547 (reported on 77.4% of returns)
Here:
$57,547
State:
$49,455
(% of AGI for various income ranges: 75.3% for AGIs $10k-25k, 76.5% for AGIs $25k-50k, 70.5% for AGIs $50k-75k, 66.6% for AGIs $75k-100k, 55.8% for AGIs over 100k)
Taxable interest for individuals: $2,959 (reported on 50.5% of returns)
This zip code:
$2,959
California:
$2,365
(% of AGI for various income ranges: 2.5% for AGIs $10k-25k, 1.8% for AGIs $25k-50k, 1.8% for AGIs $50k-75k, 2.1% for AGIs $75k-100k, 2.0% for AGIs over 100k)
Taxable dividends: $4,840 (reported on 31.1% of returns)
Here:
$4,840
State:
$4,746
(% of AGI for various income ranges: 2.2% for AGIs $10k-25k, 1.7% for AGIs $25k-50k, 1.8% for AGIs $50k-75k, 2.2% for AGIs $75k-100k, 2.1% for AGIs over 100k)
Net capital gain/loss: +$22,447 (reported on 29.3% of returns)
Here:
+$22,447
State:
+$23,418
(% of AGI for various income ranges: -0.3% for AGIs $10k-25k, 1.1% for AGIs $25k-50k, 1.2% for AGIs $50k-75k, 2.6% for AGIs $75k-100k, 14.3% for AGIs over 100k)
Profit/loss from business: +$19,809 (reported on 21.4% of returns)
Here:
+$19,809
State:
+$16,826
(% of AGI for various income ranges: 10.7% for AGIs $10k-25k, 7.5% for AGIs $25k-50k, 6.8% for AGIs $50k-75k, 7.6% for AGIs $75k-100k, 4.8% for AGIs over 100k)
IRA payment deduction: $3,378 (reported on 3.5% of returns)
92672:
$3,378
California:
$3,192
(% of AGI for various income ranges: 0.2% for AGIs $10k-25k, 0.3% for AGIs $25k-50k, 0.3% for AGIs $50k-75k, 0.2% for AGIs $75k-100k, 0.1% for AGIs over 100k)
Self-employed pension: $16,797 (reported on 2.2% of returns)
Here:
$16,797
California:
$17,688
(% of AGI for various income ranges: 0.1% for AGIs $10k-25k, 0.1% for AGIs $25k-50k, 0.4% for AGIs $50k-75k, 0.7% for AGIs $75k-100k, 0.6% for AGIs over 100k)
Total itemized deductions: $32,792 (25% of AGI, reported on 42.1% of returns)
Here:
$32,792
State:
$28,113
Here:
24.6% of AGI
State:
25.3% of AGI
(% of AGI for various income ranges: 16.4% for AGIs $10k-25k, 15.8% for AGIs $25k-50k, 20.7% for AGIs $50k-75k, 24.5% for AGIs $75k-100k, 19.0% for AGIs over 100k)
Charity contributions deductions: $4,532 (3% of AGI, reported on 37.9% of returns)
Here:
$4,532
State:
$3,923
Here:
3.2% of AGI
State:
3.3% of AGI
(% of AGI for various income ranges: 1.3% for AGIs $10k-25k, 1.7% for AGIs $25k-50k, 2.3% for AGIs $50k-75k, 2.8% for AGIs $75k-100k, 2.6% for AGIs over 100k)
Total tax: $13,901 (reported on 78.2% of returns)
92672:
$13,901
State:
$10,761
(% of AGI for various income ranges: 5.1% for AGIs $10k-25k, 7.6% for AGIs $25k-50k, 9.9% for AGIs $50k-75k, 10.8% for AGIs $75k-100k, 19.4% for AGIs over 100k)
Earned income credit: $1,548 (reported on 11.3% of returns)
Here:
$1,548
State:
$1,763
Percentage of individuals using paid preparers for their 2004 taxes: 65.3%
Here:
65%
State:
66%
(% for various income ranges: 58.4% for AGIs below $10k, 61.7% for AGIs $10k-25k, 60.3% for AGIs $25k-50k, 65.2% for AGIs $50k-75k, 73.4% for AGIs $75k-100k, 80.0% for AGIs over 100k)
Likely homosexual households (counted as self-reported same-sex unmarried-partner households)
Lesbian couples: 0.2% of all households
Gay men: 0.0% of all households
Household received Food Stamps/SNAP in the past 12 months: 800 Household did not receive Food Stamps/SNAP in the past 12 months: 14,160
Women who had a birth in the past 12 months: 574 (454 now married, 119 unmarried) Women who did not have a birth in the past 12 months: 7,001 (3,593 now married, 3,373 unmarried)
Housing units in zip code 92672 with a mortgage: 5,456 (809 second mortgage, 10 home equity loan, 786 both second mortgage and home equity loan) Houses without a mortgage: 173
Median monthly owner costs for units with a mortgage: $3,405 Median monthly owner costs for units without a mortgage: $807
Residents with income below the poverty level in 2022:
This zip code:
7.7%
Whole state:
12.2%
Residents with income below 50% of the poverty level in 2022:
This zip code:
2.5%
Whole state:
6.2%
Median number of rooms in houses and condos:
Here:
6.0
State:
6.0
Median number of rooms in apartments:
Here:
4.1
State:
3.9
Notable locations in this zip code not listed on our city pages
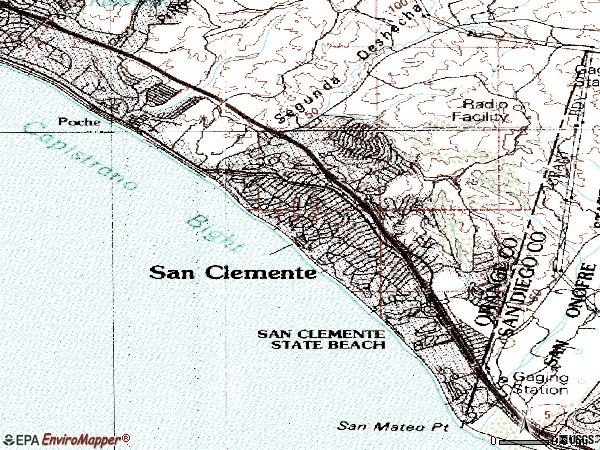
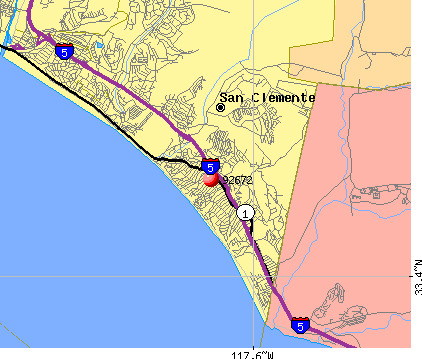
Notable locations in zip code 92672: San Clemente Pier (A), Shorecliffs Country Club (B), San Clemente Golf Course (C), San Clemente Branch Orange County Public Library (D), Camp Pendleton Fire Department Station 28 (E), Orange County Fire Authority Station 60 (F). Display/hide their locations on the map
Churches in zip code 92672 include: Our Lady of Fatima Catholic Church (A), Our Saviors Lutheran Church (B), Saint Michaels Episcopal Church (C). Display/hide their locations on the map
Parks in zip code 92672 include: Bonita Canyon Park (1), Linda Lane Park (2), San Clemente State Beach (3), San Luis Rey Park (4), Mira Costa Park (5), San Gorgonio Park (6), Calafia Beach County Park (7), Leslie Park (8), Parque Del Mar (9). Display/hide their locations on the map
5,068 married couples with children.
1,287 single-parent households (387 men, 900 women).
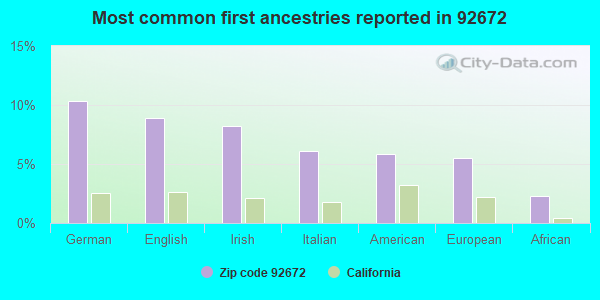
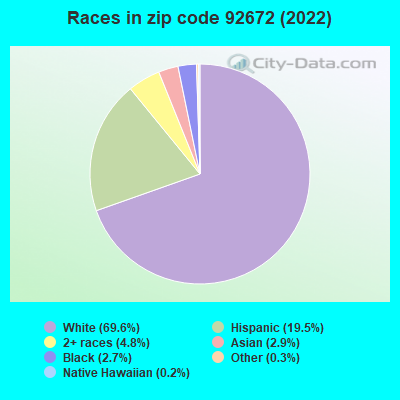
84.7% of residents of 92672 zip code speak English at home.
10.1% of residents speak Spanish at home (58% very well, 14% well, 20% not well, 8% not at all).
2.4% of residents speak other Indo-European language at home (84% very well, 10% well, 6% not well).
1.7% of residents speak Asian or Pacific Island language at home (67% very well, 19% well, 13% not well, 2% not at all).
0.9% of residents speak other language at home (88% very well, 8% well, 4% not well).
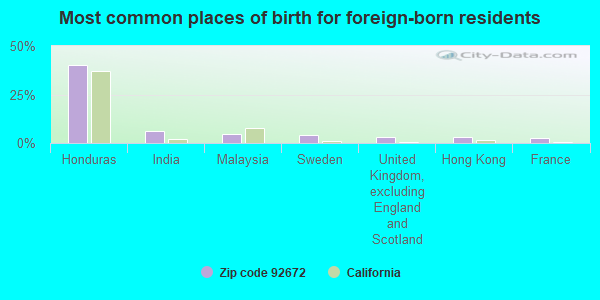
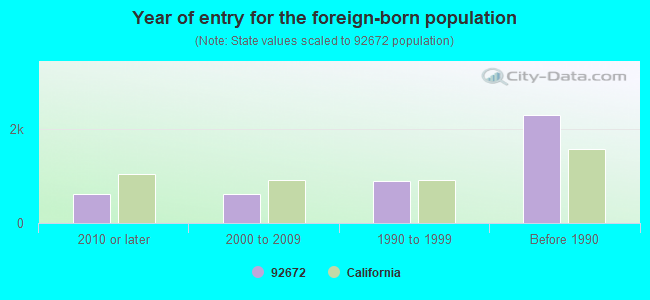
Foreign born population: 3,942 (10.5%) (63.5% of them are naturalized citizens)
Major facilities with environmental interests located in this zip code:
FRANK'S COACHWERKS AUTOBODY (2101 S EL CAMINO REAL in SAN CLEMENTE, CA)
STATE MASTER (California - Hazardous Waste Tracking) - HAZARDOU WASTE PROGRAM Small Quantity Generators, between 100 kg and 1000 kg of hazardous waste/month (Resource Conservation and Recovery Act (tracking hazardous waste)) - notification Business NAICS classification: GENERAL AUTOMOTIVE REPAIR. Organizations: MABEL ANA SANCHEZ (CONTACT/OWNER)
Alternative names: FRANK'S AUTO COLLISION
FRANKS FOREIGN CAR SVC (509 S EL CAMINO REAL in SAN CLEMENTE, CA)
STATE MASTER (California - Hazardous Waste Tracking) - HAZARDOU WASTE PROGRAM Small Quantity Generators, between 100 kg and 1000 kg of hazardous waste/month (Resource Conservation and Recovery Act (tracking hazardous waste)) - notification
LUCKYS CLEANERS (622 CAMINO DE LOS MARES in SAN CLEMENTE, CA)
STATE MASTER (California - Hazardous Waste Tracking) - HAZARDOU WASTE PROGRAM Small Quantity Generators, between 100 kg and 1000 kg of hazardous waste/month (Resource Conservation and Recovery Act (tracking hazardous waste)) - notification Organizations: PARK YOUNG (CONTACT/OWNER)
EZ LUBE INC #35 (525 AVENIDA PICO in SAN CLEMENTE, CA)
Small Quantity Generators, between 100 kg and 1000 kg of hazardous waste/month (Resource Conservation and Recovery Act (tracking hazardous waste)) - notification STATE MASTER (California - Used Oil Recycling System ) - USED OIL RECYCLING Organizations: CHEVRON USA PRODUCTS CO (CONTACT/OWNER)
Alternative names: CHEVRON STATION 98151
CHEVRON STATION NO 99944 (515 E AVENIDA PICO in SAN CLEMENTE, CA)
STATE MASTER (California - Hazardous Waste Tracking) - HAZARDOU WASTE PROGRAM Small Quantity Generators, between 100 kg and 1000 kg of hazardous waste/month (Resource Conservation and Recovery Act (tracking hazardous waste)) - notification Organizations: CHEVRON PRODUCTS CO (CONTACT/OWNER)
CELEBRITY CLEANERS (638 CAMINO DE LOS MARES in SAN CLEMENTE, CA)
STATE MASTER (California - Hazardous Waste Tracking) - HAZARDOU WASTE PROGRAM Small Quantity Generators, between 100 kg and 1000 kg of hazardous waste/month (Resource Conservation and Recovery Act (tracking hazardous waste)) - notification Organizations: SEONG IN YOO (CONTACT/OWNER)
HANSON (OLE) ELEMENTARY (189 LA CUESTA in SAN CLEMENTE, CA)
(National Center for Education Statistics) - STATE ID-6027619 Organizations: CAPISTRANO UNIFIED (SCHOOL DISTRICT)
JOURNEY (189 AVENIDA LA CUESTA in SAN CLEMENTE, CA)
(National Center for Education Statistics) - STATE ID-6117758 Organizations: CAPISTRANO UNIFIED (SCHOOL DISTRICT)
LAS PALMAS ELEMENTARY (1101 CALLE PUENTE in SAN CLEMENTE, CA)
(National Center for Education Statistics) - STATE ID-6027601 Organizations: CAPISTRANO UNIFIED (SCHOOL DISTRICT)
LOBO (CLARENCE) ELEMENTARY (200 AVENIDA VISTA MONTANA in SAN CLEMENTE, CA)
(National Center for Education Statistics) - STATE ID-6111819 Organizations: CAPISTRANO UNIFIED (SCHOOL DISTRICT)
LYMAN,S READY MIXED CONCRETE (116 RINCON CT in SAN CLEMENTE, CA)
CAPO VALLEY JEEP EAGLE (1212 S EL CAMINO REAL in SAN CLEMENTE, CA)
(Resource Conservation and Recovery Act (tracking hazardous waste)) Organizations: CAPO MOTORS INC (CONTACT/OWNER)
, MICHAEL KURDJIAN (CONTACT/OWNER)
GRANT PLAZA CLEANERS (410 CAMINO DE ESTRELLA in SAN CLEMENTE, CA)
(Resource Conservation and Recovery Act (tracking hazardous waste)) Organizations: JAY YOONCHOI (CONTACT/OWNER)
Housing units lacking complete plumbing facilities: 0.2% Housing units lacking complete kitchen facilities: 1.5%
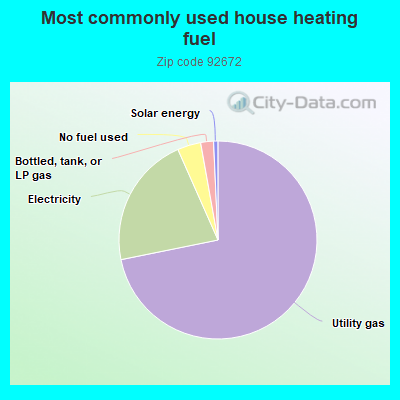
71.6%Utility gas
21.5%Electricity
3.8%No fuel used
2.1%Bottled, tank, or LP gas
0.7%Solar energy
Population in 1990: 46,719.
Place of birth for U.S.-born residents:
This state: 19,908
Northeast: 2,646
Midwest: 3,671
South: 4,120
West: 2,489
48% of the 92672 zip code residents lived in the same house 5 years ago. Out of people who lived in different houses, 65% lived in this county. Out of people who lived in different counties, 50% lived in California.
86% of the 92672 zip code residents lived in the same house 1 year ago. Out of people who lived in different houses, 55% moved from this county. Out of people who lived in different houses, 16% moved from different county within same state. Out of people who lived in different houses, 18% moved from different state. Out of people who lived in different houses, 11% moved from abroad.
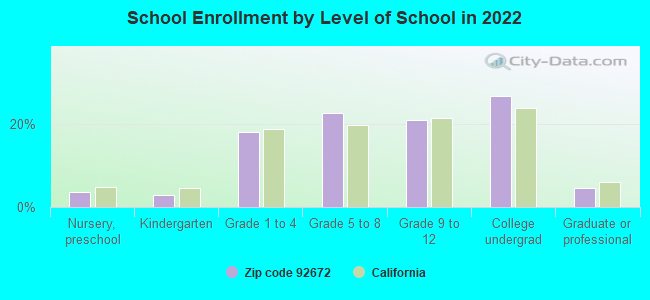
Private vs. public school enrollment:
Students in private schools in grades 1 to 8 (elementary and middle school): 381
Here:
12.3%
California:
10.5%
Students in private schools in grades 9 to 12 (high school): 177
Here:
11.2%
California:
8.5%
Students in private undergraduate colleges: 184
Here:
9.1%
California:
15.9%
Occupation by median earnings in the past 12 months ($)
149,397Architecture and engineering occupations
125,476Law enforcement workers including supervisors
118,066Computer and mathematical occupations
111,902Management occupations
102,959Health diagnosing and treating practitioners and other technical occupations
93,065Business and financial operations occupations
Companies with biggest federal contracts located in this zip code (SAN CLEMENTE, CA):
MARKET SYSTEMS UNLIMITED (605 CALLE DEL CERRITO; small business) : $792,557 in 29 contractsfrom 2000 to 2006
Contracts for Wrapping and Packaging Machinery, Refrigeration Equipment, Signs, Advertising Displays, and Identification Plates, Cabinets, Lockers, Bins, and Shelving, and moreby Defense Commissary Agency, Department of Defense Signed by year:2000: $139,914; 2001: $109,761; 2002: $32,329; 2003: $28,524; 2004: $193,175; 2005: $261,629; 2006: $27,225.
Biggest contracts:
$176,364 with Defense Commissary Agency for Wrapping and Packaging Machinery. Signed on 2005-01-11. Completion date: 2005-08-28.
$88,490, same as above.Signed on 2004-10-21. Completion date: 2005-01-20.
$69,690 with Department of Defense for Refrigeration Equipment. Signed on 2001-09-30. Completion date: 2001-09-30.
$66,463 with Defense Commissary Agency for Wrapping and Packaging Machinery. Signed on 2005-08-08. Completion date: 2005-10-15.
GREEN HILLS SOFTWARE INC (131 AVENIDA VICTORIA; small business) : $487,860 in 11 contractsfrom 2001 to 2006
Contracts for ADP Software, Technical Assistance, Miscellaneous Defense Hard Goods -- Basic Research (R&D), Guided Missile Components, and moreby Air Force, Navy Signed by year:2000: $0; 2001: $67,699; 2002: $71,467; 2003: $0; 2004: $219,502; 2005: $38,763; 2006: $90,429.
Biggest contracts:
$161,160 with Air Force for ADP Software. Signed on 2004-11-30. Completion date: 2004-12-22.
$75,264 with Air Force for Technical Assistance. Signed on 2006-02-28. Completion date: 2007-02-27.
$67,699 with Navy for Miscellaneous Defense Hard Goods -- Basic Research (R&D). Signed on 2001-11-05. Completion date: 2002-05-04.
$42,660 with Navy for Guided Missile Components. Signed on 2002-03-28. Completion date: 2002-05-15.
ABSOLUTE IMAGES INSTRUMENT SPE (63 VIA PICO PLAZE STE 136; small business) : $346,341 in 92 contractsfrom 2004 to 2005
Contracts for Maintenance, Repair and Rebuilding of Equipment -- Instruments and Laboratory Equipment, Maintenance, Repair and Rebuilding of Equipment -- Medical, Dental, and Veterinary Equipment and Supplies, Medical and Surgical Instruments, Equipment, and Supplies, Maintenance, Repair and Rebuilding of Equipment -- Alarm, Signal, and Security Detection Systems by Navy Signed by year:2000: $0; 2001: $0; 2002: $0; 2003: $0; 2004: $89,732; 2005: $256,609; 2006: $0.
Biggest contracts:
$193,008 with Navy for Maintenance, Repair and Rebuilding of Equipment -- Instruments and Laboratory Equipment. Signed on 2005-03-07. Completion date: 2006-03-28.
$27,260 with Navy for Maintenance, Repair and Rebuilding of Equipment -- Medical, Dental, and Veterinary Equipment and Supplies. Signed on 2005-06-27. Completion date: 2005-09-30.
$27,260, same as above.Signed on 2004-09-30. Completion date: 2005-09-30.
$6,536, same as above.Signed on 2004-11-24. Completion date: 2004-11-17.
CELERGY NETWORKS, INC (201 AVENIDA FABRICANTE STE; small business) : $68,550 in 3 contractsfrom 2003 to 2005
$41,500 with Navy for Intercommunication and Public Address Systems, Airborne. Signed on 2005-09-21. Completion date: 2005-10-20.
$27,050 with Federal Technology Service for Other ADP and Telecommunications Services (includes data storage on tapes, compact disks, etc.). Signed on 2003-11-13. Completion date: 2004-01-31.
$0, same as above.Signed on 2005-08-17. Completion date: 2004-01-31.
CORROSION & COATING SOLUTIONS, (227 CALLE PINTORESCO; small business)
$40,000 with Navy for Maintenance, Repair and Rebuilding of Equipment -- Containers, Packaging, and Packing Supplies. Signed on 2005-06-17. Completion date: 2006-06-16.
ROBERT FISCHER PLUMBING INC (111 AVE SIERRA; small business)
$40,000 with Navy for Facilities Operations Support Services. Signed on 2004-07-07. Completion date: 2004-09-30.
TECH LINX (108 E AVE; small business) 6 employees, $4800000 revenue. Veteran Owned Business
$40,000 with Department of Veterans Affairs for ADP Central Processing Unit (CPU, Computer), Digital. Signed on 2001-09-15. Completion date: 2001-11-15.
AMERICAS TOP PERFORMERS (110 VIA TOLUCA; small business) : $15,925 in 5 contractsfrom 2004 to 2006
Contracts for Other Education and Training Services, Training Aids, Lectures For Training, Educational Services, and moreby Army, Air Force Signed by year:2000: $0; 2001: $0; 2002: $0; 2003: $0; 2004: $6,800; 2005: $3,275; 2006: $5,850.
Biggest contracts:
$3,500 with Army for Other Education and Training Services. Signed on 2004-04-23. Completion date: 2004-04-24.
$3,300 with Army for Training Aids. Taking place in PA. Signed on 2004-02-10. Completion date: 2004-03-13.
$3,275 with Army for Lectures For Training. Taking place in TN. Signed on 2005-07-29. Completion date: 2005-08-20.
$3,200 with Air Force for Educational Services. Taking place in FL. Signed on 2006-04-05. Completion date: 2006-04-14.
PAPPAS DISTRIBUTION INTERNATIO (605 EL CIRCULO; small business) : $14,631 in 4 contractsin 2003
$7,560 with U.S. Army Corps of Engineers - civil program financing only for Video Recording and Reproducing Equipment. Taking place in IL. Signed on 2003-05-07. Completion date: 2003-04-21.
$3,360 with U.S. Army Corps of Engineers - civil program financing only for Telephone and Telegraph Equipment. Signed on 2003-09-12. Completion date: 2003-09-30.
$3,145 with U.S. Army Corps of Engineers - civil program financing only for Video Recording and Reproducing Equipment. Signed on 2003-05-29. Completion date: 2003-05-23.
$566 with U.S. Army Corps of Engineers - civil program financing only for Telephone and Telegraph Equipment. Signed on 2003-09-24. Completion date: 2003-09-30.
RINCON TRUCK CENTER, INC (114 RINCON CT; small business) : $9,758 in 2 contractsin 2003
$9,758 with Navy for Motor Vehicle Maintenance and Repair Shop Specialized Equipment. Signed on 2003-05-12. Completion date: 2003-04-24.
$0, same as above.Signed on 2003-05-12. Completion date: 2003-04-24.
Top industries in this zip code by the number of employees in 2005:
Utilities: Nuclear Electric Power Generation (over 1000 employees: 1 establishment)


 Nearest zip codes: 92673, 92624, 92675, 92629, 92694, 92677.