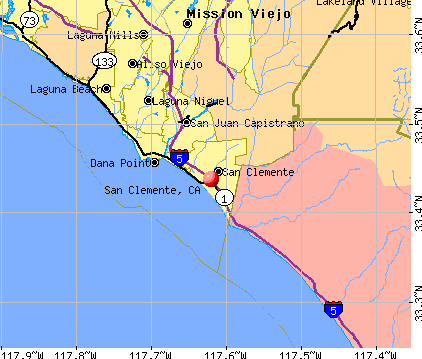
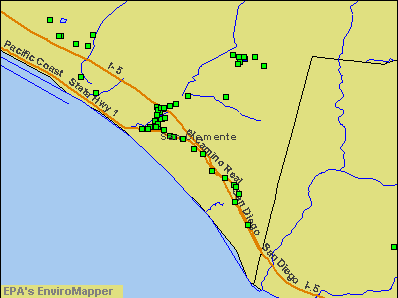
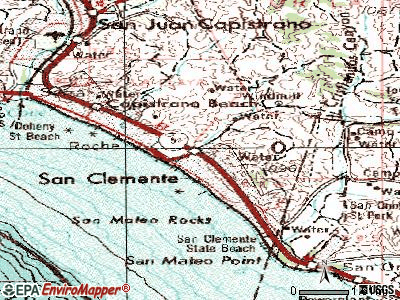
San Clemente, California
San Clemente: T-Street
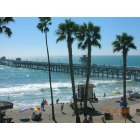
San Clemente: At Pico beach in San Clemente, Ca.
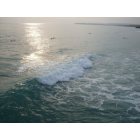
San Clemente: Riding Waves
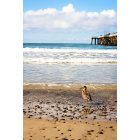
San Clemente: Seagull by the pier
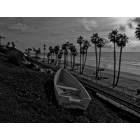
San Clemente: Beachcomber
San Clemente: the pier at san clemente
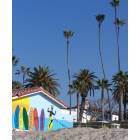
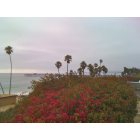
San Clemente: Palm Trees - San Clemente
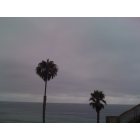
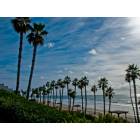
San Clemente: Palms - San Clemente
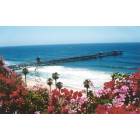
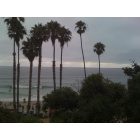
San Clemente: San Clemente Above the Beach
San Clemente
San Clemente: San Clemente Beach
- see
24
more - add
your
Submit your own pictures of this city and show them to the world
- OSM Map
- General Map
- Google Map
- MSN Map
Population change since 2000: +27.1%
| Males: 32,481 | |
| Females: 30,976 |
| Median resident age: | 45.1 years |
| California median age: | 37.9 years |
Zip codes: 92673.
| San Clemente: | $130,847 |
| CA: | $91,551 |
Estimated per capita income in 2022: $70,476 (it was $34,169 in 2000)
San Clemente city income, earnings, and wages data
Estimated median house or condo value in 2022: over $1,000,000 (it was $364,800 in 2000)
| San Clemente: | over $1,000,000 |
| CA: | $715,900 |
Mean prices in 2022: all housing units: over $1,000,000; detached houses: over $1,000,000; townhouses or other attached units: $988,689; in 2-unit structures: over $1,000,000; in 3-to-4-unit structures: over $1,000,000; in 5-or-more-unit structures: $831,519; mobile homes: $667,481
Median gross rent in 2022: $2,292.
(5.1% for White Non-Hispanic residents, 15.0% for Black residents, 5.7% for Hispanic or Latino residents, 4.9% for American Indian residents, 5.9% for Native Hawaiian and other Pacific Islander residents, 12.9% for other race residents, 4.3% for two or more races residents)
Detailed information about poverty and poor residents in San Clemente, CA


Compare current foreclosures near San Clemente, CA:
| Photo | Address | Area | Beds / Baths | Price | Details |
|---|---|---|---|---|---|

|
#1
E Marquita
San Clemente, CA 92672
|
1,443 sq. feet
|
3 baths 3 beds |
show details | |

|
#2
W Canada
San Clemente, CA 92672
|
1,202 sq. feet
|
2 baths 2 beds |
show details | |

|
#3
Calle Del Juego
San Clemente, CA 92672
|
2,285 sq. feet
|
2 baths 4 beds |
show details | |

|
#4
Calle Vallarta
San Clemente, CA 92673
|
2,987 sq. feet
|
3 baths 4 beds |
show details | |

|
#5
Paseo Halcon
San Clemente, CA 92672
|
1,606 sq. feet
|
2 baths 2 beds |
show details | |

|
#6
Avenida Adobe
San Clemente, CA 92672
|
1,027 sq. feet
|
2 baths 2 beds |
show details | |

|
#7
Puerto Caravaca
San Clemente, CA 92672
|
1,363 sq. feet
|
1 baths - beds |
show details | |

|
#8
Vista Jardin
San Clemente, CA 92673
|
- sq. feet
|
- baths 5 beds |
show details | |

|
#9
Avenida Pelayo Apt A
San Clemente, CA 92672
|
- sq. feet
|
- baths - beds |
show details | |

|
#10
E Escalones Apt A
San Clemente, CA 92672
|
- sq. feet
|
- baths - beds |
show details |
| Photo | Address | Area | Beds / Baths | Price | Details |
|---|---|---|---|---|---|

|
#11
S El Camino Real
San Clemente, CA 92672
|
3,251 sq. feet
|
- baths - beds |
show details | |

|
#12
Calle Camisa
San Clemente, CA 92673
|
- sq. feet
|
- baths - beds |
show details | |

|
#13
Finca
San Clemente, CA 92672
|
1,192 sq. feet
|
- baths - beds |
show details | |

|
#14
W Escalones Apt B
San Clemente, CA 92672
|
- sq. feet
|
- baths - beds |
show details | |

|
#15
Calle Campana Apt 1
San Clemente, CA 92673
|
- sq. feet
|
- baths - beds |
show details | |

|
#16
Avenida Dolores
San Clemente, CA 92672
|
- sq. feet
|
- baths - beds |
show details | |

|
#17
Avenida La Pata
San Clemente, CA 92673
|
- sq. feet
|
- baths - beds |
show details | |

|
#18
Via Vistosa
San Clemente, CA 92672
|
- sq. feet
|
- baths - beds |
show details | |

|
#19
Vista Jardin
San Clemente, CA 92673
|
- sq. feet
|
- baths 5 beds |
show details | |

|
#20
Via Mariposa E Unit C
Laguna Hills, CA 92637
|
1,325 sq. feet
|
2 baths 2 beds |
$409,000
|
show details |
| Photo | Address | Area | Beds / Baths | Price | Details |
|---|---|---|---|---|---|

|
#21
Costero Risco
San Clemente, CA 92673
|
- sq. feet
|
- baths - beds |
show details | |

|
#22
Via Vina
San Clemente, CA 92673
|
- sq. feet
|
- baths - beds |
show details | |

|
#23
Tobago
Laguna Niguel, CA 92677
|
1,605 sq. feet
|
3 baths 3 beds |
show details | |

|
#24
Carmel Dr
Lake Forest, CA 92630
|
1,549 sq. feet
|
2 baths 3 beds |
show details | |

|
#25
Zancon
Mission Viejo, CA 92692
|
1,123 sq. feet
|
2 baths 3 beds |
show details | |

|
#26
Silver Lantern St
Dana Point, CA 92629
|
3,066 sq. feet
|
4 baths 3 beds |
show details | |

|
#27
Shady Ln
Laguna Beach, CA 92651
|
995 sq. feet
|
2 baths 3 beds |
show details | |

|
#28
Via Joaquin
Rancho Santa Margarita, CA 92688
|
1,100 sq. feet
|
2 baths 3 beds |
show details | |

|
#29
Daybreak Ln
Rancho Santa Margarita, CA 92688
|
1,420 sq. feet
|
2 baths 3 beds |
show details | |

|
#30
Black Hawk
Irvine, CA 92603
|
4,887 sq. feet
|
4 baths 4 beds |
show details |
| Photo | Address | Area | Beds / Baths | Price | Details |
|---|---|---|---|---|---|

|
#31
Glocamora Ln
San Juan Capistrano, CA 92675
|
4,337 sq. feet
|
3 baths 3 beds |
show details | |

|
#32
Hidden Trail Rd
Laguna Hills, CA 92653
|
5,762 sq. feet
|
4 baths 5 beds |
show details | |

|
#33
32981 N. Peak Dr.
Trabuco Canyon, CA 92679
|
2,647 sq. feet
|
2 baths 4 beds |
show details | |

|
#34
Zancon
Mission Viejo, CA 92692
|
1,123 sq. feet
|
2 baths 3 beds |
show details | |

|
#35
Via Estella
Mission Viejo, CA 92691
|
1,883 sq. feet
|
3 baths 4 beds |
show details | |

|
#36
Los Adornos
Aliso Viejo, CA 92656
|
1,236 sq. feet
|
2 baths 3 beds |
show details | |

|
#37
Lope De Vega Dr
Mission Viejo, CA 92691
|
1,554 sq. feet
|
2 baths 3 beds |
show details | |

|
#38
Twig St
Lake Forest, CA 92630
|
2,077 sq. feet
|
3 baths 5 beds |
show details | |

|
#39
Via Del Sur
Mission Viejo, CA 92691
|
1,369 sq. feet
|
2 baths 2 beds |
show details | |

|
#40
Via Del Sur
Mission Viejo, CA 92691
|
1,369 sq. feet
|
2 baths 2 beds |
show details |
| Photo | Address | Area | Beds / Baths | Price | Details |
|---|---|---|---|---|---|

|
#41
Medici
Aliso Viejo, CA 92656
|
1,904 sq. feet
|
2 baths 3 beds |
show details | |

|
#42
Fargo Rd
Laguna Hills, CA 92653
|
6,596 sq. feet
|
5 baths 4 beds |
show details | |

|
#43
Verena Ct
Mission Viejo, CA 92691
|
1,987 sq. feet
|
3 baths 3 beds |
show details | |

|
#44
Camberwell St
Laguna Hills, CA 92653
|
2,786 sq. feet
|
3 baths 4 beds |
show details | |

|
#45
Ash Ln
Mission Viejo, CA 92691
|
2,107 sq. feet
|
3 baths 4 beds |
show details | |

|
#46
Fargo Rd
Laguna Hills, CA 92653
|
6,596 sq. feet
|
5 baths 4 beds |
show details | |

|
#47
Blascos # 113
Mission Viejo, CA 92691
|
1,506 sq. feet
|
2 baths 2 beds |
show details | |

|
#48
Poplar St
Laguna Beach, CA 92651
|
546 sq. feet
|
2 baths 1 beds |
show details | |

|
#49
Via Granados
Mission Viejo, CA 92692
|
1,209 sq. feet
|
1 baths 2 beds |
show details | |

|
Check over 1 million property listings on Foreclosure.com!
|
browse all offers | |||


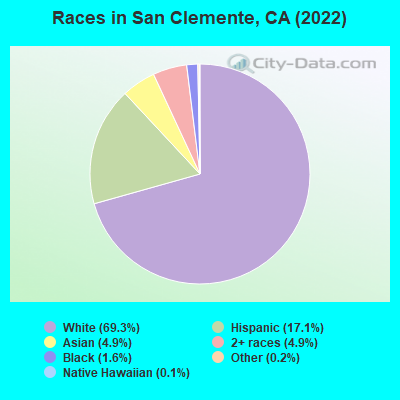
- 44,18869.3%White alone
- 10,91117.1%Hispanic
- 3,1234.9%Asian alone
- 3,1214.9%Two or more races
- 9901.6%Black alone
- 1450.2%Other race alone
- 670.1%Native Hawaiian and Other
Pacific Islander alone - 310.05%American Indian alone
According to our research of California and other state lists, there were 21 registered sex offenders living in San Clemente, California as of April 27, 2024.
The ratio of all residents to sex offenders in San Clemente is 3,139 to 1.
The ratio of registered sex offenders to all residents in this city is much lower than the state average.
The City-Data.com crime index weighs serious crimes and violent crimes more heavily. Higher means more crime, U.S. average is 246.1. It adjusts for the number of visitors and daily workers commuting into cities.
- means the value is smaller than the state average.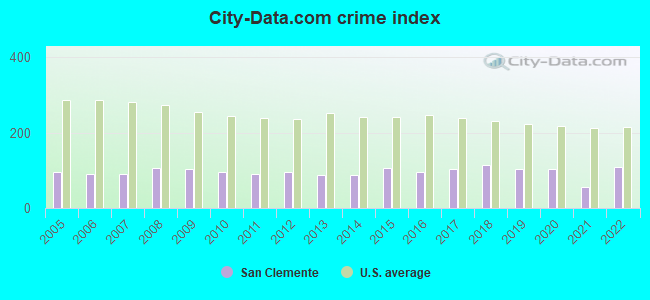
Crime rate in San Clemente detailed stats: murders, rapes, robberies, assaults, burglaries, thefts, arson
Full-time law enforcement employees in 2015, including police officers: 1 (1 officers - 1 male; 0 female).
| Officers per 1,000 residents here: | 0.02 |
| California average: | 1.98 |
 Recent articles from our blog. Our writers, many of them Ph.D. graduates or candidates, create easy-to-read articles on a wide variety of topics.


Latest news from San Clemente, CA collected exclusively by city-data.com from local newspapers, TV, and radio stations
San Clemente, CA City Guides:
Ancestries: English (13.4%), German (8.8%), Irish (6.6%), European (5.8%), American (5.3%), Italian (4.8%).
Current Local Time: PST time zone
Elevation: 160 feet
Land area: 17.6 square miles.
Population density: 3,601 people per square mile (average).
7,363 residents are foreign born (4.4% Latin America, 3.5% Asia, 2.3% Europe).
| This city: | 11.6% |
| California: | 26.5% |
Median real estate property taxes paid for housing units with mortgages in 2022: $8,246 (0.6%)
Median real estate property taxes paid for housing units with no mortgage in 2022: $5,228 (0.4%)
Nearest city with pop. 50,000+: South Coast, CA (7.2 miles  , pop. 288,147).
Nearest city with pop. 1,000,000+: San Diego, CA (53.2 miles , pop. 1,223,400).
Nearest cities:
), ), ), Latitude: 33.44 N, Longitude: 117.62 W
Daytime population change due to commuting: -4,612 (-7.2%)
Workers who live and work in this city: 14,366 (46.7%)
San Clemente tourist attractions:
San Clemente, California accommodation & food services, waste management - Economy and Business Data
Single-family new house construction building permits:
- 2022: 35 buildings, average cost: $227,900
- 2021: 35 buildings, average cost: $412,300
- 2020: 20 buildings, average cost: $330,000
- 2019: 43 buildings, average cost: $505,400
- 2018: 97 buildings, average cost: $533,600
- 2017: 82 buildings, average cost: $524,400
- 2016: 101 buildings, average cost: $522,600
- 2015: 117 buildings, average cost: $551,700
- 2014: 64 buildings, average cost: $535,100
- 2013: 10 buildings, average cost: $553,800
- 2012: 10 buildings, average cost: $413,800
- 2011: 13 buildings, average cost: $615,800
- 2010: 45 buildings, average cost: $475,200
- 2009: 33 buildings, average cost: $472,600
- 2008: 38 buildings, average cost: $385,700
- 2007: 149 buildings, average cost: $437,600
- 2006: 292 buildings, average cost: $361,800
- 2005: 386 buildings, average cost: $332,400
- 2004: 488 buildings, average cost: $339,100
- 2003: 665 buildings, average cost: $268,900
- 2002: 567 buildings, average cost: $285,100
- 2001: 719 buildings, average cost: $275,300
- 2000: 970 buildings, average cost: $275,900
- 1999: 451 buildings, average cost: $271,600
- 1998: 195 buildings, average cost: $261,500
- 1997: 125 buildings, average cost: $279,800
| Here: | 3.6% |
| California: | 5.1% |
Population change in the 1990s: +8,663 (+21.0%).
- Professional, scientific, technical services (8.9%)
- Construction (8.4%)
- Educational services (8.0%)
- Health care (6.8%)
- Accommodation & food services (6.4%)
- Administrative & support & waste management services (5.1%)
- Finance & insurance (4.8%)
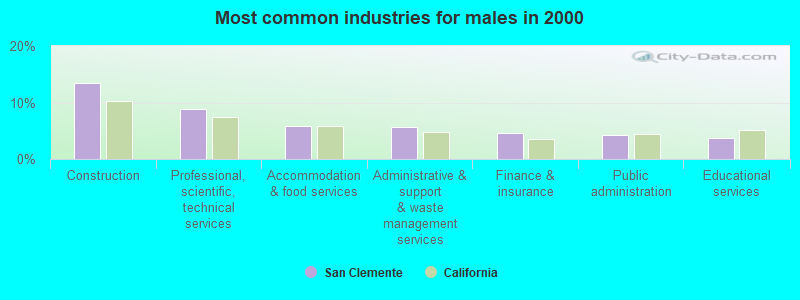
- Construction (13.4%)
- Professional, scientific, technical services (8.9%)
- Accommodation & food services (5.8%)
- Administrative & support & waste management services (5.6%)
- Finance & insurance (4.5%)
- Public administration (4.3%)
- Educational services (3.8%)
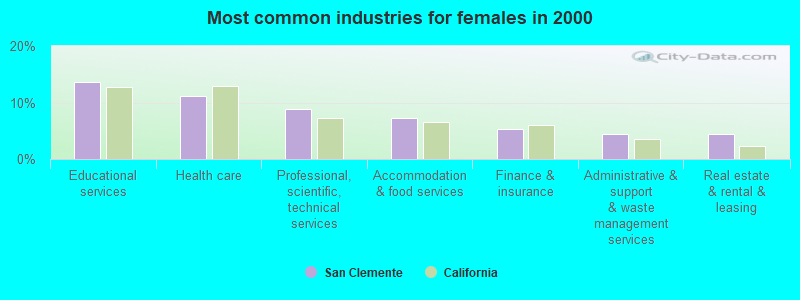
- Educational services (13.6%)
- Health care (11.2%)
- Professional, scientific, technical services (8.9%)
- Accommodation & food services (7.3%)
- Finance & insurance (5.2%)
- Administrative & support & waste management services (4.4%)
- Real estate & rental & leasing (4.4%)
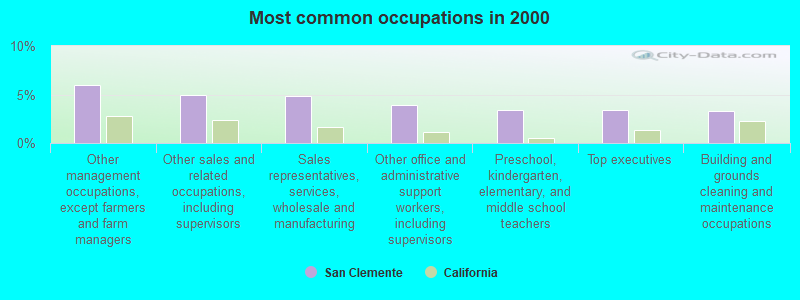
- Other management occupations, except farmers and farm managers (5.9%)
- Other sales and related occupations, including supervisors (4.9%)
- Sales representatives, services, wholesale and manufacturing (4.8%)
- Other office and administrative support workers, including supervisors (3.9%)
- Preschool, kindergarten, elementary, and middle school teachers (3.4%)
- Top executives (3.4%)
- Building and grounds cleaning and maintenance occupations (3.3%)
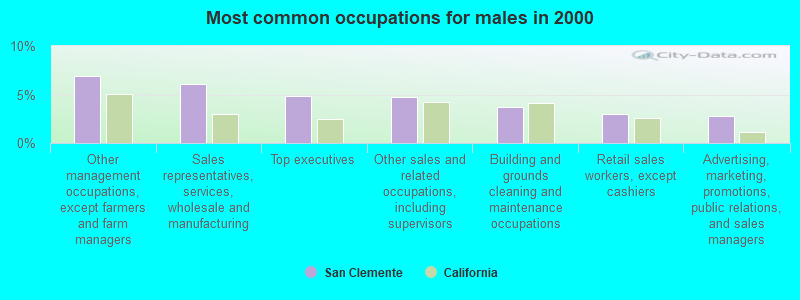
- Other management occupations, except farmers and farm managers (6.9%)
- Sales representatives, services, wholesale and manufacturing (6.1%)
- Top executives (4.9%)
- Other sales and related occupations, including supervisors (4.7%)
- Building and grounds cleaning and maintenance occupations (3.7%)
- Retail sales workers, except cashiers (3.0%)
- Advertising, marketing, promotions, public relations, and sales managers (2.8%)
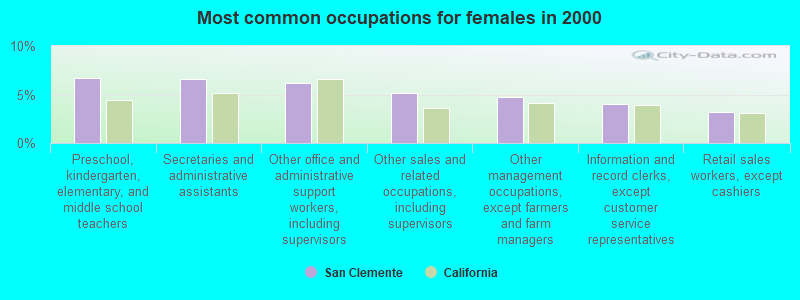
- Preschool, kindergarten, elementary, and middle school teachers (6.7%)
- Secretaries and administrative assistants (6.6%)
- Other office and administrative support workers, including supervisors (6.2%)
- Other sales and related occupations, including supervisors (5.2%)
- Other management occupations, except farmers and farm managers (4.7%)
- Information and record clerks, except customer service representatives (4.1%)
- Retail sales workers, except cashiers (3.2%)
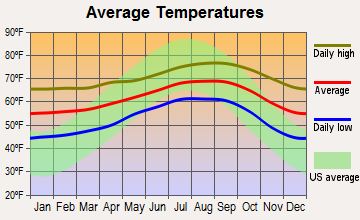
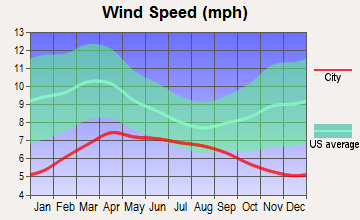
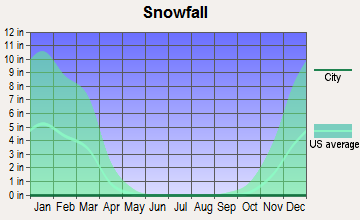
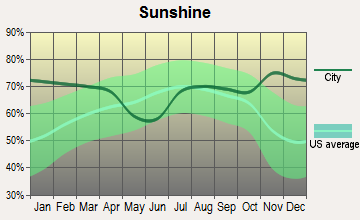
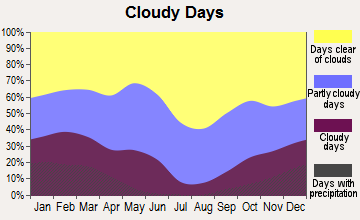
Average climate in San Clemente, California
Based on data reported by over 4,000 weather stations
|
|

(lower is better)
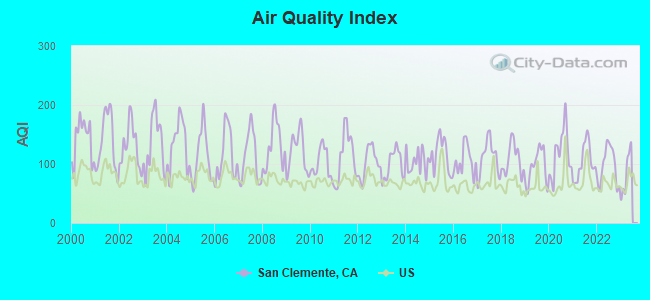
Air Quality Index (AQI) level in 2022 was 96.7. This is worse than average.
| City: | 96.7 |
| U.S.: | 72.6 |
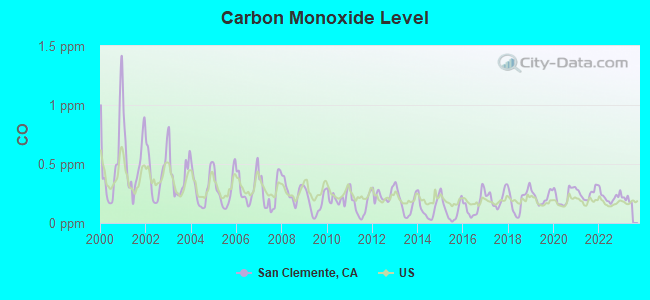
Carbon Monoxide (CO) [ppm] level in 2022 was 0.222. This is about average. Closest monitor was 11.9 miles away from the city center.
| City: | 0.222 |
| U.S.: | 0.251 |
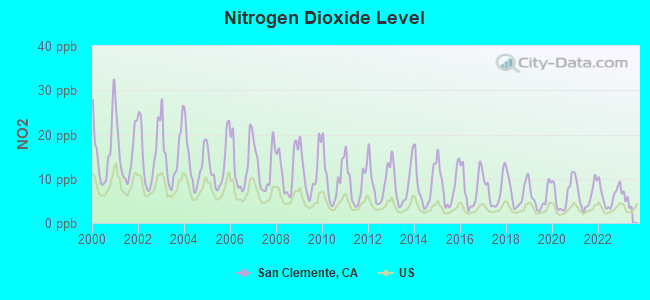
Nitrogen Dioxide (NO2) [ppb] level in 2022 was 6.19. This is worse than average. Closest monitor was 13.7 miles away from the city center.
| City: | 6.19 |
| U.S.: | 5.11 |
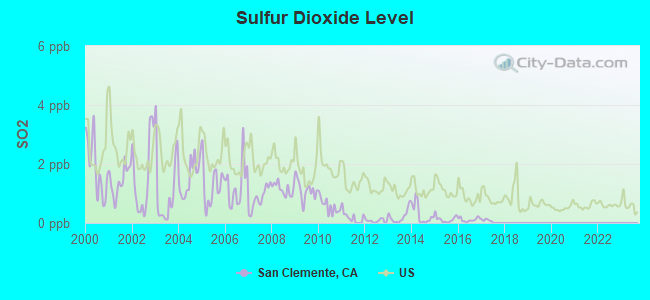
Sulfur Dioxide (SO2) [ppb] level in 2016 was 0.113. This is significantly better than average. Closest monitor was 13.7 miles away from the city center.
| City: | 0.113 |
| U.S.: | 1.515 |
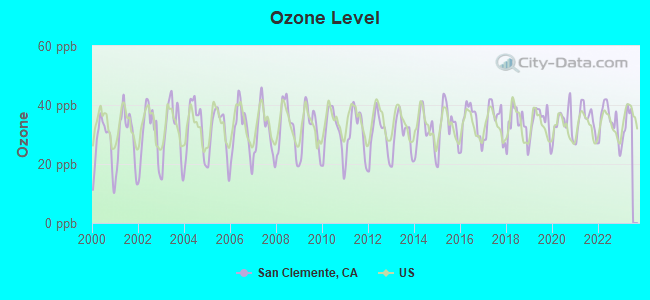
Ozone [ppb] level in 2022 was 34.6. This is about average. Closest monitor was 13.7 miles away from the city center.
| City: | 34.6 |
| U.S.: | 33.3 |
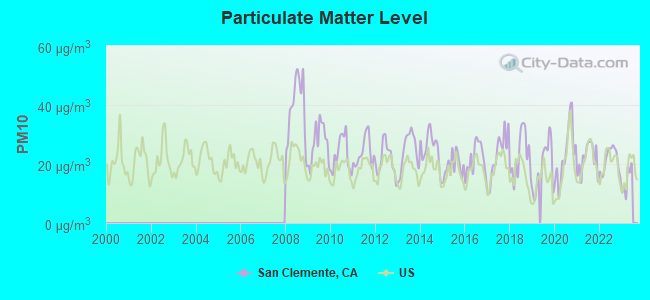
Particulate Matter (PM10) [µg/m3] level in 2022 was 21.1. This is about average. Closest monitor was 13.7 miles away from the city center.
| City: | 21.1 |
| U.S.: | 19.2 |
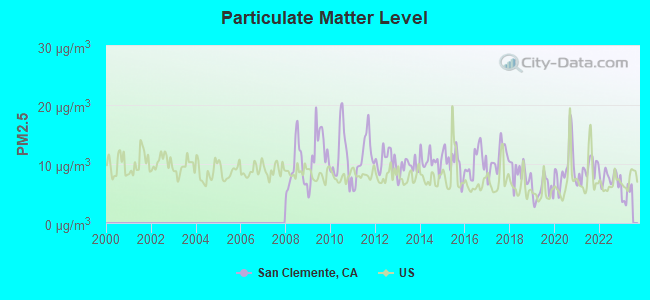
Particulate Matter (PM2.5) [µg/m3] level in 2022 was 7.64. This is about average. Closest monitor was 13.7 miles away from the city center.
| City: | 7.64 |
| U.S.: | 8.11 |
Earthquake activity:
San Clemente-area historical earthquake activity is significantly above California state average. It is 6551% greater than the overall U.S. average.On 6/28/1992 at 11:57:34, a magnitude 7.6 (6.2 MB, 7.6 MS, 7.3 MW, Depth: 0.7 mi, Class: Major, Intensity: VIII - XII) earthquake occurred 81.1 miles away from the city center, causing 3 deaths (1 shaking deaths, 2 other deaths) and 400 injuries, causing $100,000,000 total damage and $40,000,000 insured losses
On 7/21/1952 at 11:52:14, a magnitude 7.7 (7.7 UK) earthquake occurred 133.8 miles away from the city center, causing $50,000,000 total damage
On 10/16/1999 at 09:46:44, a magnitude 7.4 (6.3 MB, 7.4 MS, 7.2 MW, 7.3 ML) earthquake occurred 100.9 miles away from the city center
On 5/19/1940 at 04:36:40, a magnitude 7.2 (7.2 UK) earthquake occurred 112.2 miles away from the city center, causing $33,000,000 total damage
On 4/21/1918 at 22:32:30, a magnitude 6.8 (6.8 UK, Class: Strong, Intensity: VII - IX) earthquake occurred 27.9 miles away from the city center
On 12/31/1934 at 18:45:56, a magnitude 7.1 (7.1 UK) earthquake occurred 119.7 miles away from the city center
Magnitude types: body-wave magnitude (MB), local magnitude (ML), surface-wave magnitude (MS), moment magnitude (MW)
Natural disasters:
The number of natural disasters in Orange County (32) is a lot greater than the US average (15).Major Disasters (Presidential) Declared: 22
Emergencies Declared: 2
Causes of natural disasters: Floods: 15, Fires: 13, Storms: 9, Landslides: 6, Winter Storms: 6, Mudslides: 5, Earthquakes: 2, Heavy Rain: 1, Hurricane: 1, Snow: 1, Tornado: 1, Wind: 1, Other: 1 (Note: some incidents may be assigned to more than one category).
Main business address for: Pacific Coast National Bancorp (NATIONAL COMMERCIAL BANKS), Sunstone Hotel Investors, Inc. (HOTELS & MOTELS), ICU MEDICAL INC/DE (SURGICAL & MEDICAL INSTRUMENTS & APPARATUS), BIOLASE TECHNOLOGY INC (DENTAL EQUIPMENT & SUPPLIES).
Hospitals and medical centers in San Clemente:
Heliports located in San Clemente:
Nuclear power plants:
- San Onofre 1. Pressurized Water Reactor (PWR). Net Output: 436 MWe. Permanently shutdown. Date started: 01/1968. Date closed : 11/1992..
- San Onofre 2. General Electric Co.Bechtel Corp.Combustion Engineering. Inc.Southern California Edison Co. and San Diego Gas & Electric Co.Pressurized Water Reactor (PWR). Net Output: 1070 MWe. Operable. Initial criticality: 07/1982. Commercial start: 08/1983..
- San Onofre 3. General Electric Co.Bechtel Corp.Combustion Engineering. Inc.Southern California Edison Co. and San Diego Gas & Electric Co.Pressurized Water Reactor (PWR). Net Output: 1080 MWe. Operable. Initial criticality: 08/1983. Commercial start: 04/1984..
Colleges/universities with over 2000 students nearest to San Clemente:
- Saddleback College (about 9 miles; Mission Viejo, CA; Full-time enrollment: 13,716)
- Brandman University (about 18 miles; Irvine, CA; FT enrollment: 6,027)
- Coastline Community College (about 19 miles; Fountain Valley, CA; FT enrollment: 4,591)
- Concordia University-Irvine (about 19 miles; Irvine, CA; FT enrollment: 3,284)
- Irvine Valley College (about 19 miles; Irvine, CA; FT enrollment: 8,005)
- University of California-Irvine (about 20 miles; Irvine, CA; FT enrollment: 28,587)
- Vanguard University of Southern California (about 23 miles; Costa Mesa, CA; FT enrollment: 2,104)
Public high school in San Clemente:
- SAN CLEMENTE HIGH (Students: 2,170, Location: 700 AVENIDO PICO, Grades: 9-12)
Private high school in San Clemente:
Biggest public elementary/middle schools in San Clemente:
- SHORECLIFFS MIDDLE (Students: 973, Location: 240 VIA SOCORRO, Grades: 6-8)
- BERNICE AYER MIDDLE (Students: 742, Location: 1271 SARMENTOSO, Grades: 6-8)
- VISTA DEL MAR ELEMENTARY (Students: 656, Location: 1130 AVE. TALEGA, Grades: KG-5)
- TRUMAN BENEDICT ELEMENTARY (Students: 575, Location: 1251 SARMENTOSO, Grades: KG-5)
- VISTA DEL MAR MIDDLE (Students: 486, Location: 1130 AVE. TALEGA, Grades: 6-8)
- CONCORDIA ELEMENTARY (Students: 419, Location: 3120 AVENIDA DEL PRESIDENTE, Grades: KG-5)
- LAS PALMAS ELEMENTARY (Students: 404, Location: 1101 CALLE PUENTE, Grades: KG-5)
- MARBLEHEAD ELEMENTARY (Students: 391, Location: 2410 VIA TURQUEZA, Grades: KG-5)
- SAN ONOFRE ELEMENTARY (Students: 388, Location: 200 PATE RD., Grades: KG-8)
- CLARENCE LOBO ELEMENTARY (Students: 308, Location: 200 AVENIDA VISTA MONTANA, Grades: KG-5)
Private elementary/middle schools in San Clemente:
User-submitted facts and corrections:
- Add to churches: The Church of Jesus Christ of Latter-Day Saints, 2 locations: 310 Avenida Vista Montana and 470 Camino San Clemente
- Taylor Harrison, current Divison 1 college basketball player at University of California-Berkeley, was born and raised in San Clemente.
- Home of 16 Pro skateboarder, Ryan Sheckler!
Points of interest:
Notable locations in San Clemente: Rancho San Clemente Business Park (A), Pacific Golf Club (B), Shorecliffs Country Club (C), San Clemente Golf Course (D), Ole Hanson Beach Club (E), San Clemente Branch Orange County Public Library (F), Orange County Fire Authority Station 50 (G), Orange County Fire Authority Station 59 (H), Orange County Fire Authority Station 60 (I). Display/hide their locations on the map
Shopping Centers: Pico Plaza Shopping Center (1), El Camino Plaza Shopping Center (2), Ocean View Plaza Shopping Center (3). Display/hide their locations on the map
Main business address in San Clemente include: Sunstone Hotel Investors, Inc. (A), ICU MEDICAL INC/DE (B), BIOLASE TECHNOLOGY INC (C). Display/hide their locations on the map
Churches in San Clemente include: Our Lady of Fatima Catholic Church (A), Our Saviors Lutheran Church (B), Saint Michaels Episcopal Church (C). Display/hide their locations on the map
Reservoir: Palisades Reservoir (A). Display/hide its location on the map
Parks in San Clemente include: Bonita Canyon Park (1), Linda Lane Park (2), San Clemente State Beach (3), San Luis Rey Park (4), Mira Costa Park (5), San Gorgonio Park (6), Calafia Beach County Park (7), Leslie Park (8), Parque Del Mar (9). Display/hide their locations on the map
Beach: San Clemente City Beach (A). Display/hide its location on the map
Tourist attraction: A Destiny Travel (Recreational Trips & Guides; 810 Calle Pluma).
Hotels: Beachcomber Motel (533 Avenida Victoria), Algodon Motel (135 Avenida Algodon), Best Western Casablanca Inn (1601 North El Camino Real), Budget Lodge (2002 South El Camino Real), Brisa de San Clemente LLC (711 South El Camino Real).
Birthplace of: Melissa Schuman - Musician, Olivia Burnette - Film actor, Ryan Sheckler - Film actor, Aaron Michael Metchik - Actor, Sue Enquist - Softball player, Cole Bergquist - And football player, Jennie Elizabeth Eisenhower - Stage, Kelly Crean - Actor, Todd Follmer - College basketball player (UC Santa Barbara Gauchos), Tyler Smith - College basketball player (San Diego State Aztecs).
| This city: | 2.6 people |
| California: | 2.9 people |
| This city: | 70.1% |
| Whole state: | 68.7% |
| This city: | 5.7% |
| Whole state: | 7.2% |
Likely homosexual households (counted as self-reported same-sex unmarried-partner households)
- Lesbian couples: 0.3% of all households
- Gay men: 0.3% of all households
People in group quarters in San Clemente in 2010:
- 133 people in group homes intended for adults
- 58 people in other noninstitutional facilities
- 33 people in residential treatment centers for adults
- 23 people in local jails and other municipal confinement facilities
- 15 people in emergency and transitional shelters (with sleeping facilities) for people experiencing homelessness
- 6 people in workers' group living quarters and job corps centers
- 5 people in group homes for juveniles (non-correctional)
People in group quarters in San Clemente in 2000:
- 156 people in other noninstitutional group quarters
- 70 people in homes or halfway houses for drug/alcohol abuse
- 62 people in nursing homes
- 3 people in religious group quarters
Banks with most branches in San Clemente (2011 data):
- Wells Fargo Bank, National Association: Oceanview Plaza Branch, San Clemente Branch, Talega Village Branch. Info updated 2011/04/05: Bank assets: $1,161,490.0 mil, Deposits: $905,653.0 mil, headquarters in Sioux Falls, SD, positive income, 6395 total offices, Holding Company: Wells Fargo & Company
- JPMorgan Chase Bank, National Association: Avenida Pico Albertsons Banking Cent, San Clemente North Branch, San Clemento Branch. Info updated 2011/11/10: Bank assets: $1,811,678.0 mil, Deposits: $1,190,738.0 mil, headquarters in Columbus, OH, positive income, International Specialization, 5577 total offices, Holding Company: Jpmorgan Chase & Co.
- Bank of America, National Association: Talega Branch at 965 Avenida Pico, branch established on 2004/12/20; San Clemente Banking Center at 300 S. El Camino Real, Suite 100, branch established on 1934/12/24. Info updated 2009/11/18: Bank assets: $1,451,969.3 mil, Deposits: $1,077,176.8 mil, headquarters in Charlotte, NC, positive income, 5782 total offices, Holding Company: Bank Of America Corporation
- Union Bank, National Association: San Clemente Branch at 810 Avenida Pico, branch established on 1969/03/14; San Clemente Hills Instore Branch at 638 Camino De Los Mares Ste B, branch established on 1993/04/15. Info updated 2011/09/01: Bank assets: $88,967.5 mil, Deposits: $65,286.4 mil, headquarters in San Francisco, CA, positive income, Commercial Lending Specialization, 403 total offices, Holding Company: Mitsubishi Ufj Financial Group, Inc.
- U.S. Bank National Association: San Clemente Albertsons Branch at 989 Avenida Pico, branch established on 2002/03/05; San Clemente Branch at 1051 Avenida Pico, branch established on 2004/06/07. Info updated 2012/01/30: Bank assets: $330,470.8 mil, Deposits: $236,091.5 mil, headquarters in Cincinnati, OH, positive income, 3121 total offices, Holding Company: U.S. Bancorp
- California Bank & Trust: San Clemente Branch at 115 Via Pico Plaza, branch established on 1982/10/06. Info updated 2009/07/20: Bank assets: $10,894.1 mil, Deposits: $9,193.9 mil, headquarters in San Diego, CA, positive income, Commercial Lending Specialization, 109 total offices, Holding Company: Zions Bancorporation
- Citibank, National Association: 570 Camino De Estrella Branch at 570 Camino De Estrella, branch established on 1945/01/01. Info updated 2012/01/10: Bank assets: $1,288,658.0 mil, Deposits: $882,541.0 mil, headquarters in Sioux Falls, SD, positive income, International Specialization, 1048 total offices, Holding Company: Citigroup Inc.
- Bank of the West: San Clemente Branch at 641 Camino De Los Mares, branch established on 1997/10/14. Info updated 2009/11/16: Bank assets: $62,408.3 mil, Deposits: $43,995.2 mil, headquarters in San Francisco, CA, positive income, 647 total offices, Holding Company: Bnp Paribas
- Farmers and Merchants Bank of Long Beach: San Clemente Branch at 501 N El Camino Real, branch established on 2006/06/07. Info updated 2006/11/03: Bank assets: $4,659.3 mil, Deposits: $3,393.5 mil, headquarters in Long Beach, CA, positive income, Commercial Lending Specialization, 22 total offices, Holding Company: Palomar Enterprises, Llc
For population 15 years and over in San Clemente:
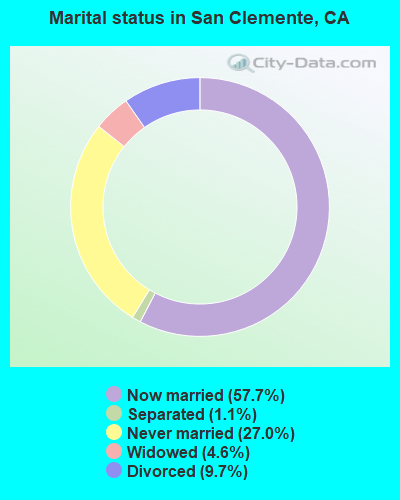
- Never married: 27.0%
- Now married: 57.7%
- Separated: 1.1%
- Widowed: 4.6%
- Divorced: 9.7%
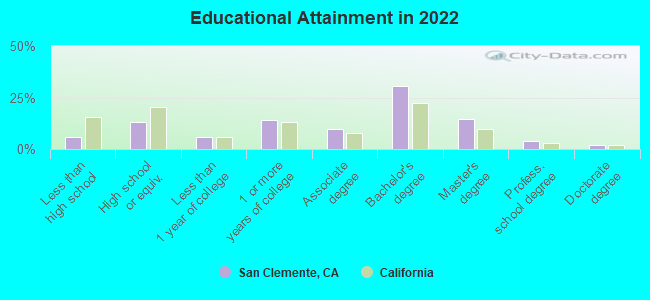
For population 25 years and over in San Clemente:
- High school or higher: 94.2%
- Bachelor's degree or higher: 50.0%
- Graduate or professional degree: 19.9%
- Unemployed: 3.7%
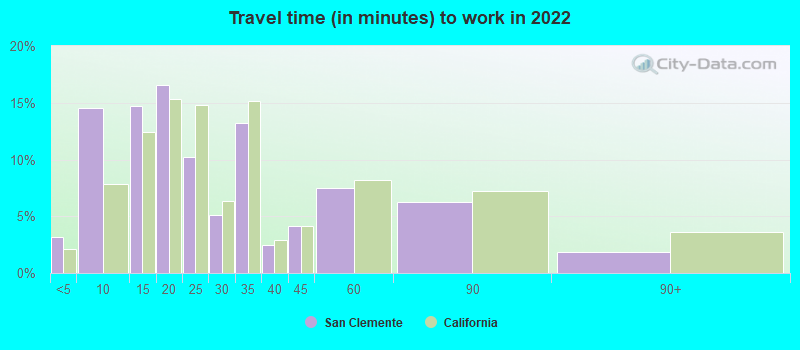
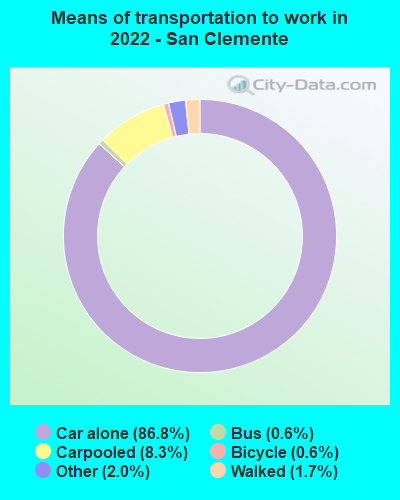
- Mean travel time to work (commute): 21.9 minutes
| Here: | 11.0 |
| California average: | 15.5 |


Graphs represent county-level data. Detailed 2008 Election Results
Religion statistics for San Clemente, CA (based on Orange County data)


| Religion | Adherents | Congregations |
|---|---|---|
| Catholic | 797,473 | 67 |
| Evangelical Protestant | 345,893 | 894 |
| Other | 141,815 | 329 |
| Mainline Protestant | 76,574 | 202 |
| Orthodox | 13,406 | 19 |
| Black Protestant | 2,424 | 8 |
| None | 1,632,647 | - |
Food Environment Statistics:
| Orange County: | 1.78 / 10,000 pop. |
| California: | 2.14 / 10,000 pop. |
| This county: | 0.06 / 10,000 pop. |
| California: | 0.04 / 10,000 pop. |
| This county: | 0.49 / 10,000 pop. |
| California: | 0.62 / 10,000 pop. |
| This county: | 1.46 / 10,000 pop. |
| California: | 1.49 / 10,000 pop. |
| Orange County: | 8.19 / 10,000 pop. |
| State: | 7.42 / 10,000 pop. |
| Orange County: | 6.3% |
| State: | 7.3% |
| Orange County: | 18.5% |
| State: | 21.3% |
| Orange County: | 16.4% |
| California: | 17.9% |
Health and Nutrition:
| San Clemente: | 51.7% |
| California: | 49.4% |
| This city: | 50.3% |
| California: | 48.0% |
| San Clemente: | 28.1 |
| California: | 28.1 |
| San Clemente: | 20.1% |
| State: | 20.2% |
| Here: | 9.0% |
| California: | 11.2% |
| San Clemente: | 6.9 |
| California: | 6.8 |
| San Clemente: | 33.2% |
| State: | 31.5% |
| Here: | 58.6% |
| State: | 56.4% |
| San Clemente: | 79.7% |
| California: | 80.9% |
More about Health and Nutrition of San Clemente, CA Residents
| Local government employment and payroll (March 2022) | |||||
| Function | Full-time employees | Monthly full-time payroll | Average yearly full-time wage | Part-time employees | Monthly part-time payroll |
|---|---|---|---|---|---|
| Streets and Highways | 33 | $200,233 | $72,812 | 1 | $1,484 |
| Parks and Recreation | 28 | $117,488 | $50,352 | 72 | $65,758 |
| Sewerage | 20 | $115,541 | $69,325 | 0 | $0 |
| Water Supply | 20 | $105,763 | $63,458 | 0 | $0 |
| Other Government Administration | 18 | $106,627 | $71,085 | 14 | $7,339 |
| Financial Administration | 15 | $74,533 | $59,626 | 3 | $5,186 |
| Housing and Community Development (Local) | 10 | $62,345 | $74,814 | 1 | $3,116 |
| Other and Unallocable | 8 | $39,027 | $58,541 | 4 | $6,032 |
| Solid Waste Management | 2 | $7,361 | $44,166 | 0 | $0 |
| Totals for Government | 154 | $828,919 | $64,591 | 95 | $88,913 |
San Clemente government finances - Expenditure in 2021 (per resident):
- Construction - Regular Highways: $13,248,000 ($208.77)
General - Other: $4,633,000 ($73.01)
Police Protection: $1,961,000 ($30.90)
Parks and Recreation: $1,905,000 ($30.02)
General Public Buildings: $313,000 ($4.93)
Housing and Community Development: $279,000 ($4.40)
Sewerage: $243,000 ($3.83)
Water Utilities: $162,000 ($2.55)
- Current Operations - Water Utilities: $21,166,000 ($333.55)
Police Protection: $17,393,000 ($274.09)
Parks and Recreation: $12,378,000 ($195.06)
Central Staff Services: $11,968,000 ($188.60)
Local Fire Protection: $10,665,000 ($168.07)
Sewerage: $9,867,000 ($155.49)
General - Other: $7,808,000 ($123.04)
Regular Highways: $6,252,000 ($98.52)
Protective Inspection and Regulation - Other: $3,749,000 ($59.08)
Health - Other: $2,474,000 ($38.99)
Judicial and Legal Services: $995,000 ($15.68)
Financial Administration: $696,000 ($10.97)
Natural Resources - Other: $664,000 ($10.46)
Housing and Community Development: $591,000 ($9.31)
Parking Facilities: $326,000 ($5.14)
Solid Waste Management: $217,000 ($3.42)
- Other Capital Outlay - General - Other: $13,000 ($0.20)
- Water Utilities - Interest on Debt: $3,053,000 ($48.11)
San Clemente government finances - Revenue in 2021 (per resident):
- Charges - Sewerage: $10,924,000 ($172.15)
Parks and Recreation: $4,070,000 ($64.14)
Other: $3,483,000 ($54.89)
Parking Facilities: $1,174,000 ($18.50)
Solid Waste Management: $252,000 ($3.97)
- Federal Intergovernmental - Housing and Community Development: $573,000 ($9.03)
Other: $122,000 ($1.92)
- Local Intergovernmental - Other: $79,000 ($1.24)
- Miscellaneous - General Revenue - Other: $2,012,000 ($31.71)
Rents: $1,845,000 ($29.07)
Interest Earnings: $462,000 ($7.28)
Fines and Forfeits: $347,000 ($5.47)
Donations From Private Sources: $100,000 ($1.58)
Sale of Property: $5,000 ($0.08)
- Revenue - Water Utilities: $25,828,000 ($407.02)
- State Intergovernmental - Other: $3,898,000 ($61.43)
Highways: $2,605,000 ($41.05)
General Local Government Support: $132,000 ($2.08)
- Tax - Property: $36,955,000 ($582.36)
General Sales and Gross Receipts: $12,821,000 ($202.04)
Public Utilities Sales: $2,595,000 ($40.89)
Other Selective Sales: $2,307,000 ($36.36)
Other License: $1,536,000 ($24.21)
Occupation and Business License - Other: $1,191,000 ($18.77)
Documentary and Stock Transfer: $1,096,000 ($17.27)
San Clemente government finances - Debt in 2021 (per resident):
- Long Term Debt - Beginning Outstanding - Unspecified Public Purpose: $76,313,000 ($1202.59)
Outstanding Unspecified Public Purpose: $73,598,000 ($1159.81)
Retired Unspecified Public Purpose: $2,715,000 ($42.78)
San Clemente government finances - Cash and Securities in 2021 (per resident):
- Bond Funds - Cash and Securities: $43,845,000 ($690.94)
- Other Funds - Cash and Securities: $49,273,000 ($776.48)
- Sinking Funds - Cash and Securities: $187,000 ($2.95)
4.86% of this county's 2021 resident taxpayers lived in other counties in 2020 ($95,983 average adjusted gross income)
| Here: | 4.86% |
| California average: | 5.19% |
0.01% of residents moved from foreign countries ($132 average AGI)
Orange County: 0.01% California average: 0.03%
Top counties from which taxpayers relocated into this county between 2020 and 2021:
| from Los Angeles County, CA | |
| from Riverside County, CA | |
| from San Diego County, CA |
5.71% of this county's 2020 resident taxpayers moved to other counties in 2021 ($106,828 average adjusted gross income)
| Here: | 5.71% |
| California average: | 6.14% |
0.01% of residents moved to foreign countries ($180 average AGI)
Orange County: 0.01% California average: 0.02%
Top counties to which taxpayers relocated from this county between 2020 and 2021:
| to Los Angeles County, CA | |
| to Riverside County, CA | |
| to San Diego County, CA |
| Businesses in San Clemente, CA | ||||
| Name | Count | Name | Count | |
|---|---|---|---|---|
| 7-Eleven | 4 | Jones New York | 1 | |
| 99 Cents Only Stores | 1 | KFC | 1 | |
| Albertsons | 2 | Kroger | 3 | |
| AutoZone | 1 | Lowe's | 1 | |
| Baja Fresh Mexican Grill | 1 | McDonald's | 1 | |
| Baskin-Robbins | 1 | New Balance | 1 | |
| Best Western | 1 | Office Depot | 1 | |
| Big O Tires | 1 | Panda Express | 1 | |
| Blockbuster | 2 | Panera Bread | 1 | |
| CVS | 2 | Payless | 1 | |
| Carl\s Jr. | 3 | Penske | 1 | |
| Circle K | 2 | Pier 1 Imports | 1 | |
| Cold Stone Creamery | 1 | Quiznos | 1 | |
| Comfort Suites | 1 | RadioShack | 2 | |
| Curves | 1 | Rite Aid | 1 | |
| DHL | 1 | Sears | 1 | |
| Days Inn | 1 | Staples | 1 | |
| Dennys | 1 | Starbucks | 5 | |
| Domino's Pizza | 1 | T-Mobile | 4 | |
| El Pollo Loco | 1 | Taco Bell | 2 | |
| FedEx | 14 | Trader Joe's | 1 | |
| GameStop | 1 | Travelodge | 1 | |
| H&R Block | 1 | True Value | 1 | |
| Hilton | 1 | U-Haul | 1 | |
| Holiday Inn | 2 | UPS | 13 | |
| IHOP | 1 | Vans | 1 | |
| Jamba Juice | 1 | Walmart | 1 | |
Strongest AM radio stations in San Clemente:
- KPLS (830 AM; 50 kW; ORANGE, CA; Owner: CRN LICENSES, LLC)
- KFI (640 AM; 50 kW; LOS ANGELES, CA; Owner: CAPSTAR TX LIMITED PARTNERSHIP)
- KLAC (570 AM; 50 kW; LOS ANGELES, CA; Owner: AMFM RADIO LICENSES, L.L.C.)
- KTNQ (1020 AM; 50 kW; LOS ANGELES, CA; Owner: KTNQ-AM LICENSE CORP.)
- KFMB (760 AM; 50 kW; SAN DIEGO, CA; Owner: MIDWEST TELEVISION, INC.)
- KXTA (1150 AM; 50 kW; LOS ANGELES, CA; Owner: CITICASTERS LICENSES, L.P.)
- KNX (1070 AM; 50 kW; LOS ANGELES, CA; Owner: INFINITY BROADCASTING OPERATIONS, INC.)
- KDIS (1110 AM; 50 kW; PASADENA, CA; Owner: ABC,INC.)
- KFWB (980 AM; 50 kW; LOS ANGELES, CA; Owner: INFINITY BROADCASTING OPERATIONS, INC.)
- KSPN (710 AM; 50 kW; LOS ANGELES, CA; Owner: KABC-AM RADIO, INC.)
- KCBQ (1170 AM; 50 kW; SAN DIEGO, CA; Owner: RADIO 1210, INC.)
- KPRZ (1210 AM; 20 kW; SAN MARCOS, CA; Owner: RADIO 1210, INC.)
- KMPC (1540 AM; 50 kW; LOS ANGELES, CA; Owner: ROSE CITY RADIO CORPORATION)
Strongest FM radio stations in San Clemente:
- KWVE (107.9 FM; SAN CLEMENTE, CA; Owner: CALVARY CHAPEL OF COSTA MESA)
- KSBR (88.5 FM; MISSION VIEJO, CA; Owner: SADDLEBACK COMMUNITY COLLEGE DIST.)
- KRTM (88.9 FM; TEMECULA, CA; Owner: PENFOLD COMMUNICATIONS, INC.)
- KLRD (90.1 FM; YUCAIPA, CA; Owner: EDUCATIONAL MEDIA FOUNDATION)
- KDLE (103.1 FM; NEWPORT BEACH, CA; Owner: ENTRAVISION HOLDINGS, LLC.)
- KUOR-FM (89.1 FM; REDLANDS, CA; Owner: UNIVERSITY OF REDLANDS)
- KCBS-FM (93.1 FM; LOS ANGELES, CA; Owner: INFINITY BROADCASTING OPERATIONS, INC.)
- KZLA-FM (93.9 FM; LOS ANGELES, CA; Owner: EMMIS RADIO LICENSE CORPORATION)
- KSCA (101.9 FM; GLENDALE, CA; Owner: HBC LICENSE CORPORATION)
- KLOS (95.5 FM; LOS ANGELES, CA; Owner: KLOS-FM RADIO, INC.)
- K212FA (90.3 FM; TEMPLE CITY, CA; Owner: EDUCATIONAL MEDIA FOUNDATION)
- KOST (103.5 FM; LOS ANGELES, CA; Owner: CAPSTAR TX LIMITED PARTNERSHIP)
- KPWR (105.9 FM; LOS ANGELES, CA; Owner: EMMIS RADIO LICENSE CORPORATION)
- KLSX (97.1 FM; LOS ANGELES, CA; Owner: INFINITY BROADCASTING OPERATIONS, INC.)
- KLVE (107.5 FM; LOS ANGELES, CA; Owner: KLVE-FM LICENSE CORP.)
- KIIS-FM (102.7 FM; LOS ANGELES, CA; Owner: CITICASTERS LICENSES, L.P.)
- KUSC (91.5 FM; LOS ANGELES, CA; Owner: UNIVERSITY OF SOUTHERN CALIFORNIA)
- KPCC (89.3 FM; PASADENA, CA; Owner: PASADENA AREA COMMUNITY COLLEGE DISTRICT)
- KHHT (92.3 FM; LOS ANGELES, CA; Owner: AMFM RADIO LICENSES, L.L.C.)
- KBIG-FM (104.3 FM; LOS ANGELES, CA; Owner: AMFM RADIO LICENSES, L.L.C.)
- National Bridge Inventory (NBI) Statistics
- 37Number of bridges
- 482ft / 147mTotal length
- $121,000Total costs
- 2,803,805Total average daily traffic
- 185,202Total average daily truck traffic
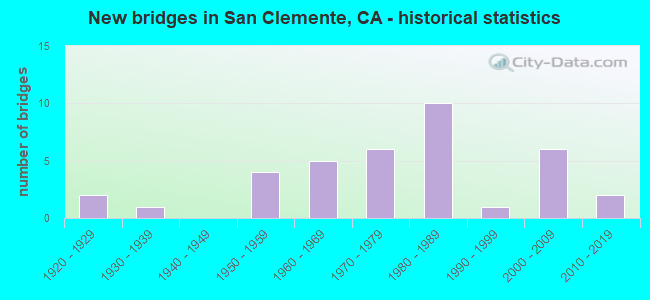
- New bridges - historical statistics
- 21920-1929
- 11930-1939
- 41950-1959
- 51960-1969
- 61970-1979
- 101980-1989
- 11990-1999
- 62000-2009
- 22010-2019
FCC Registered Antenna Towers: 21 (See the full list of FCC Registered Antenna Towers)
FCC Registered Private Land Mobile Towers: 12 (See the full list of FCC Registered Private Land Mobile Towers in San Clemente, CA)
FCC Registered Broadcast Land Mobile Towers: 41 (See the full list of FCC Registered Broadcast Land Mobile Towers)
FCC Registered Microwave Towers: 28 (See the full list of FCC Registered Microwave Towers in this town)
FCC Registered Paging Towers: 19 (See the full list of FCC Registered Paging Towers)
FCC Registered Maritime Coast & Aviation Ground Towers: 3 (See the full list of FCC Registered Maritime Coast & Aviation Ground Towers)
FCC Registered Amateur Radio Licenses: 384 (See the full list of FCC Registered Amateur Radio Licenses in San Clemente)
FAA Registered Aircraft Manufacturers and Dealers: 2 (See the full list of FAA Registered Manufacturers and Dealers in San Clemente)
FAA Registered Aircraft: 60 (See the full list of FAA Registered Aircraft)
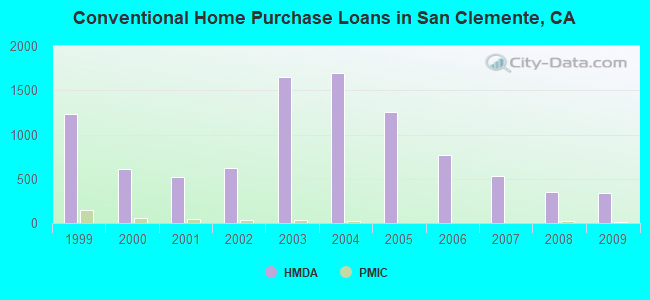
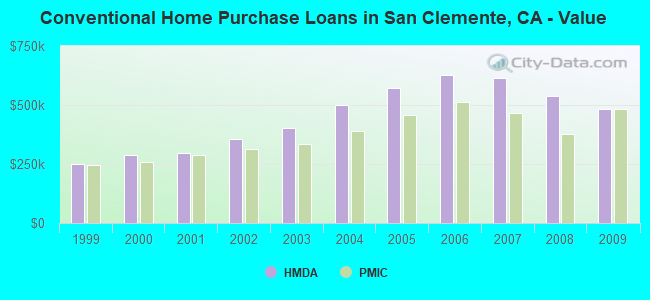
| Home Mortgage Disclosure Act Aggregated Statistics For Year 2009 (Based on 8 full and 3 partial tracts) | ||||||||||||||
| A) FHA, FSA/RHS & VA Home Purchase Loans | B) Conventional Home Purchase Loans | C) Refinancings | D) Home Improvement Loans | E) Loans on Dwellings For 5+ Families | F) Non-occupant Loans on < 5 Family Dwellings (A B C & D) | G) Loans On Manufactured Home Dwelling (A B C & D) | ||||||||
|---|---|---|---|---|---|---|---|---|---|---|---|---|---|---|
| Number | Average Value | Number | Average Value | Number | Average Value | Number | Average Value | Number | Average Value | Number | Average Value | Number | Average Value | |
| LOANS ORIGINATED | 87 | $480,739 | 336 | $483,575 | 1,692 | $390,314 | 74 | $293,254 | 2 | $1,712,500 | 210 | $371,766 | 6 | $159,898 |
| APPLICATIONS APPROVED, NOT ACCEPTED | 10 | $454,307 | 44 | $496,619 | 168 | $420,487 | 5 | $135,068 | 0 | $0 | 25 | $350,494 | 2 | $127,095 |
| APPLICATIONS DENIED | 17 | $428,255 | 69 | $523,046 | 452 | $489,246 | 18 | $247,144 | 2 | $2,462,500 | 71 | $438,065 | 9 | $224,028 |
| APPLICATIONS WITHDRAWN | 15 | $507,650 | 79 | $512,085 | 297 | $437,560 | 9 | $408,736 | 0 | $0 | 44 | $403,548 | 1 | $232,120 |
| FILES CLOSED FOR INCOMPLETENESS | 6 | $368,535 | 16 | $498,226 | 98 | $435,988 | 11 | $361,064 | 0 | $0 | 12 | $359,635 | 0 | $0 |
Detailed mortgage data for all 11 tracts in San Clemente, CA
| Private Mortgage Insurance Companies Aggregated Statistics For Year 2009 (Based on 5 full and 3 partial tracts) | ||||
| A) Conventional Home Purchase Loans | B) Refinancings | |||
|---|---|---|---|---|
| Number | Average Value | Number | Average Value | |
| LOANS ORIGINATED | 7 | $481,871 | 2 | $296,275 |
| APPLICATIONS APPROVED, NOT ACCEPTED | 7 | $519,861 | 4 | $429,488 |
| APPLICATIONS DENIED | 4 | $244,678 | 4 | $576,405 |
| APPLICATIONS WITHDRAWN | 4 | $298,690 | 1 | $337,360 |
| FILES CLOSED FOR INCOMPLETENESS | 1 | $234,280 | 0 | $0 |
2005 - 2018 National Fire Incident Reporting System (NFIRS) incidents
- Fire incident types reported to NFIRS in San Clemente, CA
- 42342.3%Outside Fires
- 27827.8%Structure Fires
- 23823.8%Mobile Property/Vehicle Fires
- 626.2%Other
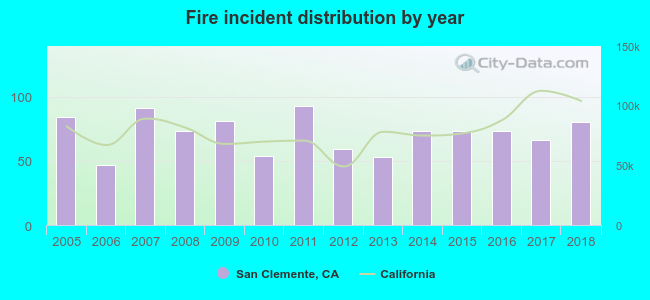 According to the data from the years 2005 - 2018 the average number of fires per year is 71. The highest number of fire incidents - 93 took place in 2011, and the least - 47 in 2006. The data has a dropping trend.
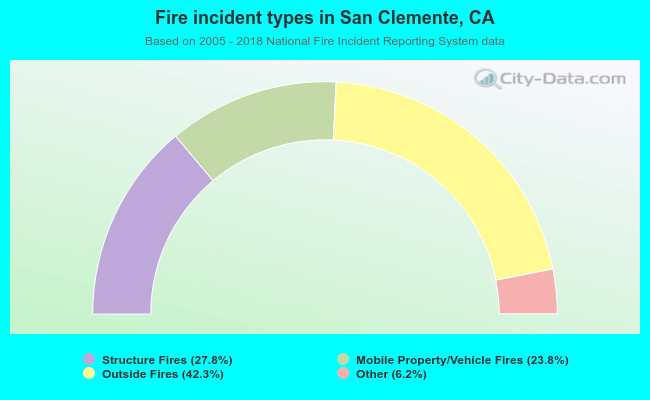 When looking into fire subcategories, the most incidents belonged to: Outside Fires (42.3%), and Structure Fires (27.8%).
Fire-safe hotels and motels in San Clemente, California:
- The Volare, an Ascend Hotel Collection Member, 111 S Avenida De Ln Estrella, San Clemente, California 92672 , Phone: (949) 361-3000, Fax: (949) 361-2472
- Comfort Suites San Clemente, 3701 S El Camino Real, San Clemente, California 92672 , Phone: (949) 361-6600, Fax: (949) 366-9745
- Hampton Inn & Suites San Clemente, 2481 S El Camino Real, San Clemente, California 92672 , Phone: (949) 366-1000, Fax: (949) 366-1030
- Best Western Casablanca Inn, 1601 N El Camino Real, San Clemente, California 92672 , Phone: (949) 361-1644, Fax: (949) 361-3825
- Rodeway Inn, 1301 N El Camino Real, San Clemente, California 92672 , Phone: (949) 361-0636, Fax: (949) 361-0074
- Holiday Inn Express San Clemente, 35 Via Pico Plz, San Clemente, California 92672 , Phone: (949) 498-8800, Fax: (949) 498-4840
- Villa Del Mar, 612 Avenida Victoria, San Clemente, California 92672 , Phone: (949) 498-5080, Fax: (949) 498-8857
- Sea Horse Resort, 602 Avenida Victoria, San Clemente, California 92672 , Phone: (949) 492-1720, Fax: (949) 498-8857
- Hotel Miramar, 2222 S El Camino Real, San Clemente, California 92672 , Phone: (949) 492-4992
| Most common first names in San Clemente, CA among deceased individuals | ||
| Name | Count | Lived (average) |
|---|---|---|
| John | 268 | 76.0 years |
| Robert | 226 | 74.9 years |
| Mary | 225 | 81.8 years |
| William | 198 | 77.0 years |
| James | 151 | 73.2 years |
| George | 136 | 79.1 years |
| Charles | 131 | 76.8 years |
| Helen | 130 | 81.9 years |
| Richard | 120 | 73.6 years |
| Dorothy | 102 | 81.3 years |
| Most common last names in San Clemente, CA among deceased individuals | ||
| Last name | Count | Lived (average) |
|---|---|---|
| Smith | 95 | 76.7 years |
| Johnson | 71 | 78.5 years |
| Miller | 60 | 73.7 years |
| Anderson | 55 | 78.4 years |
| Jones | 46 | 78.6 years |
| Brown | 45 | 76.0 years |
| Davis | 45 | 79.5 years |
| Wilson | 36 | 80.2 years |
| Nelson | 31 | 79.1 years |
| Taylor | 28 | 81.5 years |
- 79.8%Utility gas
- 14.5%Electricity
- 2.6%Solar energy
- 1.8%No fuel used
- 1.0%Bottled, tank, or LP gas
- 0.2%Other fuel
- 62.2%Utility gas
- 28.6%Electricity
- 4.3%No fuel used
- 4.1%Bottled, tank, or LP gas
- 0.4%Solar energy
- 0.3%Wood
- 0.2%Other fuel
San Clemente compared to California state average:
- Median house value above state average.
- Unemployed percentage significantly below state average.
- Black race population percentage below state average.
- Hispanic race population percentage below state average.
- Median age above state average.
- Foreign-born population percentage below state average.
- Length of stay since moving in significantly above state average.
- Percentage of population with a bachelor's degree or higher above state average.
San Clemente on our top lists:
- #2 on the list of "Top 101 cities with largest percentage of females in occupations: fire fighting and prevention workers including supervisors (population 50,000+)"
- #2 on the list of "Top 101 cities with largest percentage of females in industries: construction (population 50,000+)"
- #16 on the list of "Top 101 cities with the smallest temperature differences during a year (population 50,000+)"
- #16 on the list of "Top 101 cities with largest percentage of females in occupations: community and social service occupations (population 50,000+)"
- #19 on the list of "Top 101 cities with largest percentage of females in occupations: business and financial operations occupations (population 50,000+)"
- #19 on the list of "Top 100 cities with highest median house value (pop. 50,000+)"
- #20 on the list of "Top 101 cities with the lowest number of thefts per 100,000 residents (population 50,000+)"
- #21 on the list of "Top 101 cities with largest percentage of females in occupations: management occupations (population 50,000+)"
- #23 on the list of "Top 100 safest cities (lowest city-data.com crime index) (pop. 50,000+)"
- #25 on the list of "Top 101 cities with the lowest city-data.com crime index (population 50,000+)"
- #25 on the list of "Top 101 cities with largest percentage of females in industries: other services, except public administration (population 50,000+)"
- #26 on the list of "Top 101 cities with largest percentage of females in industries: arts, entertainment, and recreation (population 50,000+)"
- #27 on the list of "Top 101 cities with largest percentage of females in occupations: construction and extraction occupations (population 50,000+)"
- #27 on the list of "Top 101 cities with largest percentage of females in industries: professional, scientific, and technical services (population 50,000+)"
- #31 on the list of "Top 101 cities with largest percentage of males in occupations: legal occupations (population 50,000+)"
- #39 on the list of "Top 101 cities with the highest cost per building permit(population 50,000+)"
- #39 on the list of "Top 100 cities with highest ratio of median house value to median household income (pop. 50,000+)"
- #52 on the list of "Top 101 larger cities with the highest increase in household income from 2000 (population 50,000+)"
- #61 on the list of "Top 101 cities with the lowest number of burglaries per 100,000 residents (population 50,000+)"
- #61 on the list of "Top 101 cities with largest percentage of males in industries: professional, scientific, and technical services (population 50,000+)"
- #4 on the list of "Top 101 counties with the highest total withdrawal of fresh water for public supply"
- #5 on the list of "Top 101 counties with the most Catholic adherents"
- #6 on the list of "Top 101 counties with the highest ground withdrawal of fresh water for public supply"
- #7 on the list of "Top 101 counties with the most Evangelical Protestant adherents"
- #8 on the list of "Top 101 counties with the highest Particulate Matter (PM2.5) Annual air pollution readings in 2012 (µg/m3)"

|
|
Total of 2052 patent applications in 2008-2024.