Coto de Caza, California Submit your own pictures of this place and show them to the world
OSM Map
General Map
Google Map
MSN Map
OSM Map
General Map
Google Map
MSN Map
OSM Map
General Map
Google Map
MSN Map
OSM Map
General Map
Google Map
MSN Map
Please wait while loading the map...
Population in 2010: 14,866. Population change since 2000: +13.9%Males: 7,518 Females: 7,348
March 2022 cost of living index in Coto de Caza: 88.1 (less than average, U.S. average is 100) Percentage of residents living in poverty in 2022: 3.3%for White Non-Hispanic residents , 3.3% for Black residents , 2.3% for Hispanic or Latino residents , 4.4% for other race residents , 0.8% for two or more races residents )
Profiles of local businesses
Business Search - 14 Million verified businesses
Data:
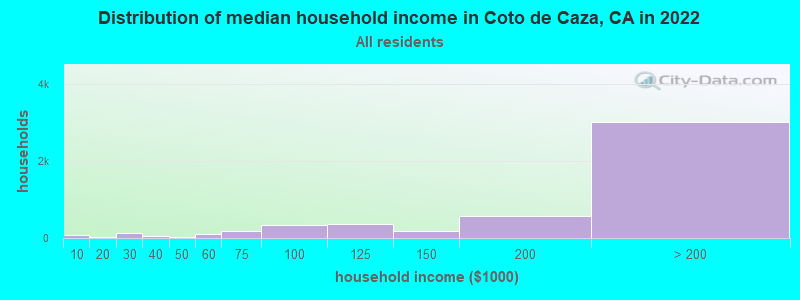
Median household income ($)
Median household income (% change since 2000)
Household income diversity
Ratio of average income to average house value (%)
Ratio of average income to average rent
Median household income ($) - White
Median household income ($) - Black or African American
Median household income ($) - Asian
Median household income ($) - Hispanic or Latino
Median household income ($) - American Indian and Alaska Native
Median household income ($) - Multirace
Median household income ($) - Other Race
Median household income for houses/condos with a mortgage ($)
Median household income for apartments without a mortgage ($)
Races - White alone (%)
Races - White alone (% change since 2000)
Races - Black alone (%)
Races - Black alone (% change since 2000)
Races - American Indian alone (%)
Races - American Indian alone (% change since 2000)
Races - Asian alone (%)
Races - Asian alone (% change since 2000)
Races - Hispanic (%)
Races - Hispanic (% change since 2000)
Races - Native Hawaiian and Other Pacific Islander alone (%)
Races - Native Hawaiian and Other Pacific Islander alone (% change since 2000)
Races - Two or more races (%)
Races - Two or more races (% change since 2000)
Races - Other race alone (%)
Races - Other race alone (% change since 2000)
Racial diversity
Unemployment (%)
Unemployment (% change since 2000)
Unemployment (%) - White
Unemployment (%) - Black or African American
Unemployment (%) - Asian
Unemployment (%) - Hispanic or Latino
Unemployment (%) - American Indian and Alaska Native
Unemployment (%) - Multirace
Unemployment (%) - Other Race
Population density (people per square mile)
Population - Males (%)
Population - Females (%)
Population - Males (%) - White
Population - Males (%) - Black or African American
Population - Males (%) - Asian
Population - Males (%) - Hispanic or Latino
Population - Males (%) - American Indian and Alaska Native
Population - Males (%) - Multirace
Population - Males (%) - Other Race
Population - Females (%) - White
Population - Females (%) - Black or African American
Population - Females (%) - Asian
Population - Females (%) - Hispanic or Latino
Population - Females (%) - American Indian and Alaska Native
Population - Females (%) - Multirace
Population - Females (%) - Other Race
Coronavirus confirmed cases (Apr 27, 2024)
Deaths caused by coronavirus (Apr 27, 2024)
Coronavirus confirmed cases (per 100k population) (Apr 27, 2024)
Deaths caused by coronavirus (per 100k population) (Apr 27, 2024)
Daily increase in number of cases (Apr 27, 2024)
Weekly increase in number of cases (Apr 27, 2024)
Cases doubled (in days) (Apr 27, 2024)
Hospitalized patients (Apr 18, 2022)
Negative test results (Apr 18, 2022)
Total test results (Apr 18, 2022)
COVID Vaccine doses distributed (per 100k population) (Sep 19, 2023)
COVID Vaccine doses administered (per 100k population) (Sep 19, 2023)
COVID Vaccine doses distributed (Sep 19, 2023)
COVID Vaccine doses administered (Sep 19, 2023)
Likely homosexual households (%)
Likely homosexual households (% change since 2000)
Likely homosexual households - Lesbian couples (%)
Likely homosexual households - Lesbian couples (% change since 2000)
Likely homosexual households - Gay men (%)
Likely homosexual households - Gay men (% change since 2000)
Cost of living index
Median gross rent ($)
Median contract rent ($)
Median monthly housing costs ($)
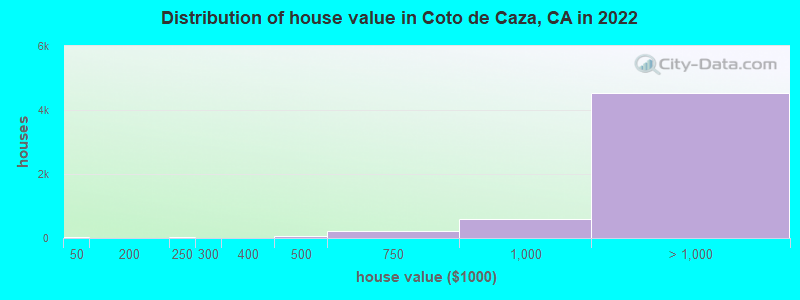
Median house or condo value ($)
Median house or condo value ($ change since 2000)
Mean house or condo value by units in structure - 1, detached ($)
Mean house or condo value by units in structure - 1, attached ($)
Mean house or condo value by units in structure - 2 ($)
Mean house or condo value by units in structure by units in structure - 3 or 4 ($)
Mean house or condo value by units in structure - 5 or more ($)
Mean house or condo value by units in structure - Boat, RV, van, etc. ($)
Mean house or condo value by units in structure - Mobile home ($)
Median house or condo value ($) - White
Median house or condo value ($) - Black or African American
Median house or condo value ($) - Asian
Median house or condo value ($) - Hispanic or Latino
Median house or condo value ($) - American Indian and Alaska Native
Median house or condo value ($) - Multirace
Median house or condo value ($) - Other Race
Median resident age
Resident age diversity
Median resident age - Males
Median resident age - Females
Median resident age - White
Median resident age - Black or African American
Median resident age - Asian
Median resident age - Hispanic or Latino
Median resident age - American Indian and Alaska Native
Median resident age - Multirace
Median resident age - Other Race
Median resident age - Males - White
Median resident age - Males - Black or African American
Median resident age - Males - Asian
Median resident age - Males - Hispanic or Latino
Median resident age - Males - American Indian and Alaska Native
Median resident age - Males - Multirace
Median resident age - Males - Other Race
Median resident age - Females - White
Median resident age - Females - Black or African American
Median resident age - Females - Asian
Median resident age - Females - Hispanic or Latino
Median resident age - Females - American Indian and Alaska Native
Median resident age - Females - Multirace
Median resident age - Females - Other Race
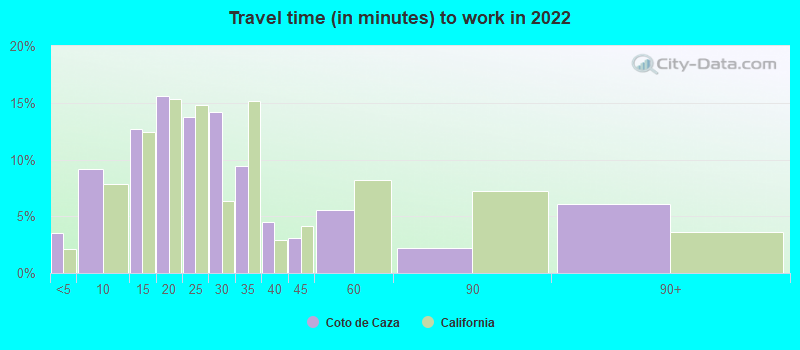
Commute - mean travel time to work (minutes)
Travel time to work - Less than 5 minutes (%)
Travel time to work - Less than 5 minutes (% change since 2000)
Travel time to work - 5 to 9 minutes (%)
Travel time to work - 5 to 9 minutes (% change since 2000)
Travel time to work - 10 to 19 minutes (%)
Travel time to work - 10 to 19 minutes (% change since 2000)
Travel time to work - 20 to 29 minutes (%)
Travel time to work - 20 to 29 minutes (% change since 2000)
Travel time to work - 30 to 39 minutes (%)
Travel time to work - 30 to 39 minutes (% change since 2000)
Travel time to work - 40 to 59 minutes (%)
Travel time to work - 40 to 59 minutes (% change since 2000)
Travel time to work - 60 to 89 minutes (%)
Travel time to work - 60 to 89 minutes (% change since 2000)
Travel time to work - 90 or more minutes (%)
Travel time to work - 90 or more minutes (% change since 2000)
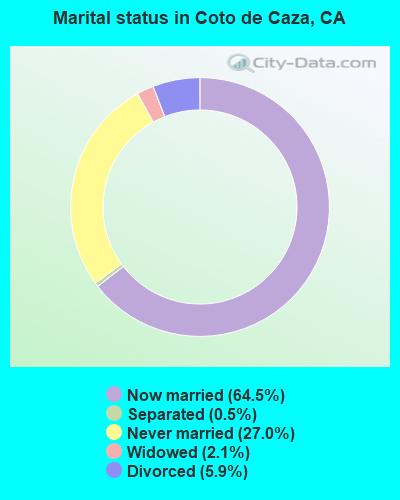
Marital status - Never married (%)
Marital status - Now married (%)
Marital status - Separated (%)
Marital status - Widowed (%)
Marital status - Divorced (%)
Median family income ($)
Median family income (% change since 2000)
Median non-family income ($)
Median non-family income (% change since 2000)
Median per capita income ($)
Median per capita income (% change since 2000)
Median family income ($) - White
Median family income ($) - Black or African American
Median family income ($) - Asian
Median family income ($) - Hispanic or Latino
Median family income ($) - American Indian and Alaska Native
Median family income ($) - Multirace
Median family income ($) - Other Race
Median year house/condo built
Median year apartment built
Year house built - Built 2005 or later (%)
Year house built - Built 2000 to 2004 (%)
Year house built - Built 1990 to 1999 (%)
Year house built - Built 1980 to 1989 (%)
Year house built - Built 1970 to 1979 (%)
Year house built - Built 1960 to 1969 (%)
Year house built - Built 1950 to 1959 (%)
Year house built - Built 1940 to 1949 (%)
Year house built - Built 1939 or earlier (%)
Average household size
Household density (households per square mile)
Average household size - White
Average household size - Black or African American
Average household size - Asian
Average household size - Hispanic or Latino
Average household size - American Indian and Alaska Native
Average household size - Multirace
Average household size - Other Race
Occupied housing units (%)
Vacant housing units (%)
Owner occupied housing units (%)
Renter occupied housing units (%)
Vacancy status - For rent (%)
Vacancy status - For sale only (%)
Vacancy status - Rented or sold, not occupied (%)
Vacancy status - For seasonal, recreational, or occasional use (%)
Vacancy status - For migrant workers (%)
Vacancy status - Other vacant (%)
Residents with income below the poverty level (%)
Residents with income below 50% of the poverty level (%)
Children below poverty level (%)
Poor families by family type - Married-couple family (%)
Poor families by family type - Male, no wife present (%)
Poor families by family type - Female, no husband present (%)
Poverty status for native-born residents (%)
Poverty status for foreign-born residents (%)
Poverty among high school graduates not in families (%)
Poverty among people who did not graduate high school not in families (%)
Residents with income below the poverty level (%) - White
Residents with income below the poverty level (%) - Black or African American
Residents with income below the poverty level (%) - Asian
Residents with income below the poverty level (%) - Hispanic or Latino
Residents with income below the poverty level (%) - American Indian and Alaska Native
Residents with income below the poverty level (%) - Multirace
Residents with income below the poverty level (%) - Other Race
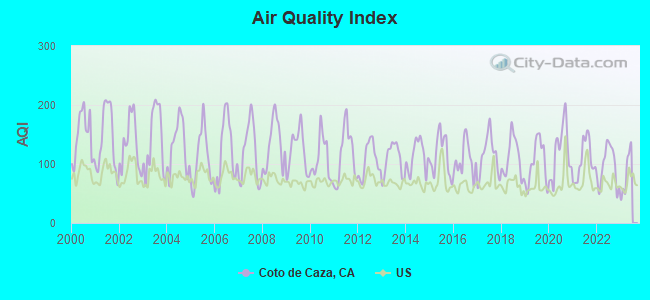
Air pollution - Air Quality Index (AQI)
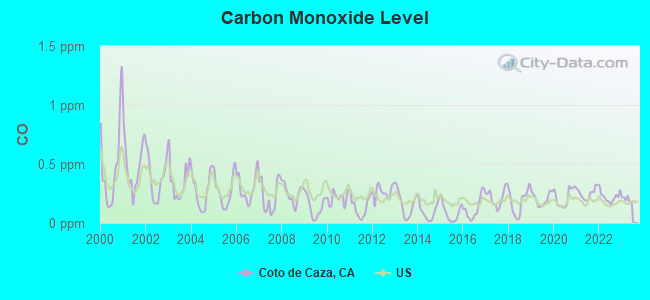
Air pollution - CO
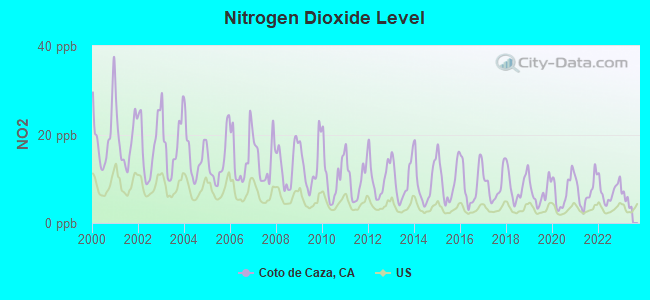
Air pollution - NO2
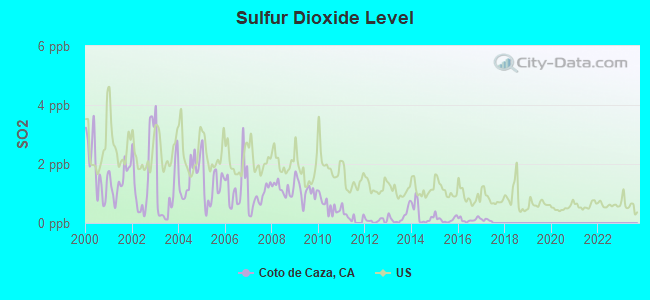
Air pollution - SO2
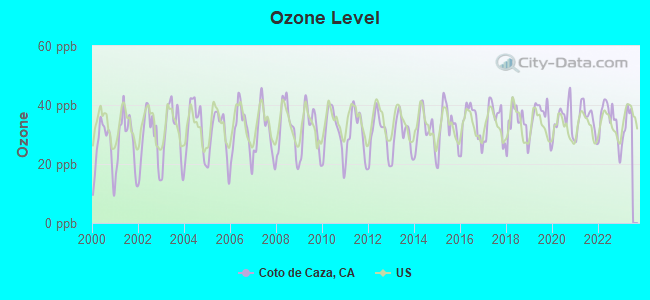
Air pollution - Ozone
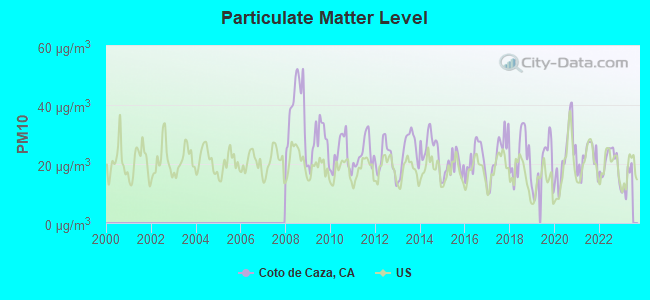
Air pollution - PM10
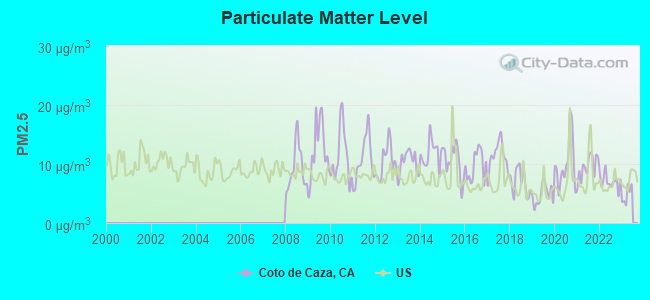
Air pollution - PM25
Air pollution - Pb
Crime - Murders per 100,000 population
Crime - Rapes per 100,000 population
Crime - Robberies per 100,000 population
Crime - Assaults per 100,000 population
Crime - Burglaries per 100,000 population
Crime - Thefts per 100,000 population
Crime - Auto thefts per 100,000 population
Crime - Arson per 100,000 population
Crime - City-data.com crime index
Crime - Violent crime index
Crime - Property crime index
Crime - Murders per 100,000 population (5 year average)
Crime - Rapes per 100,000 population (5 year average)
Crime - Robberies per 100,000 population (5 year average)
Crime - Assaults per 100,000 population (5 year average)
Crime - Burglaries per 100,000 population (5 year average)
Crime - Thefts per 100,000 population (5 year average)
Crime - Auto thefts per 100,000 population (5 year average)
Crime - Arson per 100,000 population (5 year average)
Crime - City-data.com crime index (5 year average)
Crime - Violent crime index (5 year average)
Crime - Property crime index (5 year average)
1996 Presidential Elections Results (%) - Democratic Party (Clinton)
1996 Presidential Elections Results (%) - Republican Party (Dole)
1996 Presidential Elections Results (%) - Other
2000 Presidential Elections Results (%) - Democratic Party (Gore)
2000 Presidential Elections Results (%) - Republican Party (Bush)
2000 Presidential Elections Results (%) - Other
2004 Presidential Elections Results (%) - Democratic Party (Kerry)
2004 Presidential Elections Results (%) - Republican Party (Bush)
2004 Presidential Elections Results (%) - Other
2008 Presidential Elections Results (%) - Democratic Party (Obama)
2008 Presidential Elections Results (%) - Republican Party (McCain)
2008 Presidential Elections Results (%) - Other
2012 Presidential Elections Results (%) - Democratic Party (Obama)
2012 Presidential Elections Results (%) - Republican Party (Romney)
2012 Presidential Elections Results (%) - Other
2016 Presidential Elections Results (%) - Democratic Party (Clinton)
2016 Presidential Elections Results (%) - Republican Party (Trump)
2016 Presidential Elections Results (%) - Other
2020 Presidential Elections Results (%) - Democratic Party (Biden)
2020 Presidential Elections Results (%) - Republican Party (Trump)
2020 Presidential Elections Results (%) - Other
Ancestries Reported - Arab (%)
Ancestries Reported - Czech (%)
Ancestries Reported - Danish (%)
Ancestries Reported - Dutch (%)
Ancestries Reported - English (%)
Ancestries Reported - French (%)
Ancestries Reported - French Canadian (%)
Ancestries Reported - German (%)
Ancestries Reported - Greek (%)
Ancestries Reported - Hungarian (%)
Ancestries Reported - Irish (%)
Ancestries Reported - Italian (%)
Ancestries Reported - Lithuanian (%)
Ancestries Reported - Norwegian (%)
Ancestries Reported - Polish (%)
Ancestries Reported - Portuguese (%)
Ancestries Reported - Russian (%)
Ancestries Reported - Scotch-Irish (%)
Ancestries Reported - Scottish (%)
Ancestries Reported - Slovak (%)
Ancestries Reported - Subsaharan African (%)
Ancestries Reported - Swedish (%)
Ancestries Reported - Swiss (%)
Ancestries Reported - Ukrainian (%)
Ancestries Reported - United States (%)
Ancestries Reported - Welsh (%)
Ancestries Reported - West Indian (%)
Ancestries Reported - Other (%)
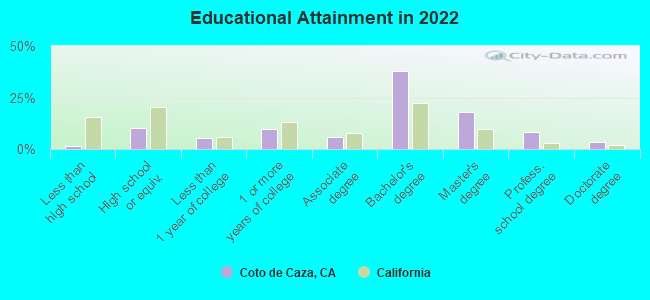
Educational Attainment - No schooling completed (%)
Educational Attainment - Less than high school (%)
Educational Attainment - High school or equivalent (%)
Educational Attainment - Less than 1 year of college (%)
Educational Attainment - 1 or more years of college (%)
Educational Attainment - Associate degree (%)
Educational Attainment - Bachelor's degree (%)
Educational Attainment - Master's degree (%)
Educational Attainment - Professional school degree (%)
Educational Attainment - Doctorate degree (%)
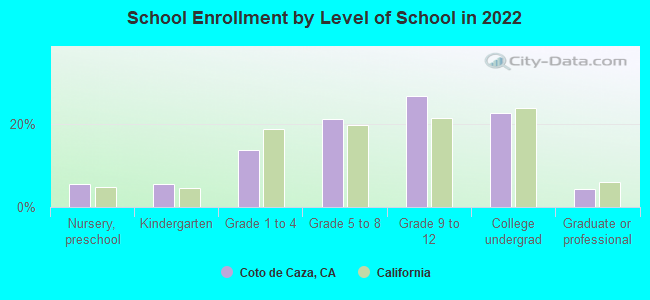
School Enrollment - Nursery, preschool (%)
School Enrollment - Kindergarten (%)
School Enrollment - Grade 1 to 4 (%)
School Enrollment - Grade 5 to 8 (%)
School Enrollment - Grade 9 to 12 (%)
School Enrollment - College undergrad (%)
School Enrollment - Graduate or professional (%)
School Enrollment - Not enrolled in school (%)
School enrollment - Public schools (%)
School enrollment - Private schools (%)
School enrollment - Not enrolled (%)
Median number of rooms in houses and condos
Median number of rooms in apartments
Housing units lacking complete plumbing facilities (%)
Housing units lacking complete kitchen facilities (%)
Density of houses
Urban houses (%)
Rural houses (%)
Households with people 60 years and over (%)
Households with people 65 years and over (%)
Households with people 75 years and over (%)
Households with one or more nonrelatives (%)
Households with no nonrelatives (%)
Population in households (%)
Family households (%)
Nonfamily households (%)
Population in families (%)
Family households with own children (%)
Median number of bedrooms in owner occupied houses
Mean number of bedrooms in owner occupied houses
Median number of bedrooms in renter occupied houses
Mean number of bedrooms in renter occupied houses
Median number of vehichles in owner occupied houses
Mean number of vehichles in owner occupied houses
Median number of vehichles in renter occupied houses
Mean number of vehichles in renter occupied houses
Mortgage status - with mortgage (%)
Mortgage status - with second mortgage (%)
Mortgage status - with home equity loan (%)
Mortgage status - with both second mortgage and home equity loan (%)
Mortgage status - without a mortgage (%)
Average family size
Average family size - White
Average family size - Black or African American
Average family size - Asian
Average family size - Hispanic or Latino
Average family size - American Indian and Alaska Native
Average family size - Multirace
Average family size - Other Race
Geographical mobility - Same house 1 year ago (%)
Geographical mobility - Moved within same county (%)
Geographical mobility - Moved from different county within same state (%)
Geographical mobility - Moved from different state (%)
Geographical mobility - Moved from abroad (%)
Place of birth - Born in state of residence (%)
Place of birth - Born in other state (%)
Place of birth - Native, outside of US (%)
Place of birth - Foreign born (%)
Housing units in structures - 1, detached (%)
Housing units in structures - 1, attached (%)
Housing units in structures - 2 (%)
Housing units in structures - 3 or 4 (%)
Housing units in structures - 5 to 9 (%)
Housing units in structures - 10 to 19 (%)
Housing units in structures - 20 to 49 (%)
Housing units in structures - 50 or more (%)
Housing units in structures - Mobile home (%)
Housing units in structures - Boat, RV, van, etc. (%)
House/condo owner moved in on average (years ago)
Renter moved in on average (years ago)
Year householder moved into unit - Moved in 1999 to March 2000 (%)
Year householder moved into unit - Moved in 1995 to 1998 (%)
Year householder moved into unit - Moved in 1990 to 1994 (%)
Year householder moved into unit - Moved in 1980 to 1989 (%)
Year householder moved into unit - Moved in 1970 to 1979 (%)
Year householder moved into unit - Moved in 1969 or earlier (%)
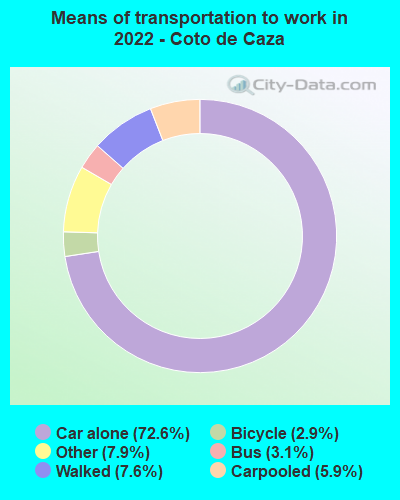
Means of transportation to work - Drove car alone (%)
Means of transportation to work - Carpooled (%)
Means of transportation to work - Public transportation (%)
Means of transportation to work - Bus or trolley bus (%)
Means of transportation to work - Streetcar or trolley car (%)
Means of transportation to work - Subway or elevated (%)
Means of transportation to work - Railroad (%)
Means of transportation to work - Ferryboat (%)
Means of transportation to work - Taxicab (%)
Means of transportation to work - Motorcycle (%)
Means of transportation to work - Bicycle (%)
Means of transportation to work - Walked (%)
Means of transportation to work - Other means (%)
Working at home (%)
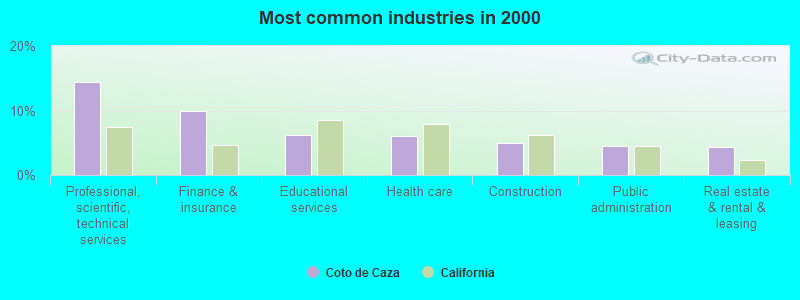
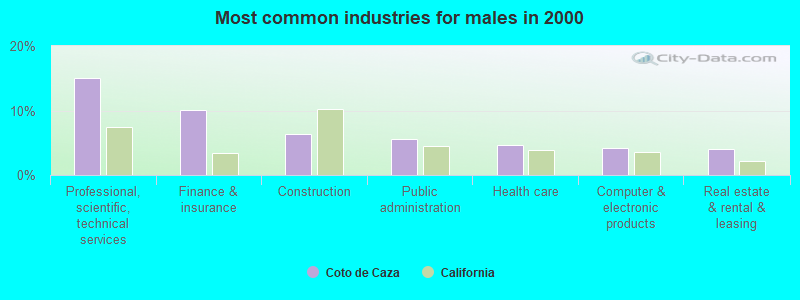
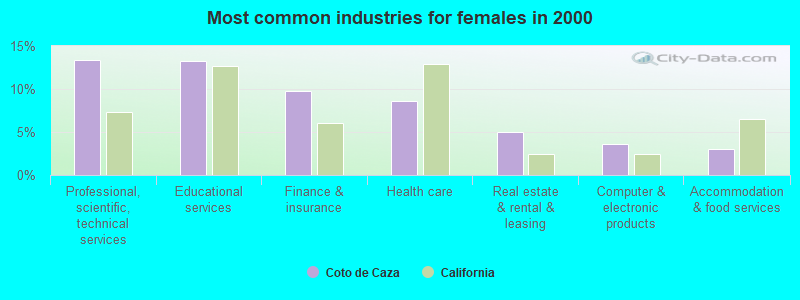
Industry diversity
Most Common Industries - Agriculture, forestry, fishing and hunting, and mining (%)
Most Common Industries - Agriculture, forestry, fishing and hunting (%)
Most Common Industries - Mining, quarrying, and oil and gas extraction (%)
Most Common Industries - Construction (%)
Most Common Industries - Manufacturing (%)
Most Common Industries - Wholesale trade (%)
Most Common Industries - Retail trade (%)
Most Common Industries - Transportation and warehousing, and utilities (%)
Most Common Industries - Transportation and warehousing (%)
Most Common Industries - Utilities (%)
Most Common Industries - Information (%)
Most Common Industries - Finance and insurance, and real estate and rental and leasing (%)
Most Common Industries - Finance and insurance (%)
Most Common Industries - Real estate and rental and leasing (%)
Most Common Industries - Professional, scientific, and management, and administrative and waste management services (%)
Most Common Industries - Professional, scientific, and technical services (%)
Most Common Industries - Management of companies and enterprises (%)
Most Common Industries - Administrative and support and waste management services (%)
Most Common Industries - Educational services, and health care and social assistance (%)
Most Common Industries - Educational services (%)
Most Common Industries - Health care and social assistance (%)
Most Common Industries - Arts, entertainment, and recreation, and accommodation and food services (%)
Most Common Industries - Arts, entertainment, and recreation (%)
Most Common Industries - Accommodation and food services (%)
Most Common Industries - Other services, except public administration (%)
Most Common Industries - Public administration (%)
Occupation diversity
Most Common Occupations - Management, business, science, and arts occupations (%)
Most Common Occupations - Management, business, and financial occupations (%)
Most Common Occupations - Management occupations (%)
Most Common Occupations - Business and financial operations occupations (%)
Most Common Occupations - Computer, engineering, and science occupations (%)
Most Common Occupations - Computer and mathematical occupations (%)
Most Common Occupations - Architecture and engineering occupations (%)
Most Common Occupations - Life, physical, and social science occupations (%)
Most Common Occupations - Education, legal, community service, arts, and media occupations (%)
Most Common Occupations - Community and social service occupations (%)
Most Common Occupations - Legal occupations (%)
Most Common Occupations - Education, training, and library occupations (%)
Most Common Occupations - Arts, design, entertainment, sports, and media occupations (%)
Most Common Occupations - Healthcare practitioners and technical occupations (%)
Most Common Occupations - Health diagnosing and treating practitioners and other technical occupations (%)
Most Common Occupations - Health technologists and technicians (%)
Most Common Occupations - Service occupations (%)
Most Common Occupations - Healthcare support occupations (%)
Most Common Occupations - Protective service occupations (%)
Most Common Occupations - Fire fighting and prevention, and other protective service workers including supervisors (%)
Most Common Occupations - Law enforcement workers including supervisors (%)
Most Common Occupations - Food preparation and serving related occupations (%)
Most Common Occupations - Building and grounds cleaning and maintenance occupations (%)
Most Common Occupations - Personal care and service occupations (%)
Most Common Occupations - Sales and office occupations (%)
Most Common Occupations - Sales and related occupations (%)
Most Common Occupations - Office and administrative support occupations (%)
Most Common Occupations - Natural resources, construction, and maintenance occupations (%)
Most Common Occupations - Farming, fishing, and forestry occupations (%)
Most Common Occupations - Construction and extraction occupations (%)
Most Common Occupations - Installation, maintenance, and repair occupations (%)
Most Common Occupations - Production, transportation, and material moving occupations (%)
Most Common Occupations - Production occupations (%)
Most Common Occupations - Transportation occupations (%)
Most Common Occupations - Material moving occupations (%)
People in Group quarters - Institutionalized population (%)
People in Group quarters - Correctional institutions (%)
People in Group quarters - Federal prisons and detention centers (%)
People in Group quarters - Halfway houses (%)
People in Group quarters - Local jails and other confinement facilities (including police lockups) (%)
People in Group quarters - Military disciplinary barracks (%)
People in Group quarters - State prisons (%)
People in Group quarters - Other types of correctional institutions (%)
People in Group quarters - Nursing homes (%)
People in Group quarters - Hospitals/wards, hospices, and schools for the handicapped (%)
People in Group quarters - Hospitals/wards and hospices for chronically ill (%)
People in Group quarters - Hospices or homes for chronically ill (%)
People in Group quarters - Military hospitals or wards for chronically ill (%)
People in Group quarters - Other hospitals or wards for chronically ill (%)
People in Group quarters - Hospitals or wards for drug/alcohol abuse (%)
People in Group quarters - Mental (Psychiatric) hospitals or wards (%)
People in Group quarters - Schools, hospitals, or wards for the mentally retarded (%)
People in Group quarters - Schools, hospitals, or wards for the physically handicapped (%)
People in Group quarters - Institutions for the deaf (%)
People in Group quarters - Institutions for the blind (%)
People in Group quarters - Orthopedic wards and institutions for the physically handicapped (%)
People in Group quarters - Wards in general hospitals for patients who have no usual home elsewhere (%)
People in Group quarters - Wards in military hospitals for patients who have no usual home elsewhere (%)
People in Group quarters - Juvenile institutions (%)
People in Group quarters - Long-term care (%)
People in Group quarters - Homes for abused, dependent, and neglected children (%)
People in Group quarters - Residential treatment centers for emotionally disturbed children (%)
People in Group quarters - Training schools for juvenile delinquents (%)
People in Group quarters - Short-term care, detention or diagnostic centers for delinquent children (%)
People in Group quarters - Type of juvenile institution unknown (%)
People in Group quarters - Noninstitutionalized population (%)
People in Group quarters - College dormitories (includes college quarters off campus) (%)
People in Group quarters - Military quarters (%)
People in Group quarters - On base (%)
People in Group quarters - Barracks, unaccompanied personnel housing (UPH), (Enlisted/Officer), ;and similar group living quarters for military personnel (%)
People in Group quarters - Transient quarters for temporary residents (%)
People in Group quarters - Military ships (%)
People in Group quarters - Group homes (%)
People in Group quarters - Homes or halfway houses for drug/alcohol abuse (%)
People in Group quarters - Homes for the mentally ill (%)
People in Group quarters - Homes for the mentally retarded (%)
People in Group quarters - Homes for the physically handicapped (%)
People in Group quarters - Other group homes (%)
People in Group quarters - Religious group quarters (%)
People in Group quarters - Dormitories (%)
People in Group quarters - Agriculture workers' dormitories on farms (%)
People in Group quarters - Job Corps and vocational training facilities (%)
People in Group quarters - Other workers' dormitories (%)
People in Group quarters - Crews of maritime vessels (%)
People in Group quarters - Other nonhousehold living situations (%)
People in Group quarters - Other noninstitutional group quarters (%)
Residents speaking English at home (%)
Residents speaking English at home - Born in the United States (%)
Residents speaking English at home - Native, born elsewhere (%)
Residents speaking English at home - Foreign born (%)
Residents speaking Spanish at home (%)
Residents speaking Spanish at home - Born in the United States (%)
Residents speaking Spanish at home - Native, born elsewhere (%)
Residents speaking Spanish at home - Foreign born (%)
Residents speaking other language at home (%)
Residents speaking other language at home - Born in the United States (%)
Residents speaking other language at home - Native, born elsewhere (%)
Residents speaking other language at home - Foreign born (%)
Class of Workers - Employee of private company (%)
Class of Workers - Self-employed in own incorporated business (%)
Class of Workers - Private not-for-profit wage and salary workers (%)
Class of Workers - Local government workers (%)
Class of Workers - State government workers (%)
Class of Workers - Federal government workers (%)
Class of Workers - Self-employed workers in own not incorporated business and Unpaid family workers (%)
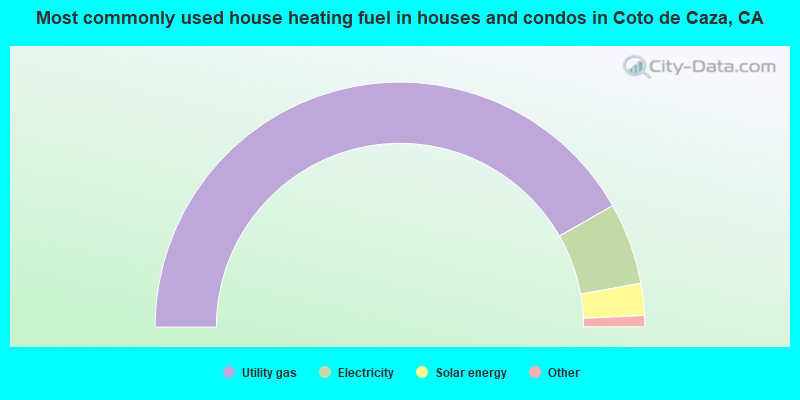
House heating fuel used in houses and condos - Utility gas (%)
House heating fuel used in houses and condos - Bottled, tank, or LP gas (%)
House heating fuel used in houses and condos - Electricity (%)
House heating fuel used in houses and condos - Fuel oil, kerosene, etc. (%)
House heating fuel used in houses and condos - Coal or coke (%)
House heating fuel used in houses and condos - Wood (%)
House heating fuel used in houses and condos - Solar energy (%)
House heating fuel used in houses and condos - Other fuel (%)
House heating fuel used in houses and condos - No fuel used (%)
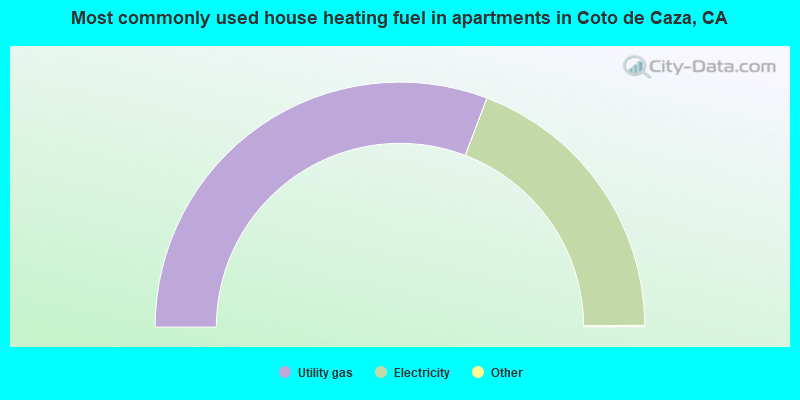
House heating fuel used in apartments - Utility gas (%)
House heating fuel used in apartments - Bottled, tank, or LP gas (%)
House heating fuel used in apartments - Electricity (%)
House heating fuel used in apartments - Fuel oil, kerosene, etc. (%)
House heating fuel used in apartments - Coal or coke (%)
House heating fuel used in apartments - Wood (%)
House heating fuel used in apartments - Solar energy (%)
House heating fuel used in apartments - Other fuel (%)
House heating fuel used in apartments - No fuel used (%)
Armed forces status - In Armed Forces (%)
Armed forces status - Civilian (%)
Armed forces status - Civilian - Veteran (%)
Armed forces status - Civilian - Nonveteran (%)
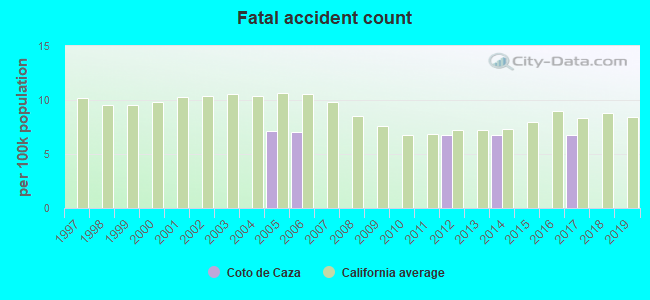
Fatal accidents locations in years 2005-2021
Fatal accidents locations in 2005
Fatal accidents locations in 2006
Fatal accidents locations in 2007
Fatal accidents locations in 2008
Fatal accidents locations in 2009
Fatal accidents locations in 2010
Fatal accidents locations in 2011
Fatal accidents locations in 2012
Fatal accidents locations in 2013
Fatal accidents locations in 2014
Fatal accidents locations in 2015
Fatal accidents locations in 2016
Fatal accidents locations in 2017
Fatal accidents locations in 2018
Fatal accidents locations in 2019
Fatal accidents locations in 2020
Fatal accidents locations in 2021
Alcohol use - People drinking some alcohol every month (%)
Alcohol use - People not drinking at all (%)
Alcohol use - Average days/month drinking alcohol
Alcohol use - Average drinks/week
Alcohol use - Average days/year people drink much
Audiometry - Average condition of hearing (%)
Audiometry - People that can hear a whisper from across a quiet room (%)
Audiometry - People that can hear normal voice from across a quiet room (%)
Audiometry - Ears ringing, roaring, buzzing (%)
Audiometry - Had a job exposure to loud noise (%)
Audiometry - Had off-work exposure to loud noise (%)
Blood Pressure & Cholesterol - Has high blood pressure (%)
Blood Pressure & Cholesterol - Checking blood pressure at home (%)
Blood Pressure & Cholesterol - Frequently checking blood cholesterol (%)
Blood Pressure & Cholesterol - Has high cholesterol level (%)
Consumer Behavior - Money monthly spent on food at supermarket/grocery store
Consumer Behavior - Money monthly spent on food at other stores
Consumer Behavior - Money monthly spent on eating out
Consumer Behavior - Money monthly spent on carryout/delivered foods
Consumer Behavior - Income spent on food at supermarket/grocery store (%)
Consumer Behavior - Income spent on food at other stores (%)
Consumer Behavior - Income spent on eating out (%)
Consumer Behavior - Income spent on carryout/delivered foods (%)
Current Health Status - General health condition (%)
Current Health Status - Blood donors (%)
Current Health Status - Has blood ever tested for HIV virus (%)
Current Health Status - Left-handed people (%)
Dermatology - People using sunscreen (%)
Diabetes - Diabetics (%)
Diabetes - Had a blood test for high blood sugar (%)
Diabetes - People taking insulin (%)
Diet Behavior & Nutrition - Diet health (%)
Diet Behavior & Nutrition - Milk product consumption (# of products/month)
Diet Behavior & Nutrition - Meals not home prepared (#/week)
Diet Behavior & Nutrition - Meals from fast food or pizza place (#/week)
Diet Behavior & Nutrition - Ready-to-eat foods (#/month)
Diet Behavior & Nutrition - Frozen meals/pizza (#/month)
Drug Use - People that ever used marijuana or hashish (%)
Drug Use - Ever used hard drugs (%)
Drug Use - Ever used any form of cocaine (%)
Drug Use - Ever used heroin (%)
Drug Use - Ever used methamphetamine (%)
Health Insurance - People covered by health insurance (%)
Kidney Conditions-Urology - Avg. # of times urinating at night
Medical Conditions - People with asthma (%)
Medical Conditions - People with anemia (%)
Medical Conditions - People with psoriasis (%)
Medical Conditions - People with overweight (%)
Medical Conditions - Elderly people having difficulties in thinking or remembering (%)
Medical Conditions - People who ever received blood transfusion (%)
Medical Conditions - People having trouble seeing even with glass/contacts (%)
Medical Conditions - People with arthritis (%)
Medical Conditions - People with gout (%)
Medical Conditions - People with congestive heart failure (%)
Medical Conditions - People with coronary heart disease (%)
Medical Conditions - People with angina pectoris (%)
Medical Conditions - People who ever had heart attack (%)
Medical Conditions - People who ever had stroke (%)
Medical Conditions - People with emphysema (%)
Medical Conditions - People with thyroid problem (%)
Medical Conditions - People with chronic bronchitis (%)
Medical Conditions - People with any liver condition (%)
Medical Conditions - People who ever had cancer or malignancy (%)
Mental Health - People who have little interest in doing things (%)
Mental Health - People feeling down, depressed, or hopeless (%)
Mental Health - People who have trouble sleeping or sleeping too much (%)
Mental Health - People feeling tired or having little energy (%)
Mental Health - People with poor appetite or overeating (%)
Mental Health - People feeling bad about themself (%)
Mental Health - People who have trouble concentrating on things (%)
Mental Health - People moving or speaking slowly or too fast (%)
Mental Health - People having thoughts they would be better off dead (%)
Oral Health - Average years since last visit a dentist
Oral Health - People embarrassed because of mouth (%)
Oral Health - People with gum disease (%)
Oral Health - General health of teeth and gums (%)
Oral Health - Average days a week using dental floss/device
Oral Health - Average days a week using mouthwash for dental problem
Oral Health - Average number of teeth
Pesticide Use - Households using pesticides to control insects (%)
Pesticide Use - Households using pesticides to kill weeds (%)
Physical Activity - People doing vigorous-intensity work activities (%)
Physical Activity - People doing moderate-intensity work activities (%)
Physical Activity - People walking or bicycling (%)
Physical Activity - People doing vigorous-intensity recreational activities (%)
Physical Activity - People doing moderate-intensity recreational activities (%)
Physical Activity - Average hours a day doing sedentary activities
Physical Activity - Average hours a day watching TV or videos
Physical Activity - Average hours a day using computer
Physical Functioning - People having limitations keeping them from working (%)
Physical Functioning - People limited in amount of work they can do (%)
Physical Functioning - People that need special equipment to walk (%)
Physical Functioning - People experiencing confusion/memory problems (%)
Physical Functioning - People requiring special healthcare equipment (%)
Prescription Medications - Average number of prescription medicines taking
Preventive Aspirin Use - Adults 40+ taking low-dose aspirin (%)
Reproductive Health - Vaginal deliveries (%)
Reproductive Health - Cesarean deliveries (%)
Reproductive Health - Deliveries resulted in a live birth (%)
Reproductive Health - Pregnancies resulted in a delivery (%)
Reproductive Health - Women breastfeeding newborns (%)
Reproductive Health - Women that had a hysterectomy (%)
Reproductive Health - Women that had both ovaries removed (%)
Reproductive Health - Women that have ever taken birth control pills (%)
Reproductive Health - Women taking birth control pills (%)
Reproductive Health - Women that have ever used Depo-Provera or injectables (%)
Reproductive Health - Women that have ever used female hormones (%)
Sexual Behavior - People 18+ that ever had sex (vaginal, anal, or oral) (%)
Sexual Behavior - Males 18+ that ever had vaginal sex with a woman (%)
Sexual Behavior - Males 18+ that ever performed oral sex on a woman (%)
Sexual Behavior - Males 18+ that ever had anal sex with a woman (%)
Sexual Behavior - Males 18+ that ever had any sex with a man (%)
Sexual Behavior - Females 18+ that ever had vaginal sex with a man (%)
Sexual Behavior - Females 18+ that ever performed oral sex on a man (%)
Sexual Behavior - Females 18+ that ever had anal sex with a man (%)
Sexual Behavior - Females 18+ that ever had any kind of sex with a woman (%)
Sexual Behavior - Average age people first had sex
Sexual Behavior - Average number of female sex partners in lifetime (males 18+)
Sexual Behavior - Average number of female vaginal sex partners in lifetime (males 18+)
Sexual Behavior - Average age people first performed oral sex on a woman (18+)
Sexual Behavior - Average number of woman performed oral sex on in lifetime (18+)
Sexual Behavior - Average number of male sex partners in lifetime (males 18+)
Sexual Behavior - Average number of male anal sex partners in lifetime (males 18+)
Sexual Behavior - Average age people first performed oral sex on a man (18+)
Sexual Behavior - Average number of male oral sex partners in lifetime (18+)
Sexual Behavior - People using protection when performing oral sex (%)
Sexual Behavior - Average number of times people have vaginal or anal sex a year
Sexual Behavior - People having sex without condom (%)
Sexual Behavior - Average number of male sex partners in lifetime (females 18+)
Sexual Behavior - Average number of male vaginal sex partners in lifetime (females 18+)
Sexual Behavior - Average number of female sex partners in lifetime (females 18+)
Sexual Behavior - Circumcised males 18+ (%)
Sleep Disorders - Average hours sleeping at night
Sleep Disorders - People that has trouble sleeping (%)
Smoking-Cigarette Use - People smoking cigarettes (%)
Taste & Smell - People 40+ having problems with smell (%)
Taste & Smell - People 40+ having problems with taste (%)
Taste & Smell - People 40+ that ever had wisdom teeth removed (%)
Taste & Smell - People 40+ that ever had tonsils teeth removed (%)
Taste & Smell - People 40+ that ever had a loss of consciousness because of a head injury (%)
Taste & Smell - People 40+ that ever had a broken nose or other serious injury to face or skull (%)
Taste & Smell - People 40+ that ever had two or more sinus infections (%)
Weight - Average height (inches)
Weight - Average weight (pounds)
Weight - Average BMI
Weight - People that are obese (%)
Weight - People that ever were obese (%)
Weight - People trying to lose weight (%)
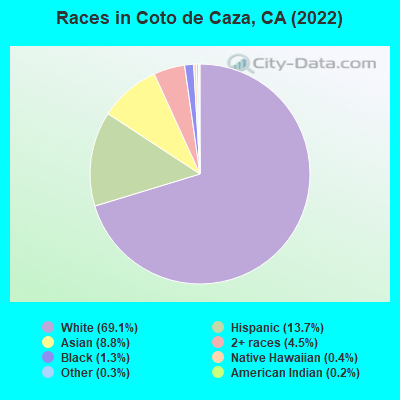
10,713 69.1% White alone 2,119 13.7% Hispanic 1,365 8.8% Asian alone 704 4.5% Two or more races 206 1.3% Black alone 64 0.4% Native Hawaiian and Other 46 0.3% Other race alone 30 0.2% American Indian alone
According to our research of California and other state lists, there were 2 registered sex offenders living in Coto de Caza, California as of April 27, 2024 . The ratio of all residents to sex offenders in Coto de Caza is 7,518 to 1.The ratio of registered sex offenders to all residents in this city is much lower than the state average.
Latest news from Coto de Caza, CA collected exclusively by city-data.com from local newspapers, TV, and radio stations
Ancestries: English (9.0%), Irish (6.3%), German (6.0%), Italian (4.8%), European (4.3%), American (2.8%).
Current Local Time:
Land area: 7.89 square miles.
Population density: 1,884 people per square mile (low).
1,882 residents are foreign born (6.0% Asia , 2.4% Europe , 1.5% Latin America ).
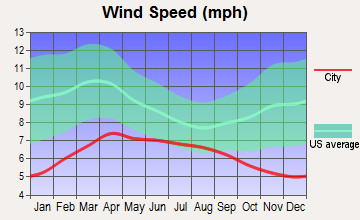
This place:
12.1%California:
26.5%
Median real estate property taxes paid for housing units with mortgages in 2022: $10,194 (0.7%)Median real estate property taxes paid for housing units with no mortgage in 2022: $10,255 (0.7%)
Nearest city with pop. 50,000+: Trabuco, CA (2.6 miles
Nearest city with pop. 200,000+: South Coast, CA (8.3 miles
Nearest city with pop. 1,000,000+: Los Angeles, CA
Nearest cities:
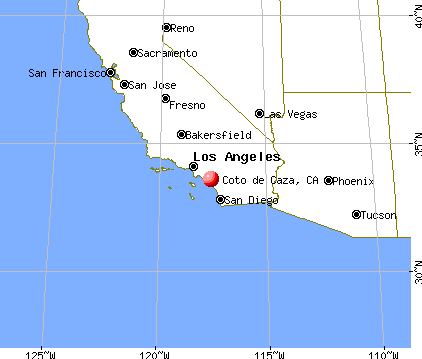
Latitude: 33.60 N, Longitude: 117.59 W
Daytime population change due to commuting: -5,038 (-32.5%)Workers who live and work in this place: 2,778 (34.2%)
Area code commonly used in this area: 949
Unemployment in December 2023:
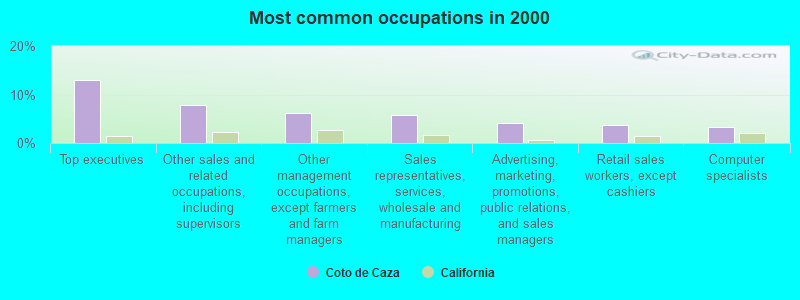
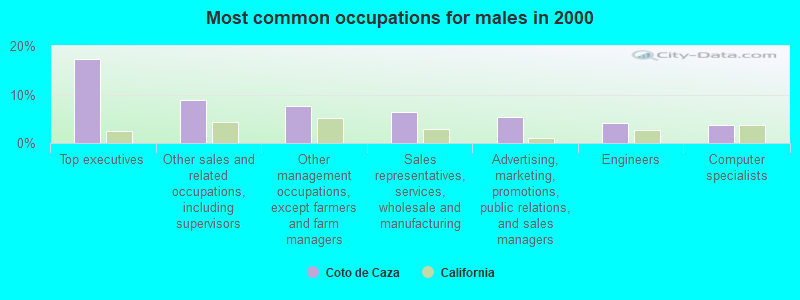
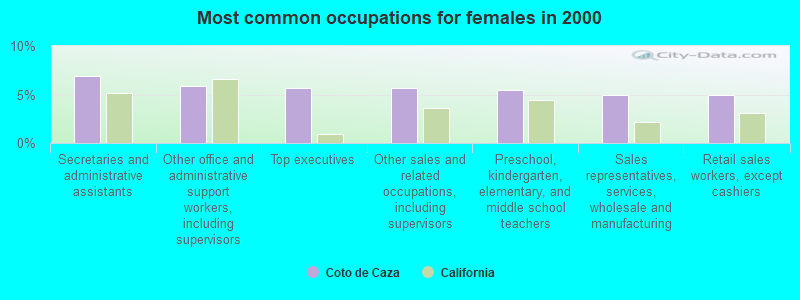
Most common occupations in Coto de Caza, CA (%)
Both Males Females
Top executives (13.1%)
Other sales and related occupations, including supervisors (7.8%)
Other management occupations, except farmers and farm managers (6.1%)
Sales representatives, services, wholesale and manufacturing (5.9%)
Advertising, marketing, promotions, public relations, and sales managers (4.2%)
Retail sales workers, except cashiers (3.7%)
Computer specialists (3.2%)
Top executives (17.3%)
Other sales and related occupations, including supervisors (9.0%)
Other management occupations, except farmers and farm managers (7.7%)
Sales representatives, services, wholesale and manufacturing (6.4%)
Advertising, marketing, promotions, public relations, and sales managers (5.3%)
Engineers (4.2%)
Computer specialists (3.7%)
Secretaries and administrative assistants (6.9%)
Other office and administrative support workers, including supervisors (5.9%)
Top executives (5.7%)
Other sales and related occupations, including supervisors (5.7%)
Preschool, kindergarten, elementary, and middle school teachers (5.5%)
Sales representatives, services, wholesale and manufacturing (5.0%)
Retail sales workers, except cashiers (4.9%)
Earthquake activity:
Coto de Caza-area historical earthquake activity is significantly above California state average. It is 6770% greater than the overall U.S. average. On 6/28/1992 at 11:57:34, a magnitude 7.6 (6.2 MB, 7.6 MS, 7.3 MW, Depth: 0.7 mi, Class: Major, Intensity: VIII - XII) earthquake occurred 73.0 miles away from the city center, causing 3 deaths ( 1 shaking deaths, 2 other deaths) and 400 injuries, causing $100,000,000 total damage and $40,000,000 insured lossesOn 7/21/1952 at 11:52:14, a magnitude 7.7 (7.7 UK) earthquake occurred 126.3 miles away from Coto de Caza center, causing $50,000,000 total damage On 10/16/1999 at 09:46:44, a magnitude 7.4 (6.3 MB, 7.4 MS, 7.2 MW, 7.3 ML) earthquake occurred 91.7 miles away from the city center On 5/19/1940 at 04:36:40, a magnitude 7.2 (7.2 UK) earthquake occurred 112.2 miles away from the city center, causing $33,000,000 total damage On 4/21/1918 at 22:32:30, a magnitude 6.8 (6.8 UK, Class: Strong, Intensity: VII - IX) earthquake occurred 17.2 miles away from Coto de Caza center On 6/28/1992 at 15:05:30, a magnitude 6.9 (6.3 MB, 6.7 MS, 6.5 MW, 6.9 ME, Depth: 3.1 mi) earthquake occurred 65.2 miles away from the city center Magnitude types: body-wave magnitude (MB), energy magnitude (ME), local magnitude (ML), surface-wave magnitude (MS), moment magnitude (MW) Natural disasters: The number of natural disasters in Orange County (32) is a lot greater than the US average (15).Major Disasters (Presidential) Declared: 22Emergencies Declared: 2Floods: 15, Fires: 13, Storms: 9, Landslides: 6, Winter Storms: 6, Mudslides: 5, Earthquakes: 2, Heavy Rain: 1, Hurricane: 1, Snow: 1, Tornado: 1, Wind: 1, Other: 1 (Note: some incidents may be assigned to more than one category). Hospitals and medical centers near Coto de Caza: ACCENTCARE HOME HEALTH OF ORANGE COUNTY, INC (Home Health Center, about 3 miles away; RANCHO SANTA MARGARI, CA)
CAMPINA HOME (Hospital, about 5 miles away; MISSION VIEJO, CA)
GOOD SHEPHERD - PAPAGAYO (Hospital, about 5 miles away; MISSION VIEJO, CA)
MISSION VIEJO DIALYSIS (Dialysis Facility, about 5 miles away; MISSION VIEJO, CA)
CORONEL HOME (Hospital, about 5 miles away; MISSION VIEJO, CA)
WIN HEALTH CARE SERVICES INC (Home Health Center, about 6 miles away; MISSION VIEJO, CA)
QUALITY CARE HOME (Hospital, about 6 miles away; MISSION VIEJO, CA)
Amtrak stations near Coto de Caza: 8 miles: SAN JUAN CAPISTRANO (LEE HALL, MONTEREY AVE. & SAN GORGONIO WAY) Services: ticket office, fully wheelchair accessible, enclosed waiting area, public restrooms, public payphones, full-service food facilities, paid short-term parking, paid long-term parking, call for taxi service, intercity bus service, public transit connection.
12 miles: IRVINE (15215 BARRANCA PKWY.) Services: ticket office, fully wheelchair accessible, enclosed waiting area, public restrooms, public payphones, snack bar, free short-term parking, free long-term parking, call for taxi service, intercity bus service, public transit connection.
12 miles: LAGUNA BEACH (TRANSIT DEPOT, BROADWAY BTW. BEACH & FOR) - Bus Station Operable nuclear power plants near Coto de Caza:
12 miles: San Onofre 2 and 3 in San Clemente, CA.
Colleges/universities with over 2000 students nearest to Coto de Caza:
Saddleback College (about 6 miles; Mission Viejo, CA ; Full-time enrollment: 13,716)
Brandman University (about 12 miles; Irvine, CA ; FT enrollment: 6,027)
Irvine Valley College (about 13 miles; Irvine, CA ; FT enrollment: 8,005)
Concordia University-Irvine (about 14 miles; Irvine, CA ; FT enrollment: 3,284)
University of California-Irvine (about 16 miles; Irvine, CA ; FT enrollment: 28,587)
Coastline Community College (about 16 miles; Fountain Valley, CA ; FT enrollment: 4,591)
Santiago Canyon College (about 18 miles; Orange, CA ; FT enrollment: 6,050)
Public elementary/middle school in Coto de Caza:
See full list of schools located in Coto de Caza Birthplace of: Erik Hamren (baseball) - Baseball player.
Orange County has a predicted average indoor radon screening level less than 2 pCi/L (pico curies per liter) - Low Potential Average household size: This place:
3.1 peopleCalifornia:
2.9 people
Percentage of family households: This place:
88.5%Whole state:
68.7%
Percentage of households with unmarried partners: This place:
2.7%Whole state:
7.2%
Likely homosexual households (counted as self-reported same-sex unmarried-partner households)
Lesbian couples: 0.3% of all households Gay men: 0.3% of all households
For population 15 years and over in Coto de Caza:
Never married: 27.0%Now married: 64.5%Separated: 0.5%Widowed: 2.1%Divorced: 5.9% For population 25 years and over in Coto de Caza:
High school or higher: 98.4%Bachelor's degree or higher: 66.1%Graduate or professional degree: 28.7%Unemployed: 2.0%Mean travel time to work (commute): 21.6 minutes
Education Gini index (Inequality in education) Here:
9.0California average:
15.5
Religion statistics for Coto de Caza, CA (based on Orange County data)
Religion Adherents Congregations Catholic 797,473 67 Evangelical Protestant 345,893 894 Other 141,815 329 Mainline Protestant 76,574 202 Orthodox 13,406 19 Black Protestant 2,424 8 None 1,632,647 -
Source: Clifford Grammich, Kirk Hadaway, Richard Houseal, Dale E.Jones, Alexei Krindatch, Richie Stanley and Richard H.Taylor. 2012. 2010 U.S.Religion Census: Religious Congregations & Membership Study. Association of Statisticians of American Religious Bodies. Jones, Dale E., et al. 2002. Congregations and Membership in the United States 2000. Nashville, TN: Glenmary Research Center. Graphs represent county-level data
Food Environment Statistics: Number of grocery stores : 530Orange County :
1.78 / 10,000 pop.State :
2.14 / 10,000 pop.
Number of supercenters and club stores : 18Orange County :
0.06 / 10,000 pop.California :
0.04 / 10,000 pop.
Number of convenience stores (no gas) : 147Here :
0.49 / 10,000 pop.State :
0.62 / 10,000 pop.
Number of convenience stores (with gas) : 434This county :
1.46 / 10,000 pop.State :
1.49 / 10,000 pop.
Number of full-service restaurants : 2,438Orange County :
8.19 / 10,000 pop.California :
7.42 / 10,000 pop.
Adult diabetes rate : Orange County :
6.3%California :
7.3%
Adult obesity rate : Orange County :
18.5%State :
21.3%
Low-income preschool obesity rate : Orange County :
16.4%California :
17.9%
Health and Nutrition: Healthy diet rate : This city:
56.2%California:
49.4%
Average overall health of teeth and gums : Coto de Caza:
57.3%State:
48.0%
Average BMI : Coto de Caza:
27.8California:
28.1
People feeling badly about themselves : This city:
19.9%California:
20.2%
People not drinking alcohol at all : Coto de Caza:
8.2%California:
11.2%
Average hours sleeping at night : Overweight people : This city:
32.9%California:
31.5%
General health condition : This city:
63.3%California:
56.4%
Average condition of hearing : Coto de Caza:
83.2%State:
80.9%
More about Health and Nutrition of Coto de Caza, CA Residents
4.86% of this county's 2021 resident taxpayers lived in other counties in 2020 ($95,983 average adjusted gross income )
Here:
4.86%California average:
5.19%
0.01% of residents moved from foreign countries ($132 average AGI )Orange County:
0.01%California average:
0.03%
Top counties from which taxpayers relocated into this county between 2020 and 2021:
5.71% of this county's 2020 resident taxpayers moved to other counties in 2021 ($106,828 average adjusted gross income )
Here:
5.71%California average:
6.14%
0.01% of residents moved to foreign countries ($180 average AGI )Orange County:
0.01%California average:
0.02%
Top counties to which taxpayers relocated from this county between 2020 and 2021: Businesses in Coto de Caza, CA
Strongest AM radio stations in Coto de Caza:
KPLS (830 AM; 50 kW; ORANGE, CA; Owner: CRN LICENSES, LLC)
KFI (640 AM; 50 kW; LOS ANGELES, CA; Owner: CAPSTAR TX LIMITED PARTNERSHIP)
KLAC (570 AM; 50 kW; LOS ANGELES, CA; Owner: AMFM RADIO LICENSES, L.L.C.)
KTNQ (1020 AM; 50 kW; LOS ANGELES, CA; Owner: KTNQ-AM LICENSE CORP.)
KXTA (1150 AM; 50 kW; LOS ANGELES, CA; Owner: CITICASTERS LICENSES, L.P.)
KDIS (1110 AM; 50 kW; PASADENA, CA; Owner: ABC,INC.)
KFWB (980 AM; 50 kW; LOS ANGELES, CA; Owner: INFINITY BROADCASTING OPERATIONS, INC.)
KNX (1070 AM; 50 kW; LOS ANGELES, CA; Owner: INFINITY BROADCASTING OPERATIONS, INC.)
KSPN (710 AM; 50 kW; LOS ANGELES, CA; Owner: KABC-AM RADIO, INC.)
KFMB (760 AM; 50 kW; SAN DIEGO, CA; Owner: MIDWEST TELEVISION, INC.)
KMPC (1540 AM; 50 kW; LOS ANGELES, CA; Owner: ROSE CITY RADIO CORPORATION)
KBLA (1580 AM; 50 kW; SANTA MONICA, CA)
KCBQ (1170 AM; 50 kW; SAN DIEGO, CA; Owner: RADIO 1210, INC.)
Strongest FM radio stations in Coto de Caza:
KWVE (107.9 FM; SAN CLEMENTE, CA; Owner: CALVARY CHAPEL OF COSTA MESA)
KSBR (88.5 FM; MISSION VIEJO, CA; Owner: SADDLEBACK COMMUNITY COLLEGE DIST.)
KRTM (88.9 FM; TEMECULA, CA; Owner: PENFOLD COMMUNICATIONS, INC.)
KLRD (90.1 FM; YUCAIPA, CA; Owner: EDUCATIONAL MEDIA FOUNDATION)
KUOR-FM (89.1 FM; REDLANDS, CA; Owner: UNIVERSITY OF REDLANDS)
KCBS-FM (93.1 FM; LOS ANGELES, CA; Owner: INFINITY BROADCASTING OPERATIONS, INC.)
KDLE (103.1 FM; NEWPORT BEACH, CA; Owner: ENTRAVISION HOLDINGS, LLC.)
KOLA (99.9 FM; SAN BERNARDINO, CA; Owner: INLAND EMPIRE BROADCASTING CORP.)
KUCR (88.3 FM; RIVERSIDE, CA; Owner: THE REGENTS OF THE UNIV. OF CA)
KVCR (91.9 FM; SAN BERNARDINO, CA; Owner: SAN BERNARDINO COMMUNITY COLLEGE DISTRICT)
KSCA (101.9 FM; GLENDALE, CA; Owner: HBC LICENSE CORPORATION)
KLOS (95.5 FM; LOS ANGELES, CA; Owner: KLOS-FM RADIO, INC.)
K212FA (90.3 FM; TEMPLE CITY, CA; Owner: EDUCATIONAL MEDIA FOUNDATION)
KOST (103.5 FM; LOS ANGELES, CA; Owner: CAPSTAR TX LIMITED PARTNERSHIP)
KZLA-FM (93.9 FM; LOS ANGELES, CA; Owner: EMMIS RADIO LICENSE CORPORATION)
KLVE (107.5 FM; LOS ANGELES, CA; Owner: KLVE-FM LICENSE CORP.)
KIIS-FM (102.7 FM; LOS ANGELES, CA; Owner: CITICASTERS LICENSES, L.P.)
KPWR (105.9 FM; LOS ANGELES, CA; Owner: EMMIS RADIO LICENSE CORPORATION)
KPCC (89.3 FM; PASADENA, CA; Owner: PASADENA AREA COMMUNITY COLLEGE DISTRICT)
KLSX (97.1 FM; LOS ANGELES, CA; Owner: INFINITY BROADCASTING OPERATIONS, INC.)
TV broadcast stations around Coto de Caza:
KTRO-LP (Channel 50; LANCASTER, CA; Owner: ROBERT D. ADELMAN)
Coto de Caza fatal accident list:
Dec 18, 2017 11:15 AM, Oso Pkwy, Lat: 33.580889, Lon: -117.593181, Vehicles: 3, Persons: 3, Fatalities: 1Lat: 33.608828, Lon: -117.581219, Vehicles: 1, Persons: 1, Fatalities: 1, Drunk persons involved: 1Lat: 33.582131, Lon: -117.593211, Vehicles: 1, Persons: 1, Fatalities: 1, Drunk persons involved: 1Lat: 33.606440, Lon: -117.580970, Vehicles: 1, Persons: 2, Pedestrians: 1, Fatalities: 1Lat: 33.621550, Lon: -117.587310, Vehicles: 1, Persons: 1, Fatalities: 1
National Bridge Inventory (NBI) Statistics 2 Number of bridges26ft / 7.7m Total length600 Total average daily traffic10 Total average daily truck traffic
FCC Registered Private Land Mobile Towers: 1
25031 Panaramo (Lat: 33.598333 Lon: -117.594444), Type: Tank, Structure height: 13.7 m, Call Sign: WPSW953, Assigned Frequencies: 862.312 MHz, 862.337 MHz, 862.362 MHz, 862.387 MHz, 862.412 MHz, 862.487 MHz, 862.512 MHz, 862.537 MHz, 862.562 MHz, 862.587 MHz... (+149 more), Grant Date: 07/07/2021, Expiration Date: 08/04/2031, Certifier: Kyle B Entz, Registrant: T-Mobile Usa, Inc., 12920 Se 38th Street, Bellevue, WA 98006, Phone: (425) 383-8401, Email:
FCC Registered Broadcast Land Mobile Towers: 2
Lat: 33.625333 Lon: -117.586667, Call Sign: WQHJ817, Assigned Frequencies: 462.412 MHz, 467.412 MHz, 462.337 MHz, 467.337 MHz, 462.462 MHz, 467.462 MHz, Grant Date: 06/06/2017, Expiration Date: 08/16/2027, Certifier: Dave Flaxbeard, Registrant: Federal License Management, 1784 E. 3rd Street Suite 269, Williamsport, PA 17701-3862, Phone: (866) 908-2220, Fax: (570) 323-4002, Email:
Lat: 33.572500 Lon: -117.576389, Call Sign: WQOA667, Assigned Frequencies: 466.437 MHz, 461.437 MHz, 466.487 MHz, 461.487 MHz, 462.387 MHz, 467.387 MHz, 467.437 MHz, Grant Date: 07/27/2011, Expiration Date: 07/27/2021, Cancellation Date: 10/09/2021, Certifier: Vincentia M Davis, Registrant: Sjm Industrial Radio, 1212 E Imperial Ave, El Segundo, CA 90245, Phone: (310) 640-2700, Fax: (310) 640-1095, Email:
FCC Registered Microwave Towers: 5
COTO DE CAZA, 32154 Violeta Ln (Lat: 33.625833 Lon: -117.571139), Type: Pole, Structure height: 9.1 m, Call Sign: WPOS334, Assigned Frequencies: 19605.0 MHz, Grant Date: 01/27/2009, Expiration Date: 03/08/2019, Cancellation Date: 08/22/2014, Registrant: Verizon Wireless, 1120 Sanctuary Pkwy, #150 Gasa5reg, Alpharetta, GA 30009-7630, Phone: (770) 797-1070, Fax: (770) 797-1036, Email:
LA02339A WR, 25035 Panorama (Lat: 33.598056 Lon: -117.594472), Type: Tower, Structure height: 11.9 m, Call Sign: WPOS904, Assigned Frequencies: 19415.0 MHz, Grant Date: 05/19/2009, Expiration Date: 05/01/2019, Cancellation Date: 07/26/2017, Certifier: Dan Menser, Registrant: T-Mobile License LLC, 12920 Se 38th Street, Bellevue, WA 98006, Phone: (425) 383-4000, Fax: (425) 383-7040, Email:
LA3159, 31987 Violeta Lane (Lat: 33.631278 Lon: -117.573250), Type: Tank, Structure height: 11.9 m, Call Sign: WQJI764, Assigned Frequencies: 17965.0 MHz, 18015.0 MHz, 18065.0 MHz, 18115.0 MHz, Grant Date: 08/28/2018, Expiration Date: 09/23/2028, Certifier: Don Houghton, Registrant: At&t Services, Inc., 208 S Akard St, 20f, Dallas, TX 75202, Phone: (855) 699-7073, Email:
LA02356A, 31995 Violeta Ln (Lat: 33.631250 Lon: -117.573139), Type: Tank, Structure height: 11 m, Call Sign: WQLM566, Assigned Frequencies: 17960.0 MHz, Grant Date: 04/14/2020, Expiration Date: 03/09/2030, Cancellation Date: 03/18/2024, Certifier: Dan Menser, Registrant: T-Mobile Usa, Inc., 12920 Se 38th Street, Bellevue, WA 98006, Phone: (425) 383-8401, Fax: (425) 383-4040, Email:
LifeSoul, 5 Canada Oaks (Lat: 33.599278 Lon: -117.583083), Type: Bant, Structure height: 9.1 m, Call Sign: WROG240, Assigned Frequencies: 19320.0 MHz, 19320.0 MHz, 19320.0 MHz, 19320.0 MHz, 19320.0 MHz, Grant Date: 10/08/2021, Expiration Date: 10/08/2031, Certifier: Ryan Hauf, Registrant: Micronet Communications, Inc., 812 Lexington Dr, Plano, TX 75075, Phone: (972) 422-7200, Email:
FCC Registered Amateur Radio Licenses: 31 (
See the full list of FCC Registered Amateur Radio Licenses in Coto de Caza )
FAA Registered Aircraft: 13 (
See the full list of FAA Registered Aircraft in Coto de Caza )
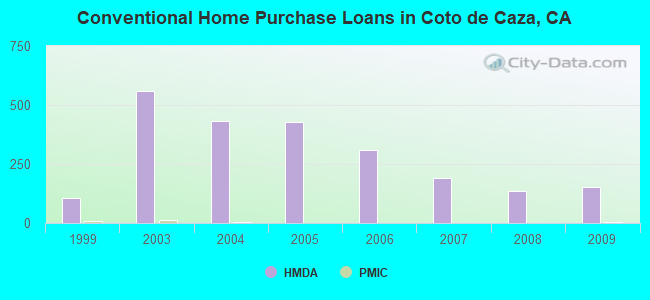
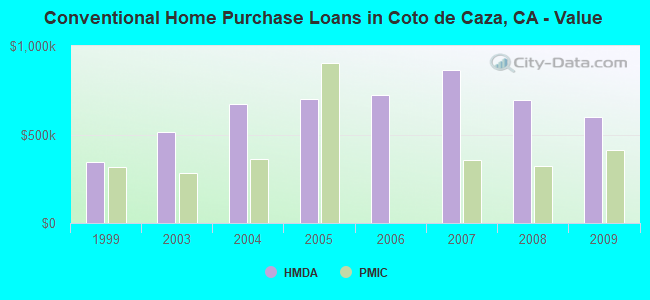
Home Mortgage Disclosure Act Aggregated Statistics For Year 2009(Based on 2 full and 1 partial tracts) A) FHA, FSA/RHS & VA B) Conventional C) Refinancings D) Home Improvement Loans F) Non-occupant Loans on Number Average Value Number Average Value Number Average Value Number Average Value Number Average Value
LOANS ORIGINATED 35 $477,069 153 $597,497 573 $468,545 12 $367,502 15 $350,782 APPLICATIONS APPROVED, NOT ACCEPTED 5 $484,756 18 $612,086 62 $466,233 3 $355,730 3 $344,477 APPLICATIONS DENIED 10 $507,726 24 $635,353 130 $617,566 4 $316,330 8 $365,231 APPLICATIONS WITHDRAWN 3 $391,807 23 $633,595 99 $508,893 2 $513,185 6 $301,910 FILES CLOSED FOR INCOMPLETENESS 0 $0 5 $657,850 28 $519,764 2 $232,105 1 $205,920
Aggregated Statistics For Year 2008(Based on 2 full and 1 partial tracts) A) FHA, FSA/RHS & VA B) Conventional C) Refinancings D) Home Improvement Loans F) Non-occupant Loans on Number Average Value Number Average Value Number Average Value Number Average Value Number Average Value
LOANS ORIGINATED 11 $389,162 134 $693,421 221 $557,170 7 $400,587 13 $971,597 APPLICATIONS APPROVED, NOT ACCEPTED 1 $507,880 36 $746,198 42 $589,715 1 $149,670 3 $487,767 APPLICATIONS DENIED 4 $619,932 34 $746,385 92 $836,488 5 $453,106 3 $2,452,780 APPLICATIONS WITHDRAWN 4 $451,120 32 $868,462 57 $587,395 5 $338,846 4 $1,027,680 FILES CLOSED FOR INCOMPLETENESS 0 $0 4 $1,256,090 18 $577,439 3 $94,447 0 $0
Aggregated Statistics For Year 2007(Based on 2 full and 1 partial tracts) A) FHA, FSA/RHS & VA B) Conventional C) Refinancings D) Home Improvement Loans F) Non-occupant Loans on G) Loans On Manufactured Number Average Value Number Average Value Number Average Value Number Average Value Number Average Value Number Average Value
LOANS ORIGINATED 1 $367,190 192 $862,043 405 $747,929 39 $460,065 27 $711,663 0 $0 APPLICATIONS APPROVED, NOT ACCEPTED 0 $0 46 $744,986 70 $742,469 9 $201,179 4 $442,542 2 $184,925 APPLICATIONS DENIED 1 $294,350 56 $750,057 178 $817,158 14 $767,966 10 $636,703 0 $0 APPLICATIONS WITHDRAWN 0 $0 32 $1,071,845 73 $763,509 9 $225,151 4 $673,202 0 $0 FILES CLOSED FOR INCOMPLETENESS 0 $0 12 $1,064,476 28 $676,916 0 $0 0 $0 0 $0
Aggregated Statistics For Year 2006(Based on 2 full and 1 partial tracts) B) Conventional C) Refinancings D) Home Improvement Loans F) Non-occupant Loans on Number Average Value Number Average Value Number Average Value Number Average Value
LOANS ORIGINATED 310 $721,599 518 $771,327 63 $448,052 43 $696,941 APPLICATIONS APPROVED, NOT ACCEPTED 52 $676,512 99 $717,859 10 $236,865 6 $650,473 APPLICATIONS DENIED 80 $775,322 191 $802,338 29 $400,888 14 $924,951 APPLICATIONS WITHDRAWN 39 $642,190 115 $683,193 13 $370,009 5 $619,070 FILES CLOSED FOR INCOMPLETENESS 15 $682,987 29 $707,885 2 $70,380 0 $0
Aggregated Statistics For Year 2005(Based on 2 full and 1 partial tracts) B) Conventional C) Refinancings D) Home Improvement Loans F) Non-occupant Loans on G) Loans On Manufactured Number Average Value Number Average Value Number Average Value Number Average Value Number Average Value
LOANS ORIGINATED 428 $700,652 668 $682,042 71 $508,934 45 $591,875 2 $78,410 APPLICATIONS APPROVED, NOT ACCEPTED 75 $577,855 85 $667,688 8 $208,962 10 $516,803 0 $0 APPLICATIONS DENIED 79 $687,552 173 $657,668 39 $374,794 10 $574,498 1 $364,320 APPLICATIONS WITHDRAWN 65 $670,538 134 $604,556 23 $409,665 8 $319,188 0 $0 FILES CLOSED FOR INCOMPLETENESS 19 $793,013 44 $683,738 4 $192,028 4 $578,628 0 $0
Aggregated Statistics For Year 2004(Based on 2 full and 1 partial tracts) B) Conventional C) Refinancings D) Home Improvement Loans F) Non-occupant Loans on G) Loans On Manufactured Number Average Value Number Average Value Number Average Value Number Average Value Number Average Value
LOANS ORIGINATED 434 $670,280 1,049 $578,880 68 $420,216 54 $399,770 0 $0 APPLICATIONS APPROVED, NOT ACCEPTED 60 $719,737 137 $523,842 9 $188,793 11 $336,508 0 $0 APPLICATIONS DENIED 69 $793,096 221 $610,234 34 $316,740 6 $506,307 1 $79,000 APPLICATIONS WITHDRAWN 58 $590,387 178 $500,183 18 $301,332 5 $447,910 1 $39,910 FILES CLOSED FOR INCOMPLETENESS 17 $740,465 51 $503,423 3 $342,053 2 $242,630 0 $0
Aggregated Statistics For Year 2003(Based on 2 full and 1 partial tracts) A) FHA, FSA/RHS & VA B) Conventional C) Refinancings D) Home Improvement Loans E) Loans on Dwellings For 5+ Families F) Non-occupant Loans on Number Average Value Number Average Value Number Average Value Number Average Value Number Average Value Number Average Value
LOANS ORIGINATED 5 $226,700 560 $515,221 2,425 $459,502 42 $168,193 0 $0 49 $318,364 APPLICATIONS APPROVED, NOT ACCEPTED 1 $125,000 61 $574,850 281 $470,390 11 $161,166 0 $0 10 $278,363 APPLICATIONS DENIED 1 $218,520 81 $547,891 357 $516,032 16 $233,437 1 $424,510 10 $614,389 APPLICATIONS WITHDRAWN 0 $0 45 $627,377 303 $445,567 10 $45,949 0 $0 11 $483,503 FILES CLOSED FOR INCOMPLETENESS 0 $0 19 $721,730 85 $421,600 10 $66,516 0 $0 1 $179,310
Aggregated Statistics For Year 1999(Based on 1 partial tract) A) FHA, FSA/RHS & VA B) Conventional C) Refinancings D) Home Improvement Loans F) Non-occupant Loans on Number Average Value Number Average Value Number Average Value Number Average Value Number Average Value
LOANS ORIGINATED 4 $146,552 108 $345,762 106 $289,984 12 $54,313 4 $310,938 APPLICATIONS APPROVED, NOT ACCEPTED 0 $0 14 $390,255 18 $270,439 3 $51,863 0 $0 APPLICATIONS DENIED 1 $101,410 17 $379,572 35 $285,239 5 $71,298 1 $200,800 APPLICATIONS WITHDRAWN 1 $117,900 20 $347,778 22 $250,653 0 $0 1 $130,330 FILES CLOSED FOR INCOMPLETENESS 0 $0 7 $360,150 9 $279,592 0 $0 1 $137,660
Detailed HMDA statistics for the following Tracts:
0320.44
, 0320.45 , 0320.46
Private Mortgage Insurance Companies Aggregated Statistics For Year 2009(Based on 2 full and 1 partial tracts) A) Conventional B) Refinancings Number Average Value Number Average Value
LOANS ORIGINATED 3 $413,753 0 $0 APPLICATIONS APPROVED, NOT ACCEPTED 2 $487,080 1 $257,240 APPLICATIONS DENIED 4 $632,015 0 $0 APPLICATIONS WITHDRAWN 1 $462,530 0 $0 FILES CLOSED FOR INCOMPLETENESS 0 $0 0 $0
Aggregated Statistics For Year 2008(Based on 2 full and 1 partial tracts) A) Conventional B) Refinancings C) Non-occupant Loans on Number Average Value Number Average Value Number Average Value
LOANS ORIGINATED 2 $320,350 2 $518,100 0 $0 APPLICATIONS APPROVED, NOT ACCEPTED 1 $554,780 3 $314,647 1 $199,580 APPLICATIONS DENIED 1 $371,290 0 $0 0 $0 APPLICATIONS WITHDRAWN 0 $0 2 $552,680 0 $0 FILES CLOSED FOR INCOMPLETENESS 0 $0 0 $0 0 $0
Aggregated Statistics For Year 2007(Based on 1 full and 1 partial tracts) A) Conventional B) Refinancings C) Non-occupant Loans on Number Average Value Number Average Value Number Average Value
LOANS ORIGINATED 1 $355,220 2 $364,195 0 $0 APPLICATIONS APPROVED, NOT ACCEPTED 0 $0 4 $400,535 2 $413,425 APPLICATIONS DENIED 0 $0 1 $812,910 0 $0 APPLICATIONS WITHDRAWN 0 $0 0 $0 0 $0 FILES CLOSED FOR INCOMPLETENESS 0 $0 0 $0 0 $0
Aggregated Statistics For Year 2006(Based on 1 full and 1 partial tracts) B) Refinancings Number Average Value
LOANS ORIGINATED 1 $399,120 APPLICATIONS APPROVED, NOT ACCEPTED 0 $0 APPLICATIONS DENIED 1 $812,910 APPLICATIONS WITHDRAWN 0 $0 FILES CLOSED FOR INCOMPLETENESS 0 $0
Aggregated Statistics For Year 2005(Based on 2 full tracts) A) Conventional B) Refinancings Number Average Value Number Average Value
LOANS ORIGINATED 2 $906,500 2 $344,240 APPLICATIONS APPROVED, NOT ACCEPTED 1 $332,270 1 $359,210 APPLICATIONS DENIED 0 $0 0 $0 APPLICATIONS WITHDRAWN 0 $0 1 $336,260 FILES CLOSED FOR INCOMPLETENESS 0 $0 0 $0
Aggregated Statistics For Year 2004(Based on 1 full and 1 partial tracts) A) Conventional B) Refinancings C) Non-occupant Loans on Number Average Value Number Average Value Number Average Value
LOANS ORIGINATED 3 $363,533 3 $316,853 1 $359,210 APPLICATIONS APPROVED, NOT ACCEPTED 2 $254,440 0 $0 0 $0 APPLICATIONS DENIED 0 $0 0 $0 0 $0 APPLICATIONS WITHDRAWN 2 $307,910 0 $0 2 $307,910 FILES CLOSED FOR INCOMPLETENESS 0 $0 0 $0 0 $0
Aggregated Statistics For Year 2003(Based on 2 full and 1 partial tracts) A) Conventional B) Refinancings Number Average Value Number Average Value
LOANS ORIGINATED 11 $283,695 11 $252,056 APPLICATIONS APPROVED, NOT ACCEPTED 10 $319,853 8 $310,290 APPLICATIONS DENIED 1 $500,000 0 $0 APPLICATIONS WITHDRAWN 0 $0 2 $294,850 FILES CLOSED FOR INCOMPLETENESS 0 $0 0 $0
Aggregated Statistics For Year 1999(Based on 1 partial tract) A) Conventional B) Refinancings Number Average Value Number Average Value
LOANS ORIGINATED 8 $315,842 3 $210,217 APPLICATIONS APPROVED, NOT ACCEPTED 1 $395,720 1 $242,160 APPLICATIONS DENIED 0 $0 1 $151,440 APPLICATIONS WITHDRAWN 1 $229,240 0 $0 FILES CLOSED FOR INCOMPLETENESS 0 $0 0 $0
Detailed PMIC statistics for the following Tracts:
0320.44
, 0320.45 , 0320.46 Coto de Caza compared to California state average:
Median household income above state average. Median house value above state average. Unemployed percentage significantly below state average. Black race population percentage significantly below state average. Hispanic race population percentage below state average. Median age significantly above state average. Foreign-born population percentage below state average. Renting percentage significantly below state average. Number of rooms per house significantly above state average. House age significantly below state average. Percentage of population with a bachelor's degree or higher significantly above state average. Coto de Caza on our top lists :
#8 on the list of "Top 101 cities with largest percentage of males in occupations: sales and related occupations (population 5,000+)"
#20 on the list of "Top 101 cities with the largest percentage of high school students in private schools (500+ students)"
#32 on the list of "Top 101 cities with the least people driving a car to work alone (population 5,000+)"
#38 on the list of "Top 101 cities with largest percentage of males in occupations: management occupations (population 5,000+)"
#42 on the list of "Top 101 cities with largest percentage of females in industries: real estate and rental and leasing (population 5,000+)"
#44 on the list of "Top 100 cities with highest median household income (pop. 5,000+)"
#57 on the list of "Top 101 cities with largest percentage of females in occupations: sales and related occupations (population 5,000+)"
#63 on the list of "Top 101 cities with the highest percentage of family households, population 10,000+"
#68 on the list of "Top 101 cities with the most residents born in Jordan (population 500+)"
#82 on the list of "Top 100 cities with highest median house value (pop. 5,000+)"
#101 (92679) on the list of "Top 101 zip codes with the largest percentage of taxpayers using charity contributions deductions in 2012 (pop 5,000+)"
#4 on the list of "Top 101 counties with the highest total withdrawal of fresh water for public supply"
#5 on the list of "Top 101 counties with the most Catholic adherents"
#6 on the list of "Top 101 counties with the highest ground withdrawal of fresh water for public supply"
#7 on the list of "Top 101 counties with the most Evangelical Protestant adherents"
#8 on the list of "Top 101 counties with the highest Particulate Matter (PM2.5 ) Annual air pollution readings in 2012 (µg/m3 )"


 Recent articles from our blog. Our writers, many of them Ph.D. graduates or candidates, create easy-to-read articles on a wide variety of topics.

 , pop. 187,063).