Housing density: 655 houses/condos per square mile
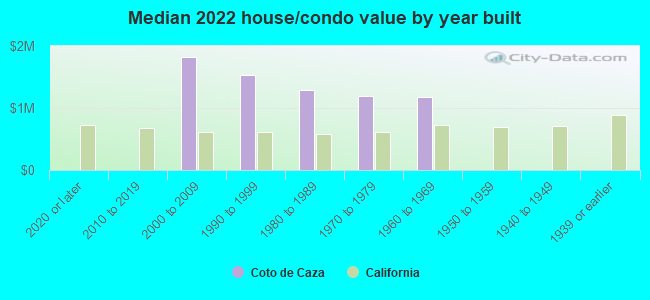
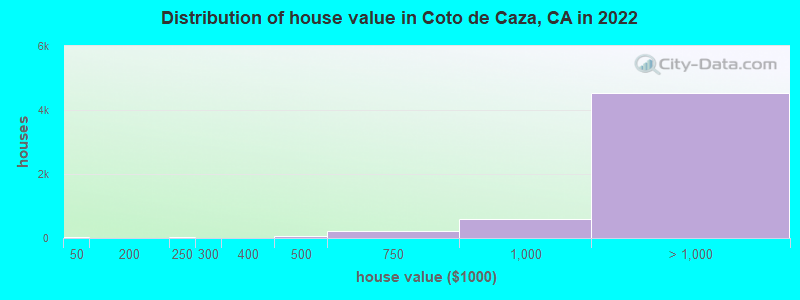
Median price asked for vacant for-sale houses and condos in 2022: $1,140,538.
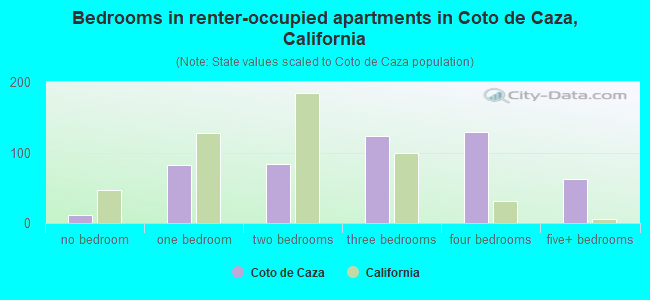
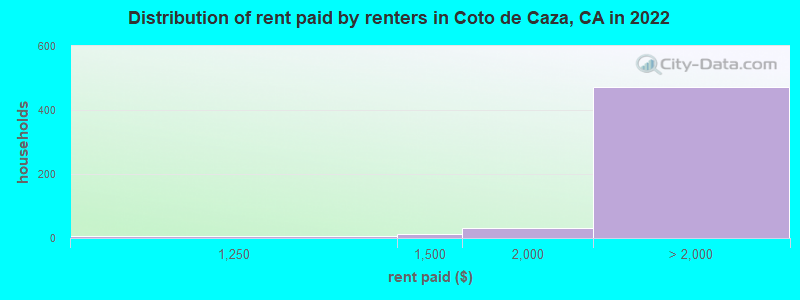
Median contract rent in 2022: over $2,000
Median rent asked for vacant for-rent units in 2022: $3,976
Median gross rent in Coto de Caza, CA in 2022: over $2,000
Housing units in Coto de Caza with a mortgage: 3,520 (588 second mortgage, 9 home equity loan, 550 both second mortgage and home equity loan) Houses without a mortgage: 74
Median household income for houses/condos with a mortgage: $233,277
Median household income for apartments without a mortgage: $208,678
Median monthly housing costs: $3,904
Compare current foreclosures near Coto de Caza, CA:
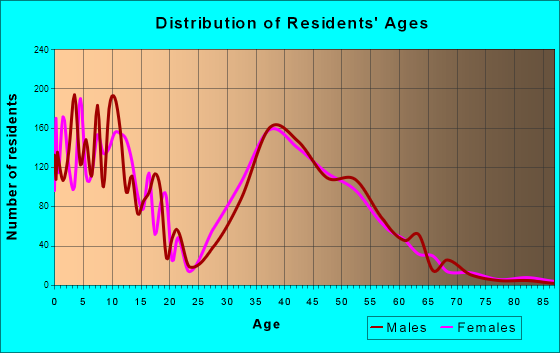
Size of family households: 1,762 2-persons, 1,078 3-persons, 992 4-persons, 483 5-persons, 159 6-persons, 43 7-or-more-persons.
Size of nonfamily households: 412 1-person, 90 2-persons, 22 3-persons.
2,779 married couples with children.
263 single-parent households (55 men, 208 women).
85.2% of residents of Coto de Caza speak English at home.
3.9% of residents speak Spanish at home (87% speak English very well, 5% speak English well, 8% speak English not well).
2.4% of residents speak other Indo-European language at home (88% speak English very well, 12% speak English well).
5.1% of residents speak Asian or Pacific Island language at home (58% speak English very well, 32% speak English well, 10% speak English not well).
1.2% of residents speak other language at home (89% speak English very well, 11% speak English well).
Foreign born population: 1,882 (12.1%)
(81.6% of them are naturalized citizens)
Percentage of workers working in this county: 91.0% Number of people working at home: 2,633 (32.4% of all workers)
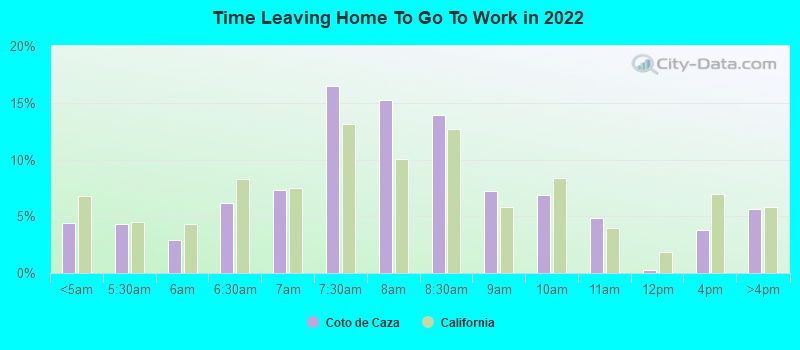
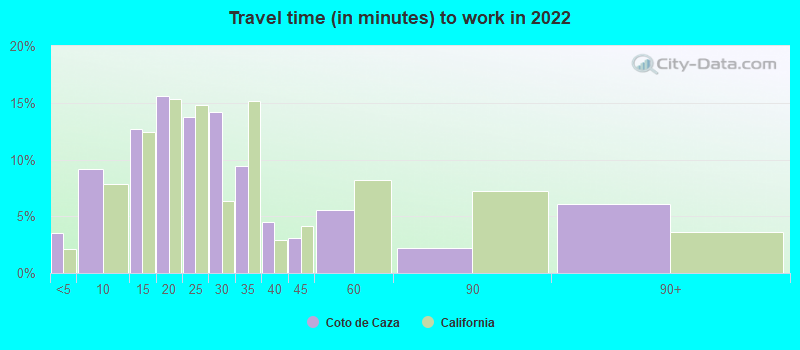
Travel time to work (commute)
Less than 5 minutes: 64
5 to 9 minutes: 308
10 to 14 minutes: 411
15 to 19 minutes: 676
20 to 24 minutes: 960
25 to 29 minutes: 484
30 to 34 minutes: 1,017
35 to 39 minutes: 283
40 to 44 minutes: 282
45 to 59 minutes: 606
60 to 89 minutes: 498
90 or more minutes: 131
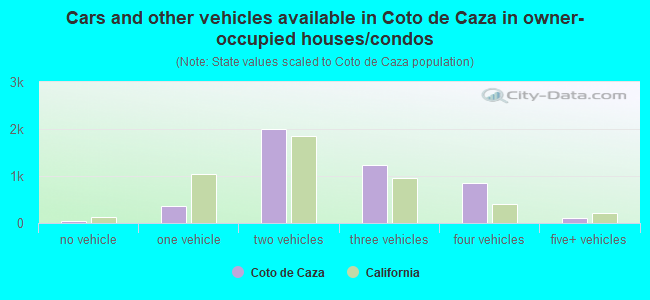
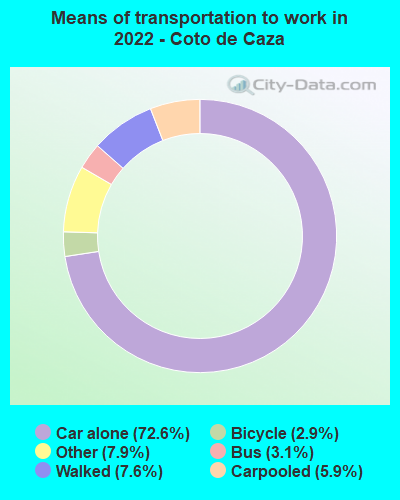
Means of transportation to work:
Drove a car alone: 646 (20.9%)
Carpooled: 56 (1.8%)
Bus: 24 (0.8%)
Taxi: 81 (2.6%)
Bicycle: 28 (0.9%)
Walked: 67 (2.2%)
Worked at home: 2,633 (85.2%)
Unemployment by race in 2022
Unemployment rate for White non-Hispanic residents
2.0%Males
2.8%Females
Unemployment rate for Black residents
45.0%Males
14.8%Females
Unemployment rate for Asian residents
9.5%Males
1.3%Females
Unemployment rate for Hispanic or Latino residents
20.0%Males
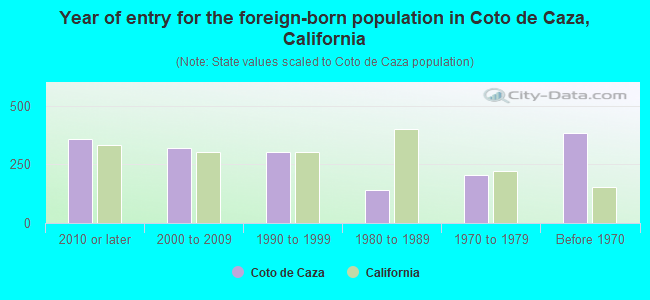
Year of entry for the foreign-born population in Coto de Caza, California
3592010 or later
3222000 to 2009
3051990 to 1999
1391980 to 1989
2041970 to 1979
384Before 1970
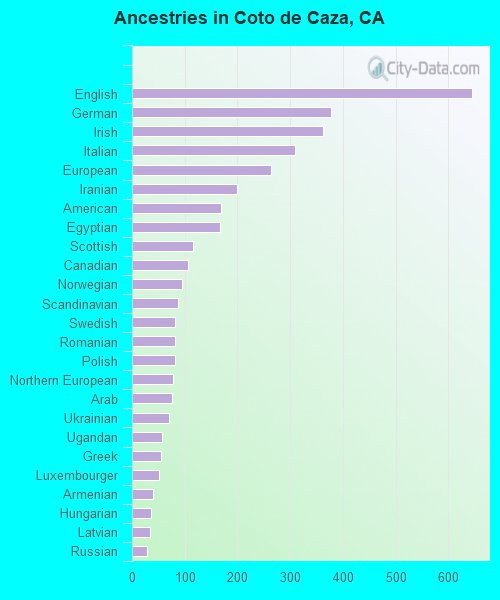
First ancestries reported:
English: 645 (10.6%)
German: 377 (6.2%)
Irish: 363 (5.9%)
Italian: 309 (5.1%)
European: 264 (4.3%)
Iranian: 200 (3.3%)
American: 168 (2.7%)
Egyptian: 167 (2.7%)
Scottish: 116 (1.9%)
Canadian: 106 (1.7%)
Norwegian: 94 (1.5%)
Scandinavian: 88 (1.4%)
Swedish: 81 (1.3%)
Romanian: 81 (1.3%)
Polish: 81 (1.3%)
Northern European: 77 (1.3%)
Arab: 75 (1.2%)
Ukrainian: 71 (1.2%)
Ugandan: 56 (0.9%)
Greek: 55 (0.9%)
Luxembourger: 52 (0.9%)
Armenian: 39 (0.6%)
Hungarian: 36 (0.6%)
Latvian: 34 (0.6%)
Russian: 28 (0.5%)
Afghan: 26 (0.4%)
Danish: 24 (0.4%)
British: 24 (0.4%)
Brazilian: 24 (0.4%)
Eastern European: 23 (0.4%)
French: 19 (0.3%)
Scotch-Irish: 15 (0.2%)
Dutch: 13 (0.2%)
Slovene: 10 (0.2%)
Lithuanian: 9 (0.1%)
Pennsylvania German: 8 (0.1%)
Turkish: 8 (0.1%)
Yugoslavian: 8 (0.1%)
Czech: 7 (0.1%)
Haitian: 7 (0.1%)
Croatian: 6 (0.10%)
Serbian: 6 (0.10%)
Swiss: 5 (0.08%)
Lebanese: 4 (0.07%)
Portuguese: 3 (0.05%)
Belgian: 1 (0.02%)
Most common places of birth for foreign-born residents (%):
Iran
Coto de Caza:
13.1% (246)
California:
2.0% (206,004)
Philippines
Coto de Caza:
12.4% (234)
California:
7.8% (818,297)
England
Coto de Caza:
10.6% (200)
California:
0.6% (57,953)
Canada
Coto de Caza:
8.9% (168)
California:
1.2% (127,477)
China, excluding Hong Kong and Taiwan
Coto de Caza:
7.8% (146)
California:
6.6% (684,672)
Egypt
Coto de Caza:
5.6% (106)
California:
0.4% (42,718)
Syria
Coto de Caza:
3.9% (74)
California:
0.3% (30,949)
Korea
Coto de Caza:
3.8% (71)
California:
3.0% (315,248)
Mexico
Coto de Caza:
3.5% (66)
California:
37.2% (3,881,193)
Taiwan
Coto de Caza:
3.3% (62)
California:
1.7% (176,274)
Uganda
Coto de Caza:
2.4% (45)
California:
0.0% (4,329)
Romania
Coto de Caza:
2.4% (45)
California:
0.2% (23,058)
United Kingdom, excluding England and Scotland
Coto de Caza:
2.0% (38)
California:
0.6% (60,582)
Vietnam
Coto de Caza:
1.9% (35)
California:
4.9% (512,335)
India
Coto de Caza:
1.8% (34)
California:
5.2% (539,184)
Argentina
Coto de Caza:
1.8% (34)
California:
0.3% (33,960)
Brazil
Coto de Caza:
1.6% (30)
California:
0.5% (53,222)
Place of birth for U.S.-born residents:
This state: 8,939
Other state: 4,348
Northeast: 1,067
Midwest: 1,950
South: 650
West: 666
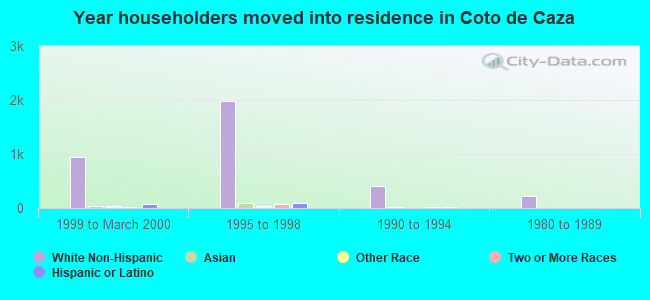
89.7% of Coto de Caza residents lived in the same house 1 years ago. Out of people who lived in different houses, 37.6% lived in this county. Out of people who lived in different counties, 35.8% lived in California.
Coto de Caza:
89.7%
State average:
88.9%
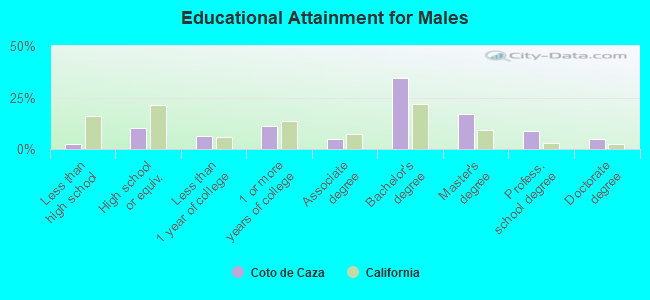
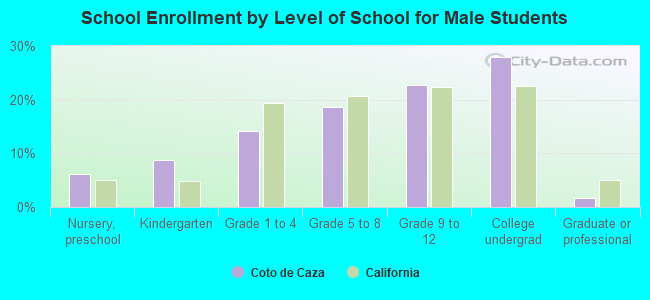
Education attainment for males 25 years and older:
No schooling: 64
Nursery to 4th grade: 0
5th and 6th grade: 0
7th and 8th grade: 0
9th grade: 0
10th grade: 43
11th grade: 6
12th grade, no diploma: 12
High school graduate (or equivalency): 577
Less than 1 year of college: 362
Some college more than 1 year, no degree: 624
Associate degree: 282
Bachelor's degree: 1,978
Master's degree: 979
Professional school degree: 498
Doctorate degree: 286
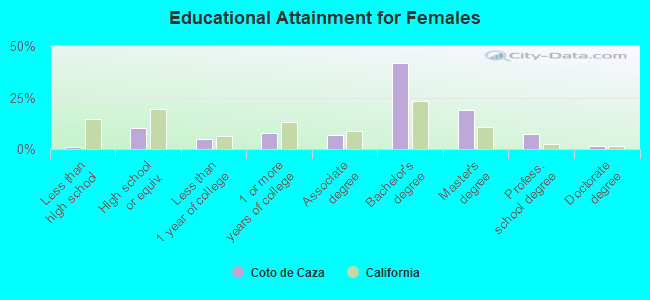
Education attainment for females 25 years and older:
No schooling: 0
Nursery to 4th grade: 0
5th and 6th grade: 0
7th and 8th grade: 0
9th grade: 12
10th grade: 0
11th grade: 0
12th grade, no diploma: 38
High school graduate (or equivalency): 535
Less than 1 year of college: 246
Some college more than 1 year, no degree: 413
Associate degree: 364
Bachelor's degree: 2,190
Master's degree: 989
Professional school degree: 385
Doctorate degree: 71
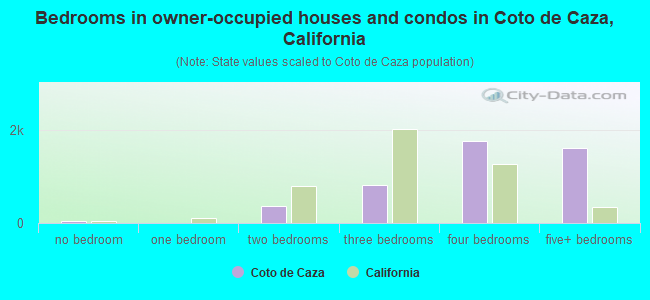
Housing units in structures:
One, detached: 4,514
One, attached: 455
3 or 4: 39
5 to 9: 68
10 to 19: 82
20 to 49: 6
Housing units lacking complete plumbing facilities in 2022: 0.7%
Housing units lacking complete kitchen facilities in 2022: 1.4%