Estimated zip code population in 2022: 44,074 Zip code population in 2010: 43,792 Zip code population in 2000: 42,181
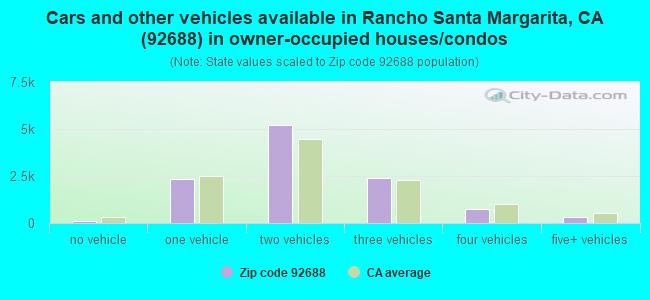
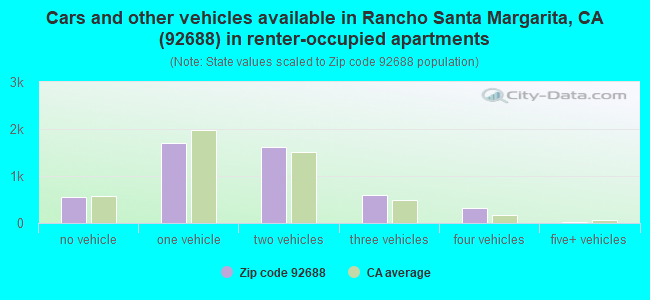
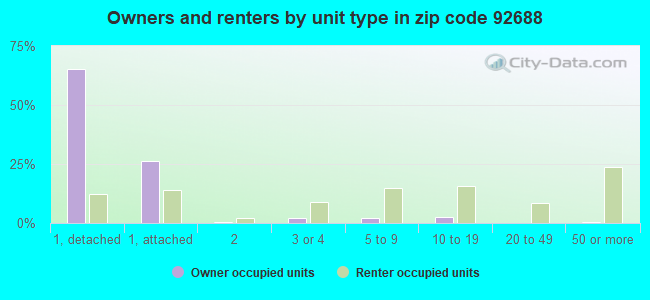
Houses and condos: 16,226 Renter-occupied apartments: 4,797
% of renters here:
30%
State:
44%
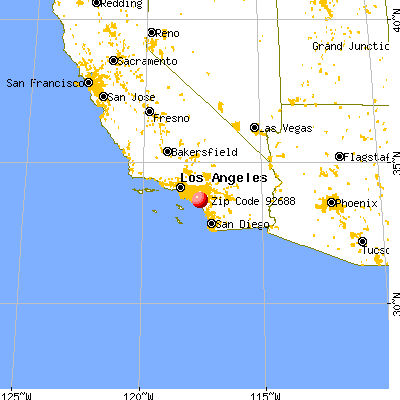
March 2022 cost of living index in zip code 92688: 86.6 (less than average, U.S. average is 100)
Land area: 10.9 sq. mi. Water area: 0.0 sq. mi.
Population density: 4,044 people per square mile
(average).
OSM Map
General Map
Google Map
MSN Map
OSM Map
General Map
Google Map
MSN Map
OSM Map
General Map
Google Map
MSN Map
OSM Map
General Map
Google Map
MSN Map
Please wait while loading the map...
Real estate property taxes paid for housing units in 2022:
This zip code:
0.7% ($6,529)
California:
0.7% ($4,831)
Median real estate property taxes paid for housing units with mortgages in 2022: $6,704 (0.7%) Median real estate property taxes paid for housing units with no mortgage in 2022: $5,528 (0.6%)
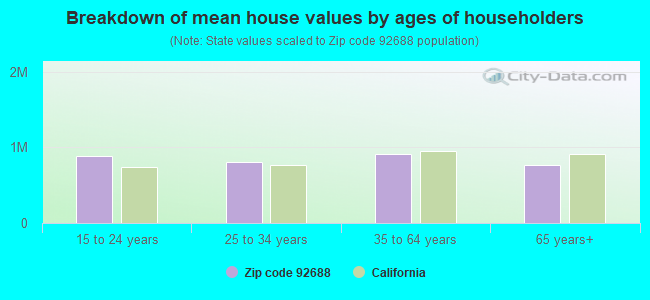
Estimated median house/condo value in 2022: $889,310
92688:
$889,310
California:
$715,900
According to our research of California and other state lists, there were 16 registered sex offenders living in 92688 zip code as of April 26, 2024. The ratio of all residents to sex offenders in zip code 92688 is 2,859 to 1. The ratio of registered sex offenders to all residents in this zip code is much lower than the state average.
Median resident age:
This zip code:
39.1 years
California median age:
37.9 years
Average household size:
This zip code:
2.8 people
California:
2.8 people
Averages for the 2020 tax year for zip code 92688, filed in 2021:
Average Adjusted Gross Income (AGI) in 2020: $105,490 (Individual Income Tax Returns)
Here:
$105,490
State:
$95,910
Salary/wage: $95,692 (reported on 86.9% of returns)
Here:
$95,692
State:
$77,331
(% of AGI for various income ranges: 1249.1% for AGIs below $25k, 4042.9% for AGIs $25k-50k, 7537.3% for AGIs $50k-75k, 11245.2% for AGIs $75k-100k, 23411.7% for AGIs $100k-200k, 85286.2% for AGIs over 200k)
Taxable interest for individuals: $947 (reported on 44.8% of returns)
This zip code:
$947
California:
$2,294
(% of AGI for various income ranges: 15.7% for AGIs below $25k, 26.2% for AGIs $25k-50k, 51.3% for AGIs $50k-75k, 63.8% for AGIs $75k-100k, 101.8% for AGIs $100k-200k, 402.4% for AGIs over 200k)
Ordinary dividends: $3,598 (reported on 25.4% of returns)
Here:
$3,598
State:
$10,949
(% of AGI for various income ranges: 33.2% for AGIs below $25k, 39.0% for AGIs $25k-50k, 67.2% for AGIs $50k-75k, 97.2% for AGIs $75k-100k, 196.0% for AGIs $100k-200k, 1152.3% for AGIs over 200k)
Net capital gain/loss in AGI: +$22,497 (reported on 24.9% of returns)
Here:
+$22,497
State:
+$49,306
(% of AGI for various income ranges: 16.9% for AGIs below $25k, 44.8% for AGIs $25k-50k, 61.9% for AGIs $50k-75k, 179.8% for AGIs $75k-100k, 367.1% for AGIs $100k-200k, 12375.1% for AGIs over 200k)
Profit/loss from business: +$13,427 (reported on 19.1% of returns)
Here:
+$13,427
State:
+$15,671
(% of AGI for various income ranges: 146.7% for AGIs below $25k, 248.5% for AGIs $25k-50k, 311.7% for AGIs $50k-75k, 347.9% for AGIs $75k-100k, 602.9% for AGIs $100k-200k, 2062.8% for AGIs over 200k)
Taxable individual retirement arrangement distribution: $22,527 (reported on 6.4% of returns)
92688:
$22,527
California:
$23,505
(% of AGI for various income ranges: 42.0% for AGIs below $25k, 94.7% for AGIs $25k-50k, 152.5% for AGIs $50k-75k, 289.8% for AGIs $75k-100k, 413.9% for AGIs $100k-200k, 1134.0% for AGIs over 200k)
Self-employed (Keogh) retirement plans: $24,944 (reported on 0.8% of returns)
92688:
$24,944
California:
$30,163
(% of AGI for various income ranges: 25.7% for AGIs $50k-75k, 34.6% for AGIs $100k-200k, 358.7% for AGIs over 200k)
Total itemized deductions: $32,760 (reported on 27.0% of returns)
Here:
$32,760
State:
$39,517
(% of AGI for various income ranges: 114.0% for AGIs below $25k, 252.2% for AGIs $25k-50k, 709.2% for AGIs $50k-75k, 1409.7% for AGIs $75k-100k, 2897.1% for AGIs $100k-200k, 8218.4% for AGIs over 200k)
Charity contributions: $6,648 (reported on 23.1% of returns)
Here:
$6,648
State:
$12,598
(% of AGI for various income ranges: 5.2% for AGIs below $25k, 23.5% for AGIs $25k-50k, 70.4% for AGIs $50k-75k, 130.3% for AGIs $75k-100k, 403.7% for AGIs $100k-200k, 2156.7% for AGIs over 200k)
Taxes paid: $9,164 (reported on 26.9% of returns)
92688:
$9,164
State:
$8,807
(% of AGI for various income ranges: 22.2% for AGIs below $25k, 61.3% for AGIs $25k-50k, 196.3% for AGIs $50k-75k, 427.4% for AGIs $75k-100k, 891.5% for AGIs $100k-200k, 2045.5% for AGIs over 200k)
Earned income credit: $1,631 (reported on 6.4% of returns)
Here:
$1,631
State:
$2,074
(% of AGI for various income ranges: 41.3% for AGIs below $25k, 37.6% for AGIs $25k-50k)
Percentage of individuals using paid preparers for their 2020 taxes: 93.2%
Here:
93%
State:
92%
(% for various income ranges: 91.0% for AGIs below $25k, 92.5% for AGIs $25k-50k, 93.0% for AGIs $50k-75k, 94.7% for AGIs $75k-100k, 94.0% for AGIs $100k-200k, 96.0% for AGIs over 200k)
Averages for the 2012 tax year for zip code 92688, filed in 2013:
Average Adjusted Gross Income (AGI) in 2012: $83,556 (Individual Income Tax Returns)
Here:
$83,556
State:
$72,726
Salary/wage: $79,125 (reported on 89.1% of returns)
Here:
$79,125
State:
$59,079
(% of AGI for various income ranges: 76.8% for AGIs below $25k, 83.0% for AGIs $25k-50k, 83.9% for AGIs $50k-75k, 85.1% for AGIs $75k-100k, 88.9% for AGIs $100k-200k, 79.1% for AGIs over 200k)
Taxable interest for individuals: $749 (reported on 44.9% of returns)
This zip code:
$749
California:
$2,146
(% of AGI for various income ranges: 1.1% for AGIs below $25k, 0.6% for AGIs $25k-50k, 0.4% for AGIs $50k-75k, 0.4% for AGIs $75k-100k, 0.2% for AGIs $100k-200k, 0.5% for AGIs over 200k)
Ordinary dividends: $2,512 (reported on 21.8% of returns)
Here:
$2,512
State:
$9,308
(% of AGI for various income ranges: 1.2% for AGIs below $25k, 0.7% for AGIs $25k-50k, 0.6% for AGIs $50k-75k, 0.5% for AGIs $75k-100k, 0.5% for AGIs $100k-200k, 0.9% for AGIs over 200k)
Net capital gain/loss in AGI: +$5,655 (reported on 19.6% of returns)
Here:
+$5,655
State:
+$30,460
(% of AGI for various income ranges: 0.2% for AGIs $25k-50k, 0.1% for AGIs $50k-75k, 0.3% for AGIs $75k-100k, 0.4% for AGIs $100k-200k, 4.0% for AGIs over 200k)
Profit/loss from business: +$14,222 (reported on 18.3% of returns)
Here:
+$14,222
State:
+$17,064
(% of AGI for various income ranges: 10.3% for AGIs below $25k, 5.1% for AGIs $25k-50k, 3.8% for AGIs $50k-75k, 3.3% for AGIs $75k-100k, 2.4% for AGIs $100k-200k, 2.2% for AGIs over 200k)
Taxable individual retirement arrangement distribution: $17,897 (reported on 7.2% of returns)
92688:
$17,897
California:
$19,557
(% of AGI for various income ranges: 2.8% for AGIs below $25k, 1.9% for AGIs $25k-50k, 2.1% for AGIs $50k-75k, 2.0% for AGIs $75k-100k, 1.3% for AGIs $100k-200k, 1.2% for AGIs over 200k)
Self-employment retirement plans: $16,353 (reported on 0.8% of returns)
92688:
$16,353
California:
$24,530
(% of AGI for various income ranges: 0.2% for AGIs $50k-75k, 0.1% for AGIs $100k-200k, 0.3% for AGIs over 200k)
Total itemized deductions: $31,842 (25% of AGI, reported on 53.2% of returns)
Here:
$31,842
State:
$34,004
Here:
24.7% of AGI
State:
22.7% of AGI
(% of AGI for various income ranges: 15.6% for AGIs below $25k, 14.1% for AGIs $25k-50k, 19.9% for AGIs $50k-75k, 22.4% for AGIs $75k-100k, 22.6% for AGIs $100k-200k, 18.6% for AGIs over 200k)
Charity contributions: $3,378 (reported on 46.7% of returns)
Here:
$3,378
State:
$4,659
(% of AGI for various income ranges: 0.7% for AGIs below $25k, 1.1% for AGIs $25k-50k, 1.6% for AGIs $50k-75k, 2.0% for AGIs $75k-100k, 2.0% for AGIs $100k-200k, 2.1% for AGIs over 200k)
Taxes paid: $12,907 (reported on 53.1% of returns)
92688:
$12,907
State:
$14,448
(% of AGI for various income ranges: 3.5% for AGIs below $25k, 3.8% for AGIs $25k-50k, 6.1% for AGIs $50k-75k, 7.8% for AGIs $75k-100k, 9.1% for AGIs $100k-200k, 9.7% for AGIs over 200k)
Earned income credit: $1,865 (reported on 7.9% of returns)
Here:
$1,865
State:
$2,286
(% of AGI for various income ranges: 3.4% for AGIs below $25k, 0.7% for AGIs $25k-50k)
Percentage of individuals using paid preparers for their 2012 taxes: 57.8%
Here:
58%
State:
64%
(% for various income ranges: 50.1% for AGIs below $25k, 55.9% for AGIs $25k-50k, 59.9% for AGIs $50k-75k, 62.3% for AGIs $75k-100k, 61.0% for AGIs $100k-200k, 69.7% for AGIs over 200k)
Averages for the 2004 tax year for zip code 92688, filed in 2005:
Average Adjusted Gross Income (AGI) in 2004: $70,598 (Individual Income Tax Returns)
Here:
$70,598
State:
$58,600
Salary/wage: $67,973 (reported on 91.0% of returns)
Here:
$67,973
State:
$49,455
(% of AGI for various income ranges: 219.2% for AGIs below $10k, 78.8% for AGIs $10k-25k, 88.2% for AGIs $25k-50k, 90.1% for AGIs $50k-75k, 90.4% for AGIs $75k-100k, 85.7% for AGIs over 100k)
Taxable interest for individuals: $721 (reported on 57.5% of returns)
This zip code:
$721
California:
$2,365
(% of AGI for various income ranges: 10.4% for AGIs below $10k, 1.7% for AGIs $10k-25k, 0.8% for AGIs $25k-50k, 0.5% for AGIs $50k-75k, 0.4% for AGIs $75k-100k, 0.5% for AGIs over 100k)
Taxable dividends: $1,214 (reported on 25.2% of returns)
Here:
$1,214
State:
$4,746
(% of AGI for various income ranges: 6.6% for AGIs below $10k, 1.0% for AGIs $10k-25k, 0.5% for AGIs $25k-50k, 0.4% for AGIs $50k-75k, 0.4% for AGIs $75k-100k, 0.4% for AGIs over 100k)
Net capital gain/loss: +$7,415 (reported on 22.9% of returns)
Here:
+$7,415
State:
+$23,418
(% of AGI for various income ranges: -7.6% for AGIs below $10k, -0.2% for AGIs $10k-25k, 0.2% for AGIs $25k-50k, 0.3% for AGIs $50k-75k, 0.5% for AGIs $75k-100k, 4.2% for AGIs over 100k)
Profit/loss from business: +$14,598 (reported on 19.0% of returns)
Here:
+$14,598
State:
+$16,826
(% of AGI for various income ranges: 10.0% for AGIs below $10k, 9.4% for AGIs $10k-25k, 5.2% for AGIs $25k-50k, 4.0% for AGIs $50k-75k, 3.9% for AGIs $75k-100k, 3.3% for AGIs over 100k)
IRA payment deduction: $3,092 (reported on 3.6% of returns)
92688:
$3,092
California:
$3,192
(% of AGI for various income ranges: 0.6% for AGIs below $10k, 0.3% for AGIs $10k-25k, 0.3% for AGIs $25k-50k, 0.2% for AGIs $50k-75k, 0.1% for AGIs $75k-100k, 0.1% for AGIs over 100k)
Self-employed pension: $13,620 (reported on 1.4% of returns)
Here:
$13,620
California:
$17,688
(% of AGI for various income ranges: 0.1% for AGIs $25k-50k, 0.2% for AGIs $50k-75k, 0.3% for AGIs $75k-100k, 0.3% for AGIs over 100k)
Total itemized deductions: $29,223 (30% of AGI, reported on 61.5% of returns)
Here:
$29,223
State:
$28,113
Here:
29.5% of AGI
State:
25.3% of AGI
(% of AGI for various income ranges: 65.2% for AGIs below $10k, 19.6% for AGIs $10k-25k, 23.7% for AGIs $25k-50k, 29.2% for AGIs $50k-75k, 29.3% for AGIs $75k-100k, 23.7% for AGIs over 100k)
Charity contributions deductions: $3,018 (3% of AGI, reported on 56.3% of returns)
Here:
$3,018
State:
$3,923
Here:
3.0% of AGI
State:
3.3% of AGI
(% of AGI for various income ranges: 1.8% for AGIs below $10k, 1.3% for AGIs $10k-25k, 1.9% for AGIs $25k-50k, 2.4% for AGIs $50k-75k, 2.5% for AGIs $75k-100k, 2.5% for AGIs over 100k)
Total tax: $9,669 (reported on 85.1% of returns)
92688:
$9,669
State:
$10,761
(% of AGI for various income ranges: 8.9% for AGIs below $10k, 5.3% for AGIs $10k-25k, 7.3% for AGIs $25k-50k, 8.3% for AGIs $50k-75k, 8.7% for AGIs $75k-100k, 14.8% for AGIs over 100k)
Earned income credit: $1,503 (reported on 5.9% of returns)
Here:
$1,503
State:
$1,763
Percentage of individuals using paid preparers for their 2004 taxes: 60.6%
Here:
61%
State:
66%
(% for various income ranges: 46.6% for AGIs below $10k, 57.2% for AGIs $10k-25k, 58.6% for AGIs $25k-50k, 64.6% for AGIs $50k-75k, 63.8% for AGIs $75k-100k, 66.8% for AGIs over 100k)
Likely homosexual households (counted as self-reported same-sex unmarried-partner households)
Lesbian couples: 0.2% of all households
Gay men: 0.1% of all households
Household received Food Stamps/SNAP in the past 12 months: 457 Household did not receive Food Stamps/SNAP in the past 12 months: 15,120
Women who had a birth in the past 12 months: 573 (569 now married, 0 unmarried) Women who did not have a birth in the past 12 months: 10,801 (5,537 now married, 5,211 unmarried)
Housing units in zip code 92688 with a mortgage: 9,336 (976 second mortgage, 8 home equity loan, 814 both second mortgage and home equity loan) Houses without a mortgage: 113
Median monthly owner costs for units with a mortgage: $3,153 Median monthly owner costs for units without a mortgage: $916
Residents with income below the poverty level in 2022:
This zip code:
5.0%
Whole state:
12.2%
Residents with income below 50% of the poverty level in 2022:
This zip code:
2.3%
Whole state:
6.2%
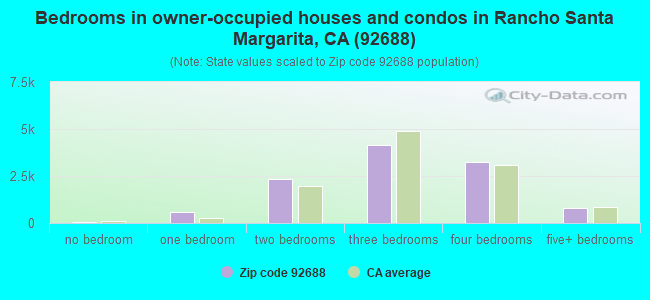
Median number of rooms in houses and condos:
Here:
6.1
State:
6.0
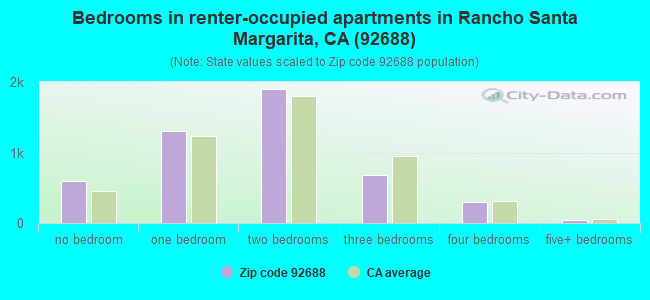
Median number of rooms in apartments:
Here:
3.8
State:
3.9
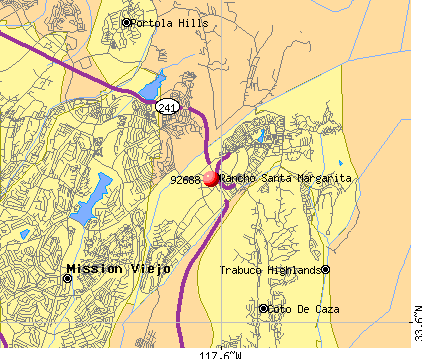
Notable locations in this zip code not listed on our city pages
Notable locations in zip code 92688: San Francisco Solano (A), Orange County Fire Authority Station 45 (B), Orange County Fire Authority Station 58 (C). Display/hide their locations on the map
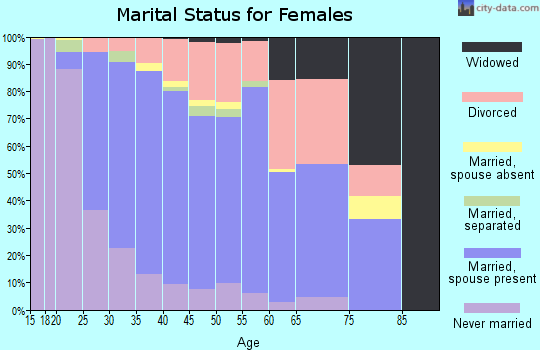
8,705 married couples with children.
1,138 single-parent households (223 men, 915 women).
73.5% of residents of 92688 zip code speak English at home.
11.9% of residents speak Spanish at home (67% very well, 20% well, 6% not well, 7% not at all).
6.4% of residents speak other Indo-European language at home (71% very well, 15% well, 13% not well, 2% not at all).
6.1% of residents speak Asian or Pacific Island language at home (63% very well, 25% well, 10% not well, 3% not at all).
1.5% of residents speak other language at home (84% very well, 8% well, 4% not well, 4% not at all).
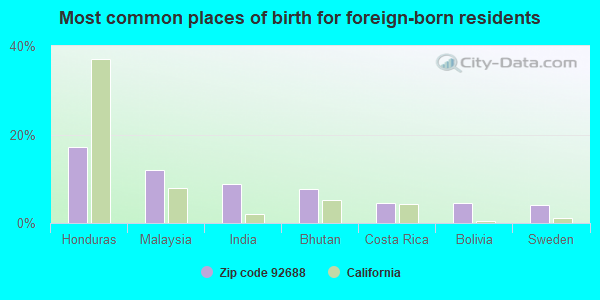
Foreign born population: 9,675 (22.0%) (60.6% of them are naturalized citizens)
This zip code:
22.0%
Whole state:
26.7%
17%Honduras
12%Malaysia
9%India
8%Bhutan
4%Costa Rica
4%Bolivia
4%Sweden
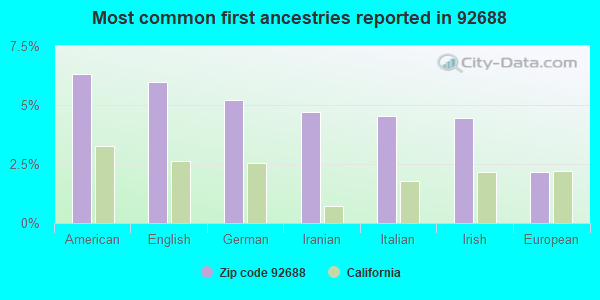
6%American
6%English
5%German
5%Iranian
5%Italian
4%Irish
2%European
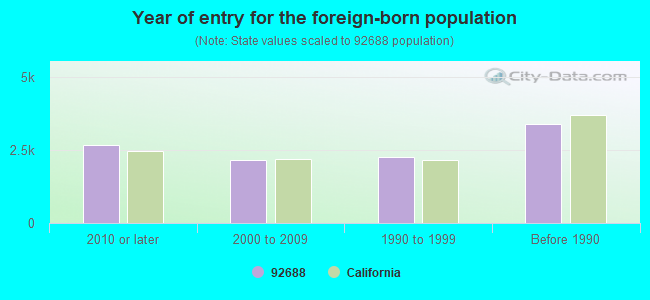
Year of entry for the foreign-born population
2,6852010 or later
2,1592000 to 2009
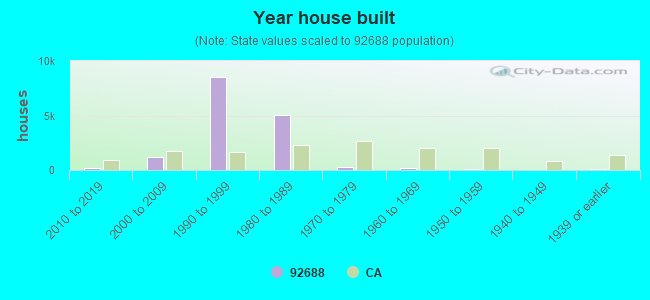
2,2741990 to 1999
3,413Before 1990
Major facilities with environmental interests located in this zip code:
APPLIED MEDICAL RESOURCES (22872 AVENIDA EMPRESA in RANCHO SANTA MARGARITA, CA)
STATE MASTER (California - Hazardous Waste Tracking) - HAZARDOU WASTE PROGRAM Small Quantity Generators, between 100 kg and 1000 kg of hazardous waste/month (Resource Conservation and Recovery Act (tracking hazardous waste)) - notification
LAS FLORES (ELEM) (25862 ANTONIO PKWY in RANCHO SANTA MARGARITA, CA)
(National Center for Education Statistics) - STATE ID-6114516 Organizations: CAPISTRANO UNIFIED (SCHOOL DISTRICT)
LAS FLORES MIDDLE (25862 ANTONIO PKWY in RANCHO SANTA MARGARITA, CA)
(National Center for Education Statistics) - STATE ID-6117725 Organizations: CAPISTRANO UNIFIED (SCHOOL DISTRICT)
MELINDA HEIGHTS ELEMENTARY (21001 RANCHO TRABUCO in RANCHO SANTA MARGARITA, CA)
(National Center for Education Statistics) - STATE ID-6114888 Organizations: SADDLEBACK VALLEY UNIFIED (SCHOOL DISTRICT)
CIELO VISTA ELEMENTARY (21301 AVENIDA DE LAS FLORES in RANCHO SANTA MARGARITA, CA)
(National Center for Education Statistics) - STATE ID-6109540 Organizations: SADDLEBACK VALLEY UNIFIED (SCHOOL DISTRICT)
LOCKHEED MARTIN AERONUTRONIC (29947 AVENIDA DE LAS BANDERAS in RANCHO SANTA MARGARITA, CA)
HAZARDOUS WASTE BIENNIAL REPORTER (Resource Conservation and Recovery Act (tracking hazardous waste)) (Resource Conservation and Recovery Act (tracking hazardous waste)) Organizations: F (CONTACT/OWNER)
, LOCKHEED MARTIN TACTICAL SYSTEMS CORP (CONTACT/OWNER)
LOCKHEED MARTIN AERONUTRONIC (22982 ARROYO VISTA in RANCHO SANTA MARGARITA, CA)
(Resource Conservation and Recovery Act (tracking hazardous waste)) Organizations: LOCKHEED MARTIN TACTICAL SYSTEMS CORP (CONTACT/OWNER)
, LOCKHEED MARTIN TACTICAL (CONTACT/OWNER)
GREGGS SANTA MARGARITA MOBIL (31521 SANTA MARGARITA PKWY in RANCHO SANTA MARGARITA, CA)
Small Quantity Generators, between 100 kg and 1000 kg of hazardous waste/month (Resource Conservation and Recovery Act (tracking hazardous waste)) - notification Organizations: MOBIL OIL CORP (CONTACT/OWNER)
INTRNATL FOOD & BEVERAGE (30152 AVENTURA in RANCHO SANTA MARGARITA, CA)
Small Quantity Generators, between 100 kg and 1000 kg of hazardous waste/month (Resource Conservation and Recovery Act (tracking hazardous waste)) - notification Organizations: INTERNATIONAL FOOD & BEVERAGE (CONTACT/OWNER)
MERCADO CLNRS (31451 SANTA MARGARITA PKWY in RANCHO SANTA MARGARITA, CA)
Small Quantity Generators, between 100 kg and 1000 kg of hazardous waste/month (Resource Conservation and Recovery Act (tracking hazardous waste)) - notification Organizations: ROY MAMELLI (CONTACT/OWNER)
CHEMWEST INC (23241 ARROYO VISTA in RANCHO SANTA MARGARITA, CA)
Small Quantity Generators, between 100 kg and 1000 kg of hazardous waste/month (Resource Conservation and Recovery Act (tracking hazardous waste)) - notification
AMERICAN DISPLAY INC (22432 AVENIDA EMPRESA in RANCHO SANTA MARGARITA, CA)
Small Quantity Generators, between 100 kg and 1000 kg of hazardous waste/month (Resource Conservation and Recovery Act (tracking hazardous waste))
FORESPAR PRODUCTS CORP (22322 GILBERTO in RANCHO SANTA MARGARITA, CA)
Small Quantity Generators, between 100 kg and 1000 kg of hazardous waste/month (Resource Conservation and Recovery Act (tracking hazardous waste)) - notification Organizations: ROBERT FORESMAN (CONTACT/OWNER)
Housing units lacking complete plumbing facilities: 0.0% Housing units lacking complete kitchen facilities: 0.5%
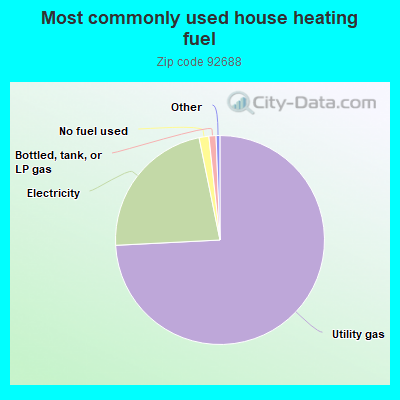
74.2%Utility gas
22.6%Electricity
1.5%No fuel used
1.1%Bottled, tank, or LP gas
Population in 1990: 9,489. Population change in the 1990s: +32,692 (+344.5%).
Place of birth for U.S.-born residents:
This state: 26,414
Northeast: 1,958
Midwest: 2,606
South: 1,382
West: 1,189
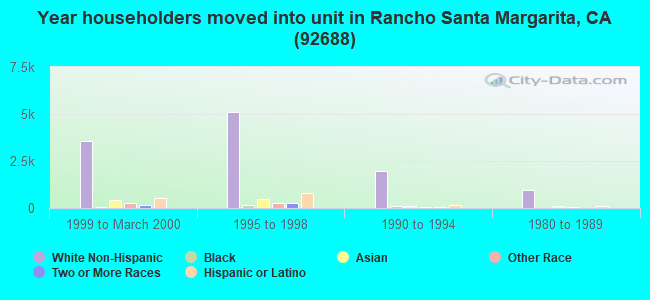
30% of the 92688 zip code residents lived in the same house 5 years ago. Out of people who lived in different houses, 67% lived in this county. Out of people who lived in different counties, 50% lived in California.
89% of the 92688 zip code residents lived in the same house 1 year ago. Out of people who lived in different houses, 72% moved from this county. Out of people who lived in different houses, 8% moved from different county within same state. Out of people who lived in different houses, 12% moved from different state. Out of people who lived in different houses, 6% moved from abroad.
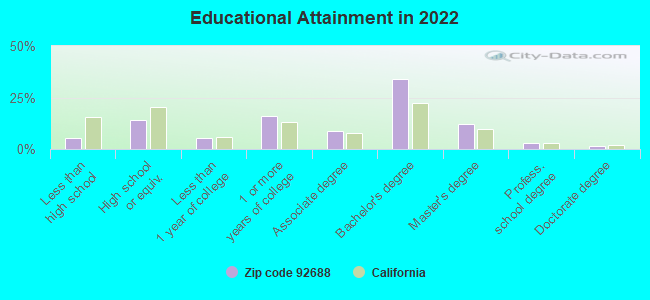
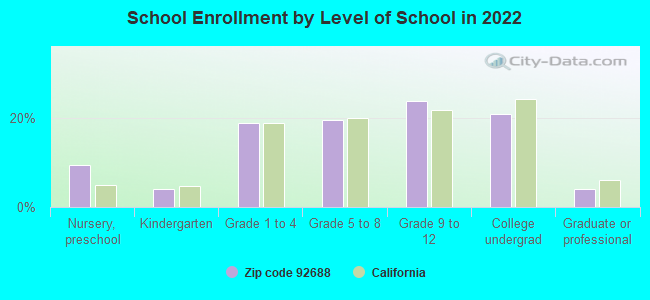
Private vs. public school enrollment:
Students in private schools in grades 1 to 8 (elementary and middle school): 573
Here:
12.6%
California:
10.5%
Students in private schools in grades 9 to 12 (high school): 333
Here:
11.8%
California:
8.5%
Students in private undergraduate colleges: 531
Here:
21.5%
California:
15.9%
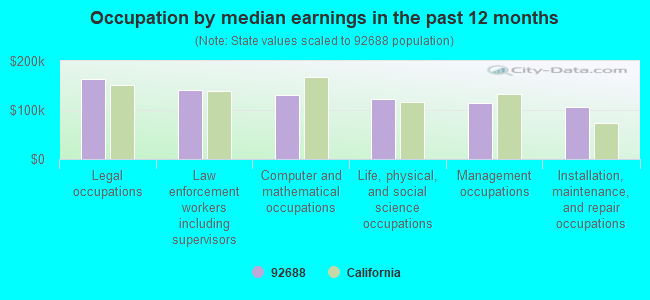
Occupation by median earnings in the past 12 months ($)
162,354Legal occupations
141,324Law enforcement workers including supervisors
131,232Computer and mathematical occupations
122,649Life, physical, and social science occupations
114,962Management occupations
106,199Installation, maintenance, and repair occupations
Companies with biggest federal contracts located in this zip code:
PALOMAR PRODUCTS, INC (23042 ARROYO VISTA in RANCHO SANTA M, CA; small business) : $19,898,950 in 224 contractsfrom 1999 to 2006
Contracts for Miscellaneous Communication Equipment, Radio and Television Communication Equipment, Airborne, Intercommunication and Public Address Systems, Airborne, Communications Security Equipment and Components, and moreby Navy, Air Force, Financial Crimes Enforcement Network, Defense Logistics Agency, and others Signed by year:2000: $2,499,455; 2001: $7,542,265; 2002: $4,618,114; 2003: $2,531,390; 2004: $1,650,088; 2005: $633,374; 2006: $259,893.
Biggest contracts:
$1,923,864 with Navy for Miscellaneous Communication Equipment. Signed on 2001-05-02. Completion date: 2003-05-02.
$1,810,931, same as above.Signed on 2000-08-03. Completion date: 2001-08-03.
$1,707,503 with Air Force for Miscellaneous Communication Equipment. Signed on 2002-04-30. Completion date: 2003-05-31.
$1,243,820 with Air Force for Radio and Television Communication Equipment, Airborne. Signed on 2001-02-21. Completion date: 2002-02-28.
BOSS INNOVATION & MARKETING (30211 AVENIDA DE LAS in RANCHO SANTA MARGARI, CA; small business) 4 employees, $150000 revenue. : $1,454,390 in 27 contractsfrom 2003 to 2006
Contracts for Miscellaneous Alarm, Signal and Security Detection Systems, Radio and Television Communication Equipment, Except Airborne, ADP Software, Guns, through 30 mm, and moreby U.S. Customs Service, Air Force, Bureau of Immigration and Customs Enforcement, Federal Law Enforcement Training Center, and others Signed by year:2000: $0; 2001: $0; 2002: $0; 2003: $972,044; 2004: $50,508; 2005: $143,031; 2006: $288,807.
Biggest contracts:
$972,044 with U.S. Customs Service for Miscellaneous Alarm, Signal and Security Detection Systems. Signed on 2003-09-15. Completion date: 2003-11-15.
$114,798 with Air Force for Radio and Television Communication Equipment, Except Airborne. Signed on 2006-06-07. Completion date: 2006-06-22.
$63,750 with Bureau of Immigration and Customs Enforcement for ADP Software. Signed on 2006-06-13. Completion date: 2006-07-13.
$45,491 with U.S. Customs Service for Miscellaneous Alarm, Signal and Security Detection Systems. Taking place in TX. Signed on 2005-08-15. Completion date: 2005-09-23.
ULTIMATE KNOWLEDGE CORP (30021 TOMAS ST, STE 300 in RANCHO SANTA M, CA; small business) : $209,150 in 2 contractsfrom 2003 to 2004
$199,550 with Navy for Educational Services. Taking place in NC. Signed on 2003-07-11. Completion date: 2003-09-30.
$9,600 with Navy for ADPE System Configuration. Signed on 2004-10-25. Completion date: 2004-11-09.
UNICON INC (31441 SANTA MARGARITA PKW in RCHO STA MARG, CA; small business) : $194,780 in 2 contractsin 2005
$99,890 with Air Force for Defense Electronics and Communication Equipment -- Applied Research and Exploratory Development (R&D). Signed on 2005-03-03. Completion date: 2005-10-31.
$94,890, same as above.Signed on 2005-03-03. Completion date: 2005-10-31.
PERRY, THOMAS A & ASSOCIATES I (15 LEDGEWOOD DR in RCHO STA MARG, CA; small business)
$89,000 with Air Force for Modification of Equipment -- Guided Missiles. Signed on 2000-09-27. Completion date: 2000-12-30.
SMART MEDICAL TECHNOLOGIES, IN (22562 EMPRESA in RANCHO SANTA M, CA; small business) : $70,000 in 2 contractsfrom 2003 to 2005
$40,000 with Army for Laboratory Equipment and Supplies. Taking place in MD. Signed on 2003-09-10. Completion date: 2003-12-19.
$30,000 with Army for Laboratory Equipment and Supplies. Signed on 2005-06-09. Completion date: 2005-08-31.
PUGLIESE INTERIOR SYSTEMS INC (30182 ESPERANZA RD in RANCHO SANTA M, CA; small business) : $66,087 in 3 contractsfrom 2005 to 2006
$28,000 with Navy for Nonwood Construction Lumber and Related Materials. Signed on 2005-12-05. Completion date: 2006-01-20.
$25,137 with U.S. Customs Service for Construction of Structures and Facilities -- Office Buildings. Signed on 2005-09-07. Completion date: 2005-09-08.
$12,950 with Navy for Nonwood Construction Lumber and Related Materials. Signed on 2006-01-26. Completion date: 2006-02-20.
M M D COMPONENTS (30400 ESPERANZA in RANCHO SANTA M, CA; small business) : $54,717 in 7 contractsfrom 2004 to 2006
Contracts for Oscillators and Piezoelectric Crystals by Army, Defense Logistics Agency Signed by year:2000: $0; 2001: $0; 2002: $0; 2003: $0; 2004: $34,741; 2005: $8,476; 2006: $11,500.
Biggest contracts:
$29,365 with Army for Oscillators and Piezoelectric Crystals. Signed on 2004-05-18. Completion date: 2004-10-15.
$11,500 with Defense Logistics Agency for Oscillators and Piezoelectric Crystals. Signed on 2006-05-11. Completion date: 2006-10-27.
$4,480 with Army for Oscillators and Piezoelectric Crystals. Signed on 2005-02-09. Completion date: 2005-02-21.
$4,480, same as above.Signed on 2004-12-09. Completion date: 2005-02-21.
AMERICAN PARTITIONS INC (29722 AVENIDA DE LAS BANDE in RCHO STA MARG, CA; small business) : $52,828 in 6 contractsfrom 2003 to 2006
Contracts for Miscellaneous Construction Equipment, Rigid Wall Shelters, Other Special Studies and Analyses by Army, Air Force, Navy Signed by year:2000: $0; 2001: $0; 2002: $0; 2003: $28,538; 2004: $20,710; 2005: $1,330; 2006: $2,250.
Biggest contracts:
$28,538 with Army for Miscellaneous Construction Equipment. Taking place in HI. Signed on 2003-09-29. Completion date: 2004-01-09.
$20,710 with Air Force for Rigid Wall Shelters. Signed on 2004-09-22. Completion date: 2004-10-29.
$2,250 with Navy for Other Special Studies and Analyses. Signed on 2006-04-24. Completion date: 2006-05-23.
$1,330 with Air Force for Rigid Wall Shelters. Signed on 2005-03-08. Completion date: 2005-03-31.
DE NAULT'S HARDWARE-HOME CENTE (23281 ANTONIO PKWY in RCHO STA MARG, CA; small business) : $39,999 in 3 contractsin 2005
$19,999 with Navy for Hardware, Commercial. Signed on 2005-04-27. Completion date: 2005-09-30.
$15,000 with Navy for Miscellaneous Items. Signed on 2005-08-11. Completion date: 2005-09-30.
$5,000 with Navy for Hardware, Commercial. Signed on 2005-01-19. Completion date: 2005-09-30.
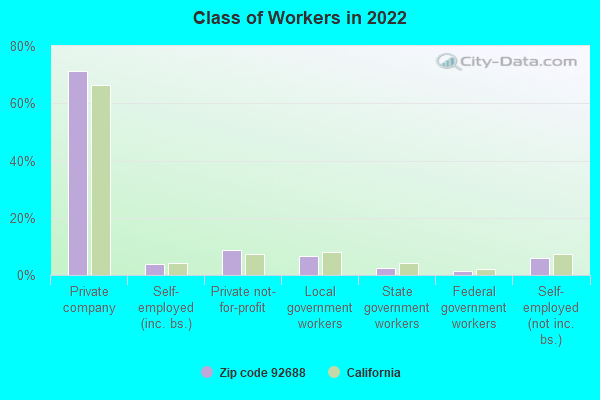
Top industries in this zip code by the number of employees in 2005:
Administrative and Support and Waste Management and Remediation Services: Temporary Help Services (over 1000 employees: 1 establishment, 5-9 employees: 1 establishment)
Administrative and Support and Waste Management and Remediation Services: Landscaping Services (500-999: 1, 50-99: 1, 20-49: 1, 5-9: 2, 1-4: 5)
Information: Internet Service Providers (500-999: 1, 1-4: 1)


 Nearest zip codes: 92679, 92692, 92691, 92694, 92630, 92653.