Estimated zip code population in 2022: 45,595 Zip code population in 2010: 47,222 Zip code population in 2000: 46,210
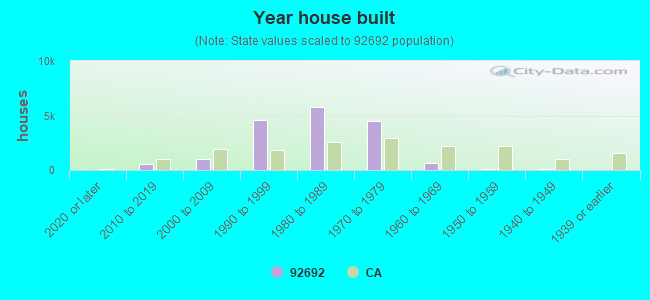
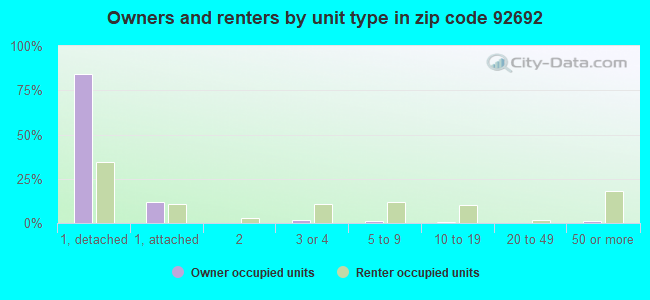
Houses and condos: 17,792 Renter-occupied apartments: 3,824
% of renters here:
22%
State:
44%
March 2022 cost of living index in zip code 92692: 87.3 (less than average, U.S. average is 100)
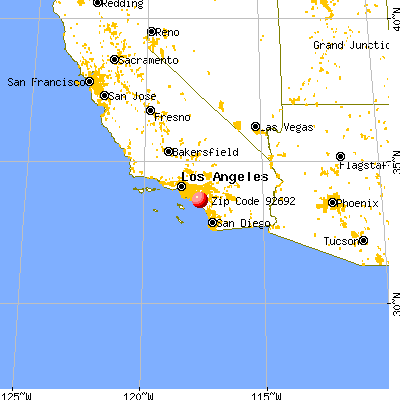
Land area: 9.9 sq. mi. Water area: 0.3 sq. mi.
Population density: 4,628 people per square mile
(average).
OSM Map
General Map
Google Map
MSN Map
OSM Map
General Map
Google Map
MSN Map
OSM Map
General Map
Google Map
MSN Map
OSM Map
General Map
Google Map
MSN Map
Please wait while loading the map...
Real estate property taxes paid for housing units in 2022:
This zip code:
0.6% ($6,228)
California:
0.7% ($4,831)
Median real estate property taxes paid for housing units with mortgages in 2022: $6,583 (0.7%) Median real estate property taxes paid for housing units with no mortgage in 2022: $5,240 (0.6%)
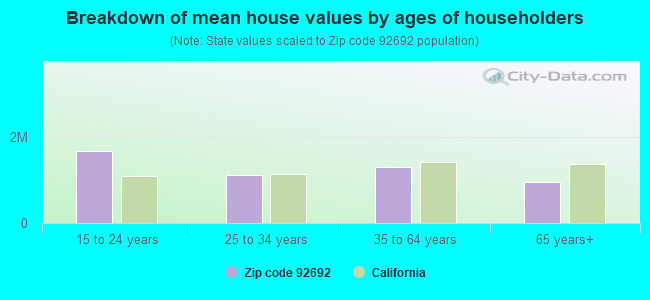
Estimated median house/condo value in 2022: $980,521
92692:
$980,521
California:
$715,900
According to our research of California and other state lists, there were 6 registered sex offenders living in 92692 zip code as of April 27, 2024. The ratio of all residents to sex offenders in zip code 92692 is 8,259 to 1. The ratio of registered sex offenders to all residents in this zip code is much lower than the state average.
Median resident age:
This zip code:
47.9 years
California median age:
37.9 years
Average household size:
This zip code:
2.7 people
California:
2.8 people
Averages for the 2020 tax year for zip code 92692, filed in 2021:
Average Adjusted Gross Income (AGI) in 2020: $117,997 (Individual Income Tax Returns)
Here:
$117,997
State:
$95,910
Salary/wage: $102,114 (reported on 75.4% of returns)
Here:
$102,114
State:
$77,331
(% of AGI for various income ranges: 1189.3% for AGIs below $25k, 3756.1% for AGIs $25k-50k, 6801.8% for AGIs $50k-75k, 9856.7% for AGIs $75k-100k, 20817.8% for AGIs $100k-200k, 90148.1% for AGIs over 200k)
Taxable interest for individuals: $1,903 (reported on 52.4% of returns)
This zip code:
$1,903
California:
$2,294
(% of AGI for various income ranges: 46.6% for AGIs below $25k, 68.3% for AGIs $25k-50k, 140.5% for AGIs $50k-75k, 140.3% for AGIs $75k-100k, 240.8% for AGIs $100k-200k, 1001.6% for AGIs over 200k)
Ordinary dividends: $6,776 (reported on 34.3% of returns)
Here:
$6,776
State:
$10,949
(% of AGI for various income ranges: 66.7% for AGIs below $25k, 129.7% for AGIs $25k-50k, 226.3% for AGIs $50k-75k, 338.0% for AGIs $75k-100k, 552.0% for AGIs $100k-200k, 2693.7% for AGIs over 200k)
Net capital gain/loss in AGI: +$19,924 (reported on 33.4% of returns)
Here:
+$19,924
State:
+$49,306
(% of AGI for various income ranges: 15.5% for AGIs below $25k, 80.3% for AGIs $25k-50k, 194.7% for AGIs $50k-75k, 319.2% for AGIs $75k-100k, 827.9% for AGIs $100k-200k, 12253.3% for AGIs over 200k)
Profit/loss from business: +$17,261 (reported on 19.5% of returns)
Here:
+$17,261
State:
+$15,671
(% of AGI for various income ranges: 153.4% for AGIs below $25k, 291.0% for AGIs $25k-50k, 388.1% for AGIs $50k-75k, 607.4% for AGIs $75k-100k, 910.1% for AGIs $100k-200k, 2989.2% for AGIs over 200k)
Taxable individual retirement arrangement distribution: $24,771 (reported on 14.1% of returns)
92692:
$24,771
California:
$23,505
(% of AGI for various income ranges: 113.3% for AGIs below $25k, 261.1% for AGIs $25k-50k, 528.7% for AGIs $50k-75k, 797.6% for AGIs $75k-100k, 1229.1% for AGIs $100k-200k, 2267.9% for AGIs over 200k)
Self-employed (Keogh) retirement plans: $21,062 (reported on 1.5% of returns)
92692:
$21,062
California:
$30,163
(% of AGI for various income ranges: 17.6% for AGIs $50k-75k, 27.3% for AGIs $75k-100k, 74.4% for AGIs $100k-200k, 500.1% for AGIs over 200k)
Total itemized deductions: $35,478 (reported on 28.1% of returns)
Here:
$35,478
State:
$39,517
(% of AGI for various income ranges: 239.9% for AGIs below $25k, 448.6% for AGIs $25k-50k, 1062.5% for AGIs $50k-75k, 1669.2% for AGIs $75k-100k, 3211.1% for AGIs $100k-200k, 9527.6% for AGIs over 200k)
Charity contributions: $7,247 (reported on 24.6% of returns)
Here:
$7,247
State:
$12,598
(% of AGI for various income ranges: 11.8% for AGIs below $25k, 36.2% for AGIs $25k-50k, 120.0% for AGIs $50k-75k, 190.6% for AGIs $75k-100k, 496.1% for AGIs $100k-200k, 2329.3% for AGIs over 200k)
Taxes paid: $8,972 (reported on 28.1% of returns)
92692:
$8,972
State:
$8,807
(% of AGI for various income ranges: 42.4% for AGIs below $25k, 95.8% for AGIs $25k-50k, 254.6% for AGIs $50k-75k, 474.3% for AGIs $75k-100k, 930.0% for AGIs $100k-200k, 2160.1% for AGIs over 200k)
Earned income credit: $1,563 (reported on 5.8% of returns)
Here:
$1,563
State:
$2,074
(% of AGI for various income ranges: 38.6% for AGIs below $25k, 36.7% for AGIs $25k-50k)
Percentage of individuals using paid preparers for their 2020 taxes: 92.3%
Here:
92%
State:
92%
(% for various income ranges: 90.2% for AGIs below $25k, 91.8% for AGIs $25k-50k, 92.4% for AGIs $50k-75k, 92.6% for AGIs $75k-100k, 93.1% for AGIs $100k-200k, 94.5% for AGIs over 200k)
Averages for the 2012 tax year for zip code 92692, filed in 2013:
Average Adjusted Gross Income (AGI) in 2012: $94,551 (Individual Income Tax Returns)
Here:
$94,551
State:
$72,726
Salary/wage: $86,416 (reported on 78.9% of returns)
Here:
$86,416
State:
$59,079
(% of AGI for various income ranges: 69.4% for AGIs below $25k, 68.1% for AGIs $25k-50k, 64.9% for AGIs $50k-75k, 66.7% for AGIs $75k-100k, 76.4% for AGIs $100k-200k, 72.0% for AGIs over 200k)
Taxable interest for individuals: $1,868 (reported on 52.6% of returns)
This zip code:
$1,868
California:
$2,146
(% of AGI for various income ranges: 2.2% for AGIs below $25k, 1.3% for AGIs $25k-50k, 1.2% for AGIs $50k-75k, 1.1% for AGIs $75k-100k, 0.8% for AGIs $100k-200k, 1.0% for AGIs over 200k)
Ordinary dividends: $5,393 (reported on 32.1% of returns)
Here:
$5,393
State:
$9,308
(% of AGI for various income ranges: 3.5% for AGIs below $25k, 2.1% for AGIs $25k-50k, 2.1% for AGIs $50k-75k, 2.0% for AGIs $75k-100k, 1.3% for AGIs $100k-200k, 2.0% for AGIs over 200k)
Net capital gain/loss in AGI: +$7,778 (reported on 29.6% of returns)
Here:
+$7,778
State:
+$30,460
(% of AGI for various income ranges: 0.5% for AGIs $50k-75k, 0.5% for AGIs $75k-100k, 1.0% for AGIs $100k-200k, 5.2% for AGIs over 200k)
Profit/loss from business: +$18,841 (reported on 19.6% of returns)
Here:
+$18,841
State:
+$17,064
(% of AGI for various income ranges: 10.6% for AGIs below $25k, 8.1% for AGIs $25k-50k, 5.5% for AGIs $50k-75k, 4.4% for AGIs $75k-100k, 3.6% for AGIs $100k-200k, 2.5% for AGIs over 200k)
Taxable individual retirement arrangement distribution: $19,754 (reported on 14.7% of returns)
92692:
$19,754
California:
$19,557
(% of AGI for various income ranges: 5.4% for AGIs below $25k, 4.9% for AGIs $25k-50k, 5.1% for AGIs $50k-75k, 4.9% for AGIs $75k-100k, 3.1% for AGIs $100k-200k, 1.8% for AGIs over 200k)
Self-employment retirement plans: $19,915 (reported on 1.5% of returns)
92692:
$19,915
California:
$24,530
(% of AGI for various income ranges: 0.2% for AGIs $25k-50k, 0.2% for AGIs $50k-75k, 0.2% for AGIs $75k-100k, 0.3% for AGIs $100k-200k, 0.5% for AGIs over 200k)
Total itemized deductions: $34,912 (24% of AGI, reported on 54.4% of returns)
Here:
$34,912
State:
$34,004
Here:
23.7% of AGI
State:
22.7% of AGI
(% of AGI for various income ranges: 22.0% for AGIs below $25k, 19.0% for AGIs $25k-50k, 21.1% for AGIs $50k-75k, 22.4% for AGIs $75k-100k, 22.2% for AGIs $100k-200k, 17.5% for AGIs over 200k)
Charity contributions: $4,082 (reported on 48.7% of returns)
Here:
$4,082
State:
$4,659
(% of AGI for various income ranges: 1.4% for AGIs below $25k, 1.7% for AGIs $25k-50k, 2.0% for AGIs $50k-75k, 2.3% for AGIs $75k-100k, 2.3% for AGIs $100k-200k, 2.0% for AGIs over 200k)
Taxes paid: $14,099 (reported on 54.4% of returns)
92692:
$14,099
State:
$14,448
(% of AGI for various income ranges: 4.3% for AGIs below $25k, 4.3% for AGIs $25k-50k, 5.7% for AGIs $50k-75k, 6.9% for AGIs $75k-100k, 8.4% for AGIs $100k-200k, 9.5% for AGIs over 200k)
Earned income credit: $1,793 (reported on 6.7% of returns)
Here:
$1,793
State:
$2,286
(% of AGI for various income ranges: 2.8% for AGIs below $25k, 0.5% for AGIs $25k-50k)
Percentage of individuals using paid preparers for their 2012 taxes: 62.5%
Here:
63%
State:
64%
(% for various income ranges: 53.3% for AGIs below $25k, 61.2% for AGIs $25k-50k, 65.1% for AGIs $50k-75k, 68.3% for AGIs $75k-100k, 66.1% for AGIs $100k-200k, 74.2% for AGIs over 200k)
Averages for the 2004 tax year for zip code 92692, filed in 2005:
Average Adjusted Gross Income (AGI) in 2004: $81,756 (Individual Income Tax Returns)
Here:
$81,756
State:
$58,600
Salary/wage: $75,311 (reported on 80.0% of returns)
Here:
$75,311
State:
$49,455
(% of AGI for various income ranges: 498.4% for AGIs below $10k, 65.8% for AGIs $10k-25k, 68.9% for AGIs $25k-50k, 69.5% for AGIs $50k-75k, 78.2% for AGIs $75k-100k, 73.3% for AGIs over 100k)
Taxable interest for individuals: $2,097 (reported on 64.7% of returns)
This zip code:
$2,097
California:
$2,365
(% of AGI for various income ranges: 36.5% for AGIs below $10k, 5.0% for AGIs $10k-25k, 2.9% for AGIs $25k-50k, 2.3% for AGIs $50k-75k, 1.5% for AGIs $75k-100k, 1.2% for AGIs over 100k)
Taxable dividends: $3,018 (reported on 38.4% of returns)
Here:
$3,018
State:
$4,746
(% of AGI for various income ranges: 32.3% for AGIs below $10k, 3.3% for AGIs $10k-25k, 2.1% for AGIs $25k-50k, 1.8% for AGIs $50k-75k, 1.4% for AGIs $75k-100k, 1.1% for AGIs over 100k)
Net capital gain/loss: +$14,678 (reported on 34.7% of returns)
Here:
+$14,678
State:
+$23,418
(% of AGI for various income ranges: 1.3% for AGIs below $10k, 0.5% for AGIs $10k-25k, 0.3% for AGIs $25k-50k, 0.6% for AGIs $50k-75k, 0.7% for AGIs $75k-100k, 9.0% for AGIs over 100k)
Profit/loss from business: +$20,936 (reported on 19.8% of returns)
Here:
+$20,936
State:
+$16,826
(% of AGI for various income ranges: 30.9% for AGIs below $10k, 8.8% for AGIs $10k-25k, 6.8% for AGIs $25k-50k, 6.4% for AGIs $50k-75k, 5.6% for AGIs $75k-100k, 4.3% for AGIs over 100k)
IRA payment deduction: $3,519 (reported on 4.2% of returns)
92692:
$3,519
California:
$3,192
(% of AGI for various income ranges: 1.7% for AGIs below $10k, 0.3% for AGIs $10k-25k, 0.3% for AGIs $25k-50k, 0.2% for AGIs $50k-75k, 0.3% for AGIs $75k-100k, 0.1% for AGIs over 100k)
Self-employed pension: $16,969 (reported on 2.4% of returns)
Here:
$16,969
California:
$17,688
(% of AGI for various income ranges: 0.2% for AGIs $10k-25k, 0.3% for AGIs $25k-50k, 0.3% for AGIs $50k-75k, 0.4% for AGIs $75k-100k, 0.6% for AGIs over 100k)
Total itemized deductions: $31,442 (26% of AGI, reported on 59.4% of returns)
Here:
$31,442
State:
$28,113
Here:
25.7% of AGI
State:
25.3% of AGI
(% of AGI for various income ranges: 153.1% for AGIs below $10k, 25.9% for AGIs $10k-25k, 24.8% for AGIs $25k-50k, 27.6% for AGIs $50k-75k, 27.4% for AGIs $75k-100k, 20.6% for AGIs over 100k)
Charity contributions deductions: $3,859 (3% of AGI, reported on 55.2% of returns)
Here:
$3,859
State:
$3,923
Here:
3.1% of AGI
State:
3.3% of AGI
(% of AGI for various income ranges: 5.8% for AGIs below $10k, 2.0% for AGIs $10k-25k, 2.4% for AGIs $25k-50k, 2.8% for AGIs $50k-75k, 2.9% for AGIs $75k-100k, 2.6% for AGIs over 100k)
Total tax: $14,061 (reported on 82.9% of returns)
92692:
$14,061
State:
$10,761
(% of AGI for various income ranges: 21.1% for AGIs below $10k, 5.0% for AGIs $10k-25k, 7.4% for AGIs $25k-50k, 8.8% for AGIs $50k-75k, 9.4% for AGIs $75k-100k, 17.1% for AGIs over 100k)
Earned income credit: $1,360 (reported on 4.5% of returns)
Here:
$1,360
State:
$1,763
Percentage of individuals using paid preparers for their 2004 taxes: 64.2%
Here:
64%
State:
66%
(% for various income ranges: 51.2% for AGIs below $10k, 59.0% for AGIs $10k-25k, 64.6% for AGIs $25k-50k, 69.4% for AGIs $50k-75k, 68.5% for AGIs $75k-100k, 70.2% for AGIs over 100k)
Likely homosexual households (counted as self-reported same-sex unmarried-partner households)
Lesbian couples: 0.1% of all households
Gay men: 0.1% of all households
Household received Food Stamps/SNAP in the past 12 months: 866 Household did not receive Food Stamps/SNAP in the past 12 months: 15,831
Women who had a birth in the past 12 months: 402 (384 now married, 15 unmarried) Women who did not have a birth in the past 12 months: 8,033 (4,362 now married, 3,622 unmarried)
Housing units in zip code 92692 with a mortgage: 9,758 (1,034 second mortgage, 19 home equity loan, 906 both second mortgage and home equity loan) Houses without a mortgage: 259
Median monthly owner costs for units with a mortgage: $3,135 Median monthly owner costs for units without a mortgage: $848
Residents with income below the poverty level in 2022:
This zip code:
4.9%
Whole state:
12.2%
Residents with income below 50% of the poverty level in 2022:
This zip code:
2.7%
Whole state:
6.2%
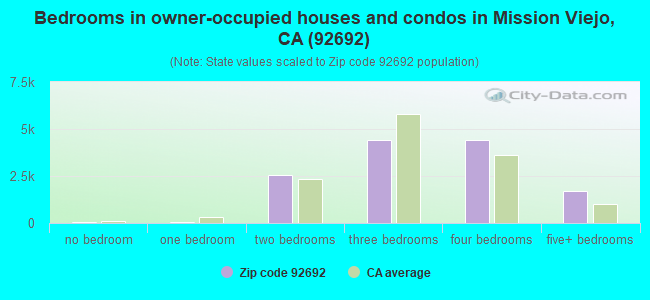
Median number of rooms in houses and condos:
Here:
6.6
State:
6.0
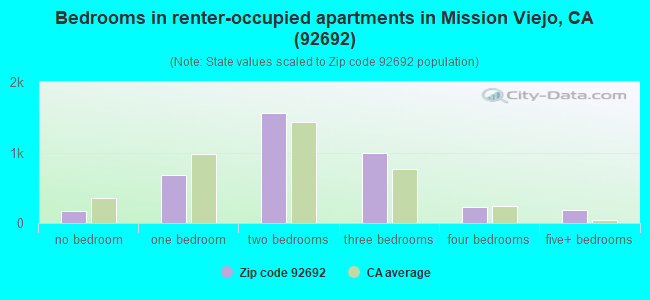
Median number of rooms in apartments:
Here:
4.2
State:
3.9
Notable locations in this zip code not listed on our city pages
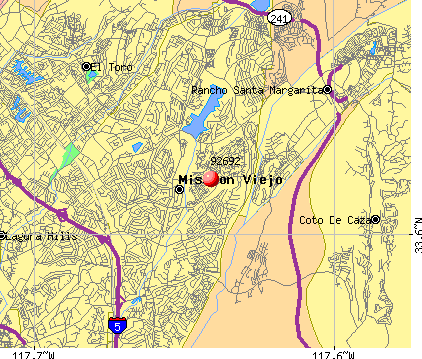
Notable locations in zip code 92692: Felipe Tennis Center (A), Casta Del Sol Golf Course (B), Orange County Fire Authority Station 24 (C), Orange County Fire Authority Station 31 (D). Display/hide their locations on the map
Parks in zip code 92692 include: Flamenco Park (1), Melinda Park (2), Mission Viejo Youth Athletic Park (3), Cordova Park (4), Coronado Park (5). Display/hide their locations on the map
6,808 married couples with children.
919 single-parent households (306 men, 613 women).
68.8% of residents of 92692 zip code speak English at home.
10.3% of residents speak Spanish at home (70% very well, 15% well, 10% not well, 4% not at all).
8.1% of residents speak other Indo-European language at home (78% very well, 19% well, 3% not well, 1% not at all).
10.6% of residents speak Asian or Pacific Island language at home (51% very well, 33% well, 15% not well, 1% not at all).
2.6% of residents speak other language at home (79% very well, 8% well, 13% not well).
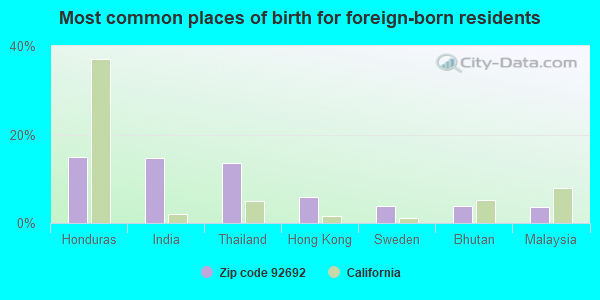
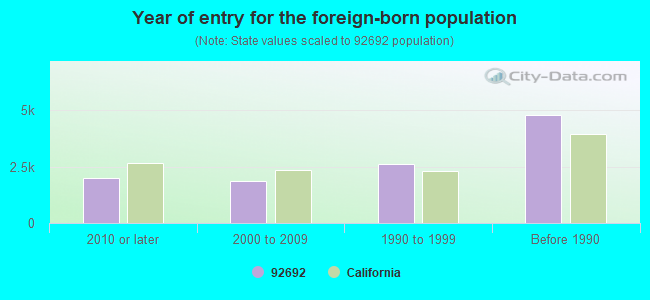
Foreign born population: 10,584 (23.2%) (73.6% of them are naturalized citizens)
Major facilities with environmental interests located in this zip code:
JIFFY LUBE #1053 (27240 LA PAZ RD in MISSION VIEJO, CA)
STATE MASTER (California - Hazardous Waste Tracking) - HAZARDOU WASTE PROGRAM Small Quantity Generators, between 100 kg and 1000 kg of hazardous waste/month (Resource Conservation and Recovery Act (tracking hazardous waste)) - notification STATE MASTER (California - Used Oil Recycling System ) - USED OIL RECYCLING Organizations: ALLIED LUBE INC (CONTACT/OWNER)
Alternative names: JIFFY LUBE NO 1053
EXXONMOBIL OIL CORPORATION (23002 ALICIA PARKWAY in MISSION VIEJO, CA)
Large Quantity Generators, more that 1000 kg of hazardous waste/month (Resource Conservation and Recovery Act (tracking hazardous waste)) HAZARDOUS WASTE BIENNIAL REPORTER (Resource Conservation and Recovery Act (tracking hazardous waste)) Large Quantity Generators, more that 1000 kg of hazardous waste/month (Resource Conservation and Recovery Act (tracking hazardous waste)) Alternative names: MOBIL OIL CORP ADR
ACURA SAAB OF MISSION VIEJO (28802 MARGUERITE PKWY in MISSION VIEJO, CA)
STATE MASTER (California - Hazardous Waste Tracking) - HAZARDOU WASTE PROGRAM Small Quantity Generators, between 100 kg and 1000 kg of hazardous waste/month (Resource Conservation and Recovery Act (tracking hazardous waste)) - notification Organizations: MARK MCKELLOG (CONTACT/OPERATOR)
, PARKWAY PREMIUM MOTORCARS INC (CONTACT/OWNER)
Alternative names: ACURA OF MISSION VIEJO
ADVANCED ENVIRONMENTAL SVCS INC (7 AMATO in MISSION VIEJO, CA)
STATE MASTER (California - Hazardous Waste Tracking) - HAZARDOU WASTE PROGRAM TRANSPORTER (Resource Conservation and Recovery Act (tracking hazardous waste)) Business NAICS classification: SOLID WASTE COLLECTION.; HAZARDOUS WASTE COLLECTION. Organizations: JOE WILSON (CONTACT/OPERATOR)
LAKE MISSION VIEJO ASSOCIATION (22555 OLIMPIAD RD in MISSION VIEJO, CA)
STATE MASTER (California - Hazardous Waste Tracking) - HAZARDOU WASTE PROGRAM Small Quantity Generators, between 100 kg and 1000 kg of hazardous waste/month (Resource Conservation and Recovery Act (tracking hazardous waste)) - notification
HANKEY (CARL H.) ELEMENTARY (27252 NUBLES ST. in MISSION VIEJO, CA)
(National Center for Education Statistics) - STATE ID-6098495 Organizations: CAPISTRANO UNIFIED (SCHOOL DISTRICT)
NEWHART MIDDLE (25001 VETERANS WAY in MISSION VIEJO, CA)
(National Center for Education Statistics) - STATE ID-6101125 Organizations: CAPISTRANO UNIFIED (SCHOOL DISTRICT)
CAPISTRANO VALLEY HIGH (26301 VIA ESCOLAR in MISSION VIEJO, CA)
(National Center for Education Statistics) - STATE ID-3030210 Organizations: CAPISTRANO UNIFIED (SCHOOL DISTRICT)
EXXON MOBIL OIL CORP (26052 MARGUERITE PKWY in MISSION VIEJO, CA)
HAZARDOUS WASTE BIENNIAL REPORTER (Resource Conservation and Recovery Act (tracking hazardous waste)) Large Quantity Generators, more that 1000 kg of hazardous waste/month (Resource Conservation and Recovery Act (tracking hazardous waste))
MISSION VIEJO IMPORTS (28701 MARGUERITE PKWY in MISSION VIEJO, CA)
(Resource Conservation and Recovery Act (tracking hazardous waste)) Organizations: H W PINGREE,JR (CONTACT/OWNER)
15 TRANSMISSION AUTO REPAIR (28752 MARGUERITE PARKWAY UNIT 7B in MISSION VIEJO, CA)
Small Quantity Generators, between 100 kg and 1000 kg of hazardous waste/month (Resource Conservation and Recovery Act (tracking hazardous waste)) - notification Organizations: OSCAR PENA (CONTACT/OWNER)
Alternative names: I 5 TRANSMISSION AUTO RPR, PRINT CO
79 CLEANERS (28181 MARGUERITE PKWY in MISSION VIEJO, CA)
Small Quantity Generators, between 100 kg and 1000 kg of hazardous waste/month (Resource Conservation and Recovery Act (tracking hazardous waste)) Organizations: DIAH VU (CONTACT/OWNER)
HOME DEPOT USA INC HD 0614 (27952 HILLCREST in MISSION VIEJO, CA)
Small Quantity Generators, between 100 kg and 1000 kg of hazardous waste/month (Resource Conservation and Recovery Act (tracking hazardous waste))
Housing units lacking complete plumbing facilities: 0.5% Housing units lacking complete kitchen facilities: 1.3%
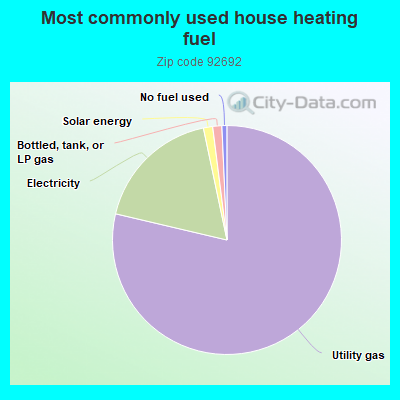
78.6%Utility gas
18.0%Electricity
1.3%Solar energy
1.3%Bottled, tank, or LP gas
0.7%No fuel used
Population in 1990: 30,777. Population change in the 1990s: +15,433 (+50.1%).
Place of birth for U.S.-born residents:
This state: 22,922
Northeast: 3,220
Midwest: 4,050
South: 1,848
West: 1,967
53% of the 92692 zip code residents lived in the same house 5 years ago. Out of people who lived in different houses, 65% lived in this county. Out of people who lived in different counties, 50% lived in California.
91% of the 92692 zip code residents lived in the same house 1 year ago. Out of people who lived in different houses, 71% moved from this county. Out of people who lived in different houses, 10% moved from different county within same state. Out of people who lived in different houses, 13% moved from different state. Out of people who lived in different houses, 5% moved from abroad.
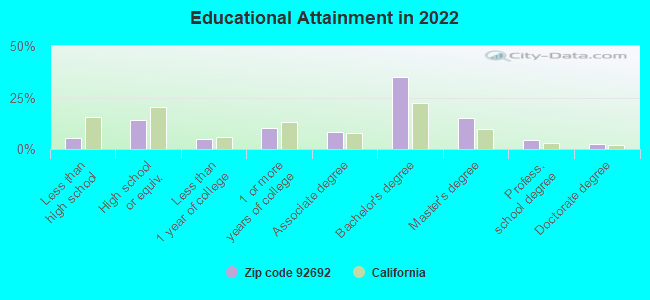
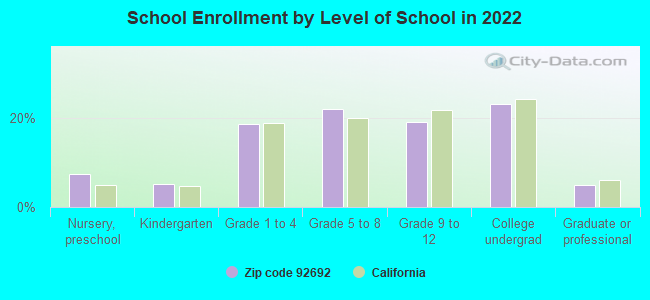
Private vs. public school enrollment:
Students in private schools in grades 1 to 8 (elementary and middle school): 1,154
Here:
27.9%
California:
10.5%
Students in private schools in grades 9 to 12 (high school): 253
Here:
13.3%
California:
8.5%
Students in private undergraduate colleges: 262
Here:
11.4%
California:
15.9%
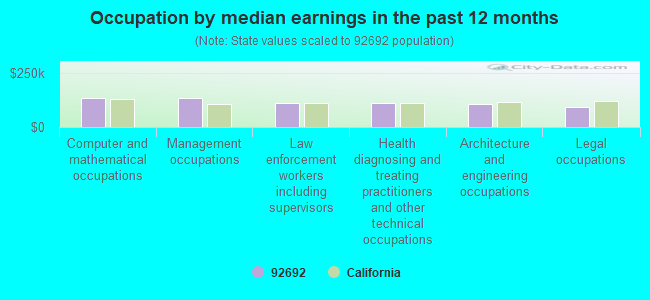
Occupation by median earnings in the past 12 months ($)
136,800Computer and mathematical occupations
135,256Management occupations
113,830Law enforcement workers including supervisors
110,249Health diagnosing and treating practitioners and other technical occupations
107,358Architecture and engineering occupations
92,270Legal occupations
Companies with federal contracts located in this zip code (MISSION VIEJO, CA):
SATISH AGARWAL (22221 CRYSTAL POND; small business) : $48,482 in 3 contractsin 2005
$18,900 with Navy for ADP Components. Signed on 2005-12-21. Completion date: 2005-12-29.
$18,900 with Navy for Maintenance, Repair and Rebuilding of Equipment -- Electrical and Electronic Equipment Components. Signed on 2005-01-10. Completion date: 2005-12-31.
$10,682 with Navy for ADP Support Equipment. Signed on 2005-07-12. Completion date: 2005-07-25.
BIRD B GONE, INC (24362 VIA MADRUGADA; small business)
$38,010 with U.S. Army Corps of Engineers - civil program financing only for Pest, Disease, and Frost Control Equipment. Taking place in OR. Signed on 2000-03-16. Completion date: 2000-03-21.
MCD EQUIPMENT (28182 VIA CHOCANO; small business)
$32,400 with Air Force for Miscellaneous Materials Handling Equipment. Taking place in OH. Signed on 2000-10-19. Completion date: 2000-12-13.
BITEC IMAGING TECHNOLOGIES INC (24062 CALENDULA; small business)
$5,565 with Navy for Communications Security Equipment and Components. Signed on 2005-05-19. Completion date: 2005-05-20.
MOBILE-TRONICS CO , INC (28570 MARGUERITE PKWY # 21)
$5,337 with Army for ADP Components. Taking place in AZ. Signed on 2004-09-18. Completion date: 2004-08-23.
CHAMPA ASSOCIATES (27521 TIARA DRIVE; small business)
$3,980 with Navy for Electrical Hardware and Supplies. Signed on 2004-05-18. Completion date: 2004-06-15.
Top industries in this zip code by the number of employees in 2005:
Health Care and Social Assistance: Child and Youth Services (100-249: 1)
Other Services (except Public Administration): Other Similar Organizations (except Business, Professional, Labor, and Political Organizations) (100-249: 1)
Other Services (except Public Administration): Religious Organizations (50-99: 1, 20-49: 1, 10-19: 1, 5-9: 2, 1-4: 1)
Accommodation and Food Services: Snack and Nonalcoholic Beverage Bars (20-49: 3, 10-19: 1, 5-9: 2, 1-4: 2)
People in group quarters in 2010:
9 people in group homes intended for adults
5 people in residential treatment centers for adults
5 people in workers' group living quarters and job corps centers
4 people in nursing facilities/skilled-nursing facilities
People in group quarters in 2000:
112 people in other noninstitutional group quarters
5 people in nursing homes
Home Mortgage Disclosure Act Aggregated Statistics For Year 2009 (Based on 14 full and 10 partial tracts)
A) FHA, FSA/RHS & VA Home Purchase Loans
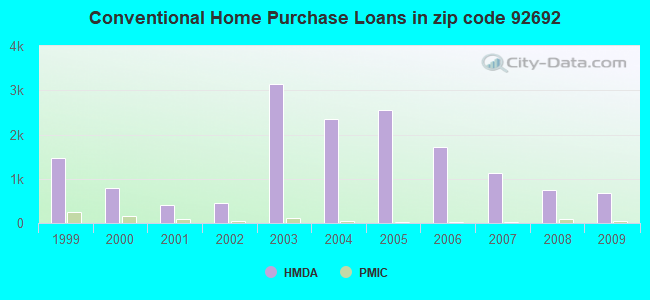
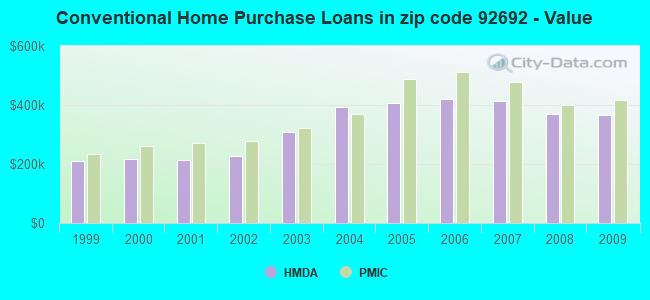
B) Conventional Home Purchase Loans
C) Refinancings
D) Home Improvement Loans
F) Non-occupant Loans on < 5 Family Dwellings (A B C & D)
G) Loans On Manufactured Home Dwelling (A B C & D)
Number
Average Value
Number
Average Value
Number
Average Value
Number
Average Value
Number
Average Value
Number
Average Value
LOANS ORIGINATED
302
$409,967
684
$366,769
3,804
$331,953
149
$252,079
181
$280,152
0
$0
APPLICATIONS APPROVED, NOT ACCEPTED
21
$364,646
62
$418,294
432
$366,564
17
$227,321
12
$305,999
1
$206,310
APPLICATIONS DENIED
39
$418,347
103
$369,522
950
$380,699
49
$148,095
72
$314,602
0
$0
APPLICATIONS WITHDRAWN
35
$390,658
95
$391,790
641
$361,761
28
$238,537
41
$282,648
0
$0
FILES CLOSED FOR INCOMPLETENESS
5
$363,026
31
$361,812
160
$368,979
5
$301,880
7
$248,117
0
$0
Aggregated Statistics For Year 2008 (Based on 14 full and 10 partial tracts)
A) FHA, FSA/RHS & VA Home Purchase Loans
B) Conventional Home Purchase Loans
C) Refinancings
D) Home Improvement Loans
F) Non-occupant Loans on < 5 Family Dwellings (A B C & D)
G) Loans On Manufactured Home Dwelling (A B C & D)
Number
Average Value
Number
Average Value
Number
Average Value
Number
Average Value
Number
Average Value
Number
Average Value
LOANS ORIGINATED
137
$463,180
739
$370,728
1,310
$347,740
149
$159,389
121
$268,967
4
$47,965
APPLICATIONS APPROVED, NOT ACCEPTED
16
$483,256
157
$350,754
264
$364,765
25
$224,817
31
$323,943
6
$70,318
APPLICATIONS DENIED
24
$436,310
198
$442,581
663
$444,419
71
$200,113
42
$281,439
6
$71,203
APPLICATIONS WITHDRAWN
27
$439,816
155
$352,846
341
$409,448
37
$210,479
22
$286,610
0
$0
FILES CLOSED FOR INCOMPLETENESS
6
$333,638
35
$386,413
102
$383,025
14
$234,702
11
$299,407
0
$0
Aggregated Statistics For Year 2007 (Based on 14 full and 10 partial tracts)
A) FHA, FSA/RHS & VA Home Purchase Loans
B) Conventional Home Purchase Loans
C) Refinancings
D) Home Improvement Loans
F) Non-occupant Loans on < 5 Family Dwellings (A B C & D)
G) Loans On Manufactured Home Dwelling (A B C & D)
Number
Average Value
Number
Average Value
Number
Average Value
Number
Average Value
Number
Average Value
Number
Average Value
LOANS ORIGINATED
1
$495,180
1,122
$414,573
2,503
$390,873
309
$240,342
220
$373,089
3
$155,393
APPLICATIONS APPROVED, NOT ACCEPTED
0
$0
253
$412,586
571
$438,516
67
$235,666
54
$356,844
4
$158,842
APPLICATIONS DENIED
0
$0
312
$389,671
1,097
$481,864
110
$247,969
75
$354,723
6
$140,190
APPLICATIONS WITHDRAWN
0
$0
126
$431,005
475
$442,145
62
$278,778
35
$451,735
0
$0
FILES CLOSED FOR INCOMPLETENESS
0
$0
47
$428,022
194
$410,312
18
$313,436
14
$464,337
0
$0
Aggregated Statistics For Year 2006 (Based on 14 full and 10 partial tracts)
A) FHA, FSA/RHS & VA Home Purchase Loans
B) Conventional Home Purchase Loans
C) Refinancings
D) Home Improvement Loans
F) Non-occupant Loans on < 5 Family Dwellings (A B C & D)
G) Loans On Manufactured Home Dwelling (A B C & D)
Number
Average Value
Number
Average Value
Number
Average Value
Number
Average Value
Number
Average Value
Number
Average Value
LOANS ORIGINATED
2
$317,395
1,724
$421,021
3,394
$417,014
477
$248,972
350
$377,706
4
$34,198
APPLICATIONS APPROVED, NOT ACCEPTED
0
$0
257
$376,228
557
$404,022
74
$252,531
42
$394,326
3
$73,923
APPLICATIONS DENIED
0
$0
424
$405,369
1,184
$464,313
145
$292,925
81
$378,507
4
$47,000
APPLICATIONS WITHDRAWN
0
$0
208
$409,924
792
$412,303
73
$337,257
41
$340,910
0
$0
FILES CLOSED FOR INCOMPLETENESS
0
$0
45
$415,485
255
$399,925
14
$243,126
23
$354,050
0
$0
Aggregated Statistics For Year 2005 (Based on 14 full and 10 partial tracts)
A) FHA, FSA/RHS & VA Home Purchase Loans
B) Conventional Home Purchase Loans
C) Refinancings
D) Home Improvement Loans
F) Non-occupant Loans on < 5 Family Dwellings (A B C & D)
G) Loans On Manufactured Home Dwelling (A B C & D)
Number
Average Value
Number
Average Value
Number
Average Value
Number
Average Value
Number
Average Value
Number
Average Value
LOANS ORIGINATED
1
$304,250
2,543
$405,941
4,241
$399,396
517
$241,324
380
$331,989
6
$178,287
APPLICATIONS APPROVED, NOT ACCEPTED
0
$0
365
$398,501
643
$395,686
57
$268,920
60
$347,645
2
$150,495
APPLICATIONS DENIED
0
$0
478
$432,813
1,010
$432,132
153
$245,078
92
$354,374
10
$129,458
APPLICATIONS WITHDRAWN
0
$0
362
$426,230
937
$388,208
140
$231,251
55
$387,301
2
$49,795
FILES CLOSED FOR INCOMPLETENESS
0
$0
76
$394,121
372
$385,574
15
$358,155
13
$350,031
0
$0
Aggregated Statistics For Year 2004 (Based on 14 full and 10 partial tracts)
A) FHA, FSA/RHS & VA Home Purchase Loans
B) Conventional Home Purchase Loans
C) Refinancings
D) Home Improvement Loans
E) Loans on Dwellings For 5+ Families
F) Non-occupant Loans on < 5 Family Dwellings (A B C & D)
G) Loans On Manufactured Home Dwelling (A B C & D)
Number
Average Value
Number
Average Value
Number
Average Value
Number
Average Value
Number
Average Value
Number
Average Value
Number
Average Value
LOANS ORIGINATED
3
$246,790
2,344
$393,413
6,117
$343,971
559
$238,489
1
$26,620,800
472
$301,995
7
$103,177
APPLICATIONS APPROVED, NOT ACCEPTED
1
$175,130
275
$361,986
832
$345,719
78
$183,227
0
$0
54
$288,457
0
$0
APPLICATIONS DENIED
1
$140,720
354
$356,572
1,081
$361,487
158
$153,135
0
$0
71
$309,041
0
$0
APPLICATIONS WITHDRAWN
2
$513,680
301
$378,260
1,228
$337,422
113
$166,966
0
$0
60
$260,092
4
$57,978
FILES CLOSED FOR INCOMPLETENESS
0
$0
89
$371,126
287
$350,587
34
$130,097
0
$0
13
$294,645
0
$0
Aggregated Statistics For Year 2003 (Based on 14 full and 10 partial tracts)
A) FHA, FSA/RHS & VA Home Purchase Loans
B) Conventional Home Purchase Loans
C) Refinancings
D) Home Improvement Loans
E) Loans on Dwellings For 5+ Families
F) Non-occupant Loans on < 5 Family Dwellings (A B C & D)
Number
Average Value
Number
Average Value
Number
Average Value
Number
Average Value
Number
Average Value
Number
Average Value
LOANS ORIGINATED
31
$215,726
3,138
$309,858
14,631
$265,602
244
$89,294
1
$6,078,100
666
$212,467
APPLICATIONS APPROVED, NOT ACCEPTED
2
$73,665
353
$300,117
1,715
$274,678
51
$110,953
0
$0
105
$245,259
APPLICATIONS DENIED
10
$279,546
394
$288,054
1,682
$293,247
89
$79,789
0
$0
95
$265,966
APPLICATIONS WITHDRAWN
3
$397,097
314
$313,778
1,962
$279,538
59
$101,201
0
$0
58
$213,065
FILES CLOSED FOR INCOMPLETENESS
3
$200,320
112
$337,903
419
$259,963
17
$50,541
0
$0
42
$200,067
Aggregated Statistics For Year 2002 (Based on 2 full and 2 partial tracts)
A) FHA, FSA/RHS & VA Home Purchase Loans
B) Conventional Home Purchase Loans
C) Refinancings
D) Home Improvement Loans
F) Non-occupant Loans on < 5 Family Dwellings (A B C & D)
Number
Average Value
Number
Average Value
Number
Average Value
Number
Average Value
Number
Average Value
LOANS ORIGINATED
16
$214,971
460
$225,627
1,648
$219,597
44
$125,300
95
$196,490
APPLICATIONS APPROVED, NOT ACCEPTED
0
$0
77
$274,552
216
$225,565
17
$71,336
13
$210,832
APPLICATIONS DENIED
2
$274,525
66
$212,996
198
$221,740
12
$98,091
14
$207,255
APPLICATIONS WITHDRAWN
0
$0
57
$228,128
276
$217,491
2
$110,920
13
$166,369
FILES CLOSED FOR INCOMPLETENESS
0
$0
18
$260,342
75
$191,762
0
$0
11
$158,205
Aggregated Statistics For Year 2001 (Based on 2 full and 2 partial tracts)
A) FHA, FSA/RHS & VA Home Purchase Loans
B) Conventional Home Purchase Loans
C) Refinancings
D) Home Improvement Loans
F) Non-occupant Loans on < 5 Family Dwellings (A B C & D)
Number
Average Value
Number
Average Value
Number
Average Value
Number
Average Value
Number
Average Value
LOANS ORIGINATED
40
$206,802
400
$212,957
1,205
$199,801
39
$68,948
68
$175,754
APPLICATIONS APPROVED, NOT ACCEPTED
1
$231,820
64
$193,310
183
$192,305
11
$66,005
9
$160,594
APPLICATIONS DENIED
6
$201,505
64
$198,112
252
$206,952
24
$61,544
7
$139,743
APPLICATIONS WITHDRAWN
11
$247,525
30
$217,569
198
$199,012
10
$63,508
19
$199,786
FILES CLOSED FOR INCOMPLETENESS
0
$0
10
$164,097
72
$209,111
1
$41,040
2
$157,505
Aggregated Statistics For Year 2000 (Based on 2 full and 2 partial tracts)
A) FHA, FSA/RHS & VA Home Purchase Loans
B) Conventional Home Purchase Loans
C) Refinancings
D) Home Improvement Loans
F) Non-occupant Loans on < 5 Family Dwellings (A B C & D)
Number
Average Value
Number
Average Value
Number
Average Value
Number
Average Value
Number
Average Value
LOANS ORIGINATED
40
$184,888
786
$217,455
307
$152,294
57
$37,151
33
$171,727
APPLICATIONS APPROVED, NOT ACCEPTED
4
$202,708
172
$234,902
46
$127,274
19
$33,847
6
$128,108
APPLICATIONS DENIED
6
$206,885
123
$219,617
123
$147,340
37
$25,738
4
$177,130
APPLICATIONS WITHDRAWN
4
$204,092
84
$207,654
94
$128,649
16
$34,687
2
$72,520
FILES CLOSED FOR INCOMPLETENESS
0
$0
26
$218,433
45
$197,810
6
$29,802
2
$221,840
Aggregated Statistics For Year 1999 (Based on 2 full and 4 partial tracts)
A) FHA, FSA/RHS & VA Home Purchase Loans
B) Conventional Home Purchase Loans
C) Refinancings
D) Home Improvement Loans
E) Loans on Dwellings For 5+ Families
F) Non-occupant Loans on < 5 Family Dwellings (A B C & D)


 Nearest zip codes: 92691, 92688, 92679, 92653, 92630, 92694.