Dana Point: Fire Incidents, California (CA)
Where are fire incidents reported in Dana Point, CA
Something went wrong! Please refresh the page.
|
| |||||||||||||||||||||||||||||||||||||||||||||||||||||||||||||||||||||||||||||||||||||||||||||||||||||||||||||
2005 - 2018 National Fire Incident Reporting System (NFIRS) incidents
- Incident types reported to NFIRS in Dana Point, CA
- 10,22771.6%Rescue & EMS
- 1,51610.6%Good Intent Call
- 8856.2%Service Call
- 5934.2%Fire
- 5834.1%False Alarm
- 4653.3%Hazardous Condition
- 170.1%Overpressure Rupture
- Fire incident types reported to NFIRS in Dana Point, CA
- 22237.4%Structure Fires
- 19332.5%Outside Fires
- 12220.6%Mobile Property/Vehicle Fires
- 569.4%Other
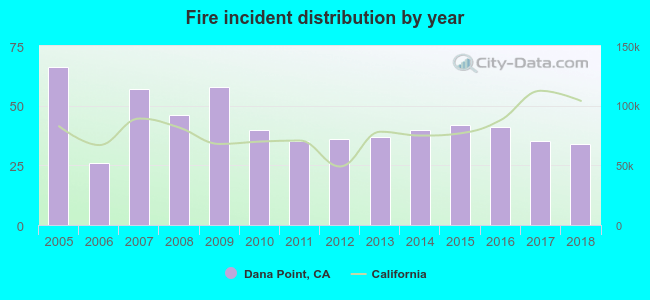 According to the data from the years 2005 - 2018 the average number of fires per year is 42. The highest number of fires - 66 took place in 2005, and the least - 26 in 2006. The data has a dropping trend.
The average number of yearly fire incidents per 10k residents in Dana Point, CA compared to nearest cities:
(Note: Based on data for the last 3 years, including only cities with population 5,000 and above)
| Dana Point: | 10.7 |
| San Juan Capistrano: | 12.5 |
| South Coast: | 0.4 |
| Laguna Niguel: | 7.1 |
| San Clemente: | 11.2 |
| Laguna Beach: | 4.1 |
| Aliso Viejo: | 6.9 |
| Ladera Ranch: | 1.1 |
| Las Flores: | 1.7 |
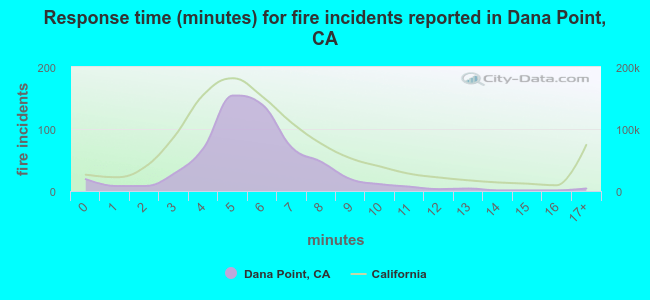 The median response time based on all reported fire incidents is 6 minutes. This is similar to the state median value.
The median response time in Dana Point, CA compared to nearest cities:
(Note: Based on data for all years, including only cities with at least 500 fire incidents)
| Dana Point: | 6 minutes |
| San Juan Capistrano: | 6 minutes |
| Laguna Niguel: | 6 minutes |
| San Clemente: | 6 minutes |
| Laguna Hills: | 6 minutes |
| Mission Viejo: | 6 minutes |
| Newport Beach: | 6 minutes |
| Irvine: | 6 minutes |
| Costa Mesa: | 5 minutes |
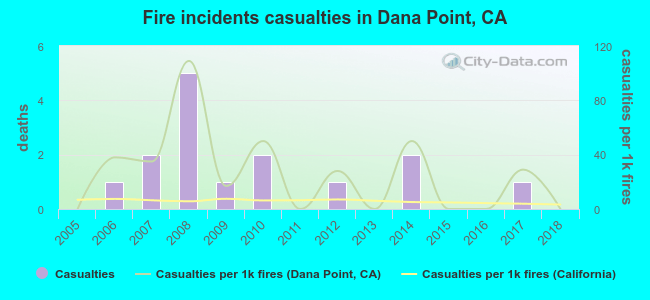 Based on the reports from the years 2005 - 2018 the average number of fire-related casualties per year is 1. The highest number of injuries - 5 took place in 2008, and the lowest - 0 in 2005. The data has a constant trend.
The average number of casualties per 1,000 fire incidents is 25. This indicator was the highest - 109 in 2008, and the lowest 0 in 2005. The trend for injuries per 1,000 fire incidents is constant. Compared to the state value the number of casualties per 1,000 incidents is much higher.
Based on the reports from the years 2005 - 2018 the average number of fire-related casualties per year is 1. The highest number of injuries - 5 took place in 2008, and the lowest - 0 in 2005. The data has a constant trend.
The average number of casualties per 1,000 fire incidents is 25. This indicator was the highest - 109 in 2008, and the lowest 0 in 2005. The trend for injuries per 1,000 fire incidents is constant. Compared to the state value the number of casualties per 1,000 incidents is much higher.Casualties per 1,000 incidents in Dana Point, CA compared to nearest cities:
(Note: Based on data for all years, including only cities with at least 500 fire incidents)
| Dana Point: | 25.3 |
| San Juan Capistrano: | 12.7 |
| Laguna Niguel: | 13.5 |
| San Clemente: | 22.0 |
| Laguna Hills: | 8.0 |
| Mission Viejo: | 16.8 |
| Newport Beach: | 3.6 |
| Irvine: | 15.1 |
| Costa Mesa: | 16.4 |
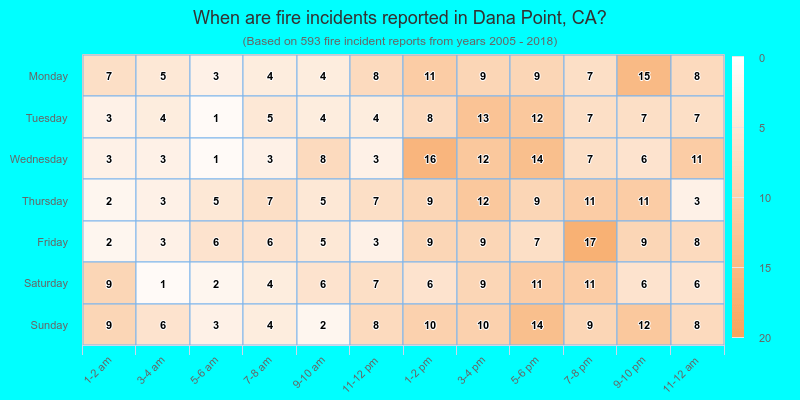
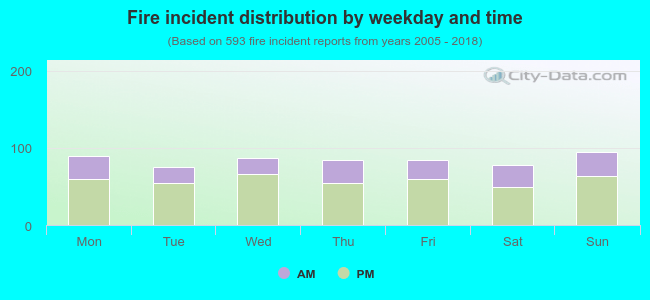 31.7% incidents where reported in the morning and 68.3% in the evening. The most fires (16.0%) took place on Sunday, and the least (12.6%) on Tuesday.
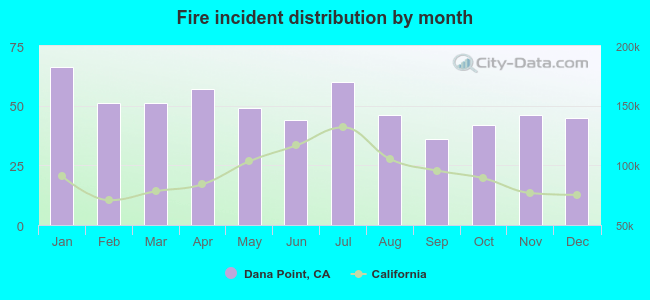 According to the 593 fire incidents from years 2005 - 2018 most fires (11.1%) took place during January, and the least (6.1%) in September.
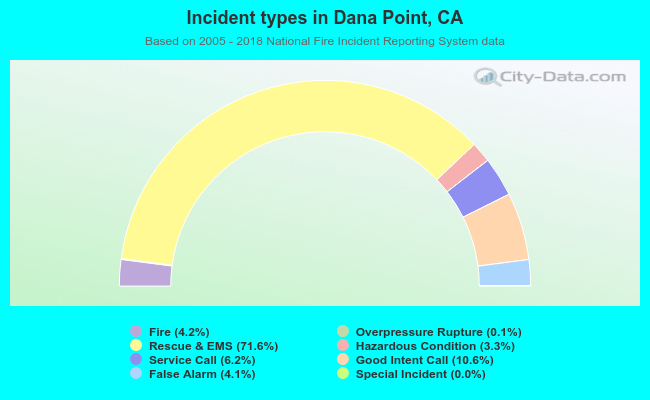 Out of all 14,289 cases reported during the years 2005 - 2018, the most belonged to the categories: Rescue & EMS (71.6%), Good Intent Call (10.6%), and Service Call (6.2%).
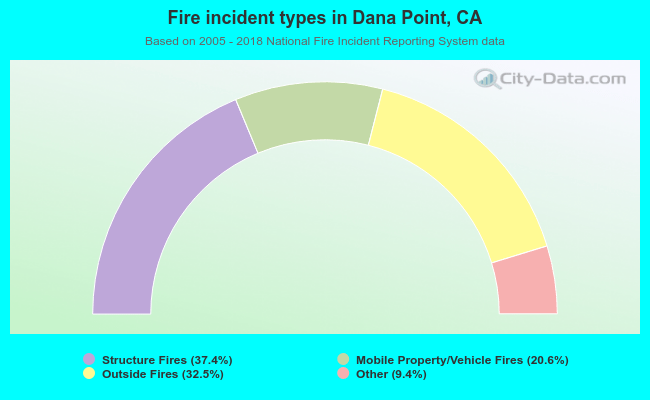 When looking into fire subcategories, the most reports belonged to: Structure Fires (37.4%), and Outside Fires (32.5%).