Housing density: 1,878 houses/condos per square mile
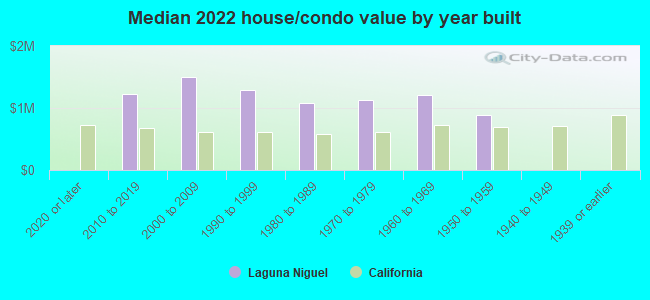
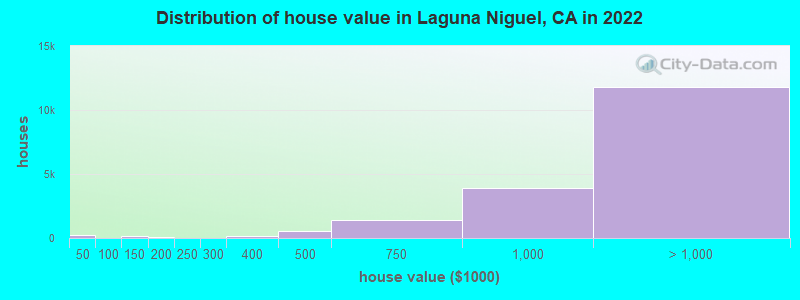
Median price asked for vacant for-sale houses and condos in 2022: $1,599,557.
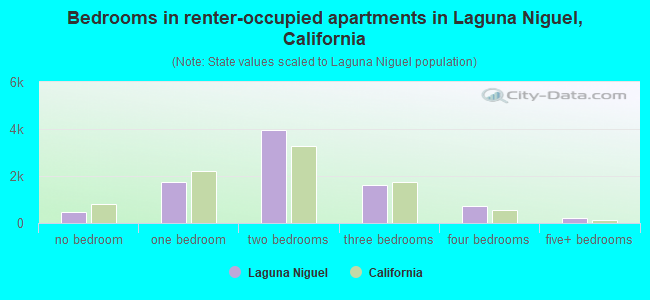
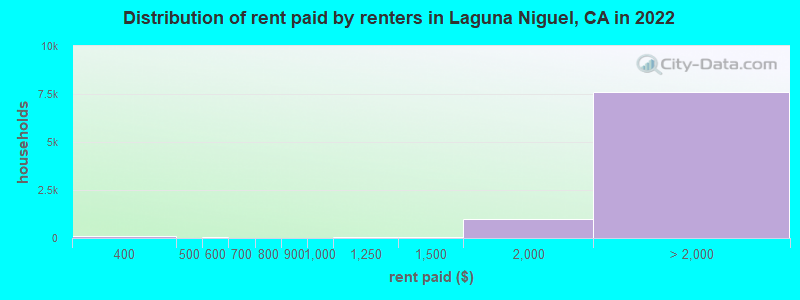
Median contract rent in 2022: over $2,000 (lower quartile is over $2,000, upper quartile is over $2,000)
Median rent asked for vacant for-rent units in 2022: $2,861
Median gross rent in Laguna Niguel, CA in 2022: over $2,000
Housing units in Laguna Niguel with a mortgage: 11,240 (1,608 second mortgage, 14 home equity loan, 1,420 both second mortgage and home equity loan) Houses without a mortgage: 190
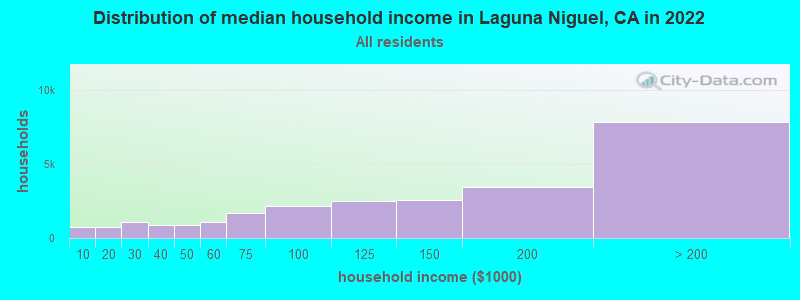
Median household income for houses/condos with a mortgage: $183,628
Median household income for apartments without a mortgage: $118,961
Median monthly housing costs: $2,680
Compare current foreclosures in Laguna Niguel, CA:
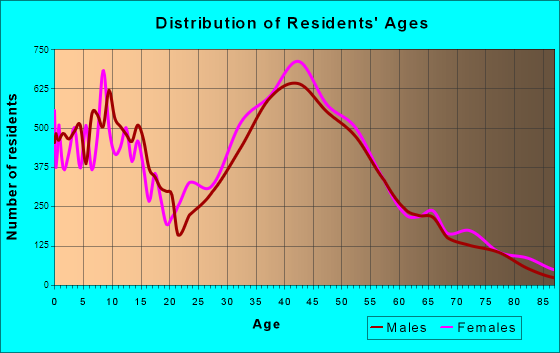
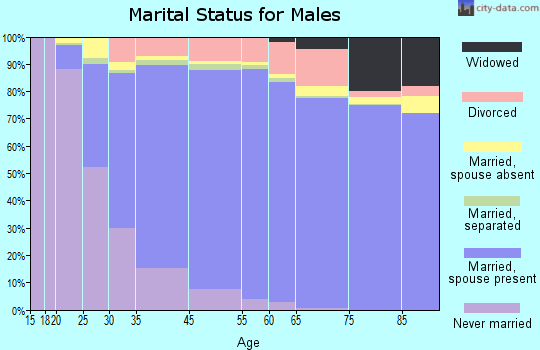
7,663 married couples with children.
2,013 single-parent households (621 men, 1,392 women).
70.1% of residents of Laguna Niguel speak English at home.
11.0% of residents speak Spanish at home (65% speak English very well, 17% speak English well, 16% speak English not well, 2% don't speak English at all).
11.8% of residents speak other Indo-European language at home (71% speak English very well, 17% speak English well, 10% speak English not well, 2% don't speak English at all).
6.3% of residents speak Asian or Pacific Island language at home (70% speak English very well, 21% speak English well, 9% speak English not well, 1% don't speak English at all).
1.0% of residents speak other language at home (78% speak English very well, 22% speak English well).
Foreign born population: 15,237 (23.9%)
(72.0% of them are naturalized citizens)
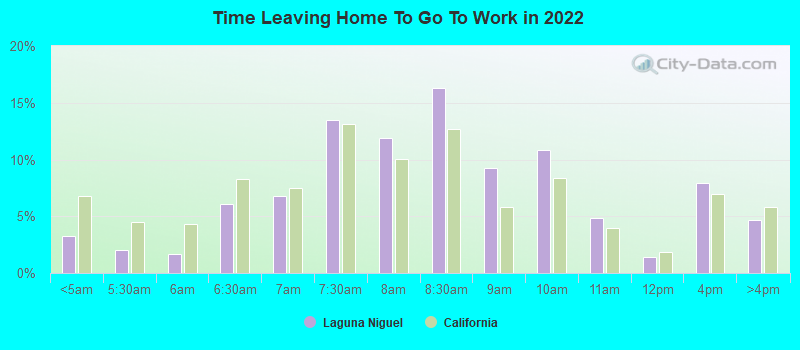
Percentage of workers working in this county: 94.0% Number of people working at home: 8,700 (25.4% of all workers)
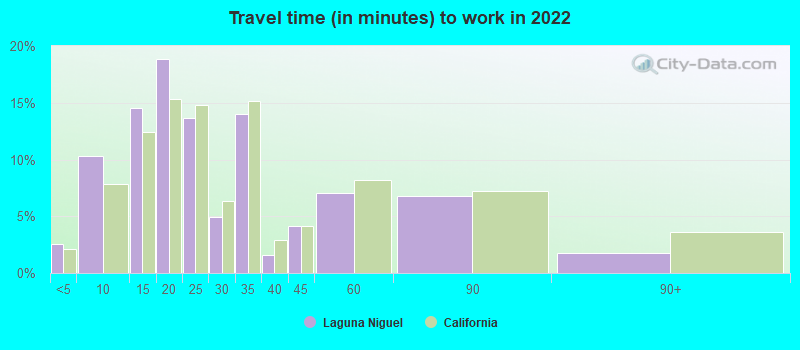
Travel time to work (commute)
Less than 5 minutes: 288
5 to 9 minutes: 1,544
10 to 14 minutes: 3,104
15 to 19 minutes: 5,034
20 to 24 minutes: 3,992
25 to 29 minutes: 2,188
30 to 34 minutes: 4,649
35 to 39 minutes: 932
40 to 44 minutes: 899
45 to 59 minutes: 1,663
60 to 89 minutes: 1,350
90 or more minutes: 551
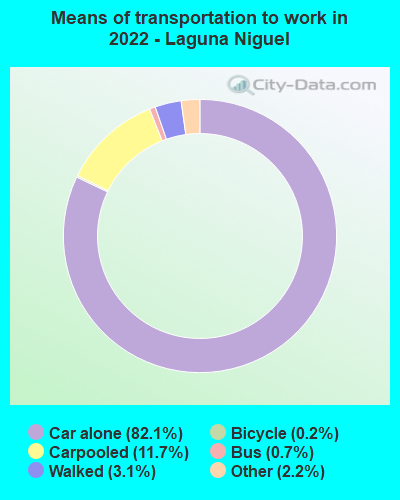
Means of transportation to work:
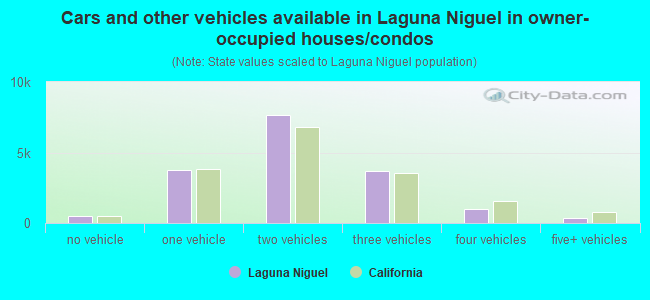
Drove a car alone: 12,935 (54.7%)
Carpooled: 1,996 (8.4%)
Bus: 104 (0.4%)
Taxi: 401 (1.7%)
Bicycle: 36 (0.2%)
Walked: 477 (2.0%)
Worked at home: 8,700 (36.8%)
Unemployment by race in 2022
Unemployment rate for White non-Hispanic residents
4.1%Males
3.0%Females
Unemployment rate for Black residents
20.3%Males
7.4%Females
Unemployment rate for Asian residents
1.1%Males
9.3%Females
Unemployment rate for other race residents
1.6%Males
4.4%Females
Unemployment rate for two or more race residents
1.7%Males
6.8%Females
Unemployment rate for Hispanic or Latino residents
1.9%Males
2.7%Females
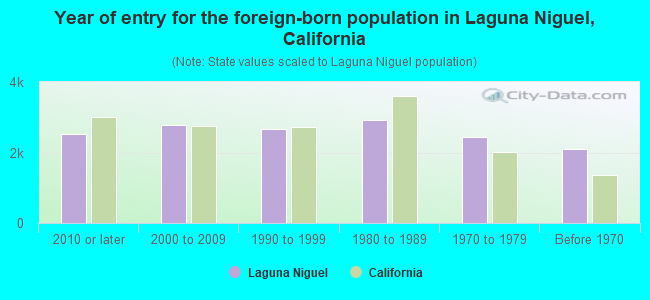
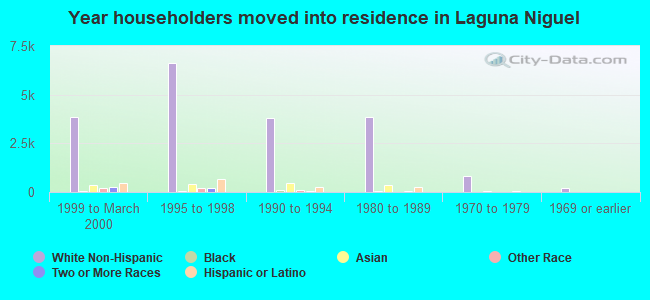
Year of entry for the foreign-born population in Laguna Niguel, California
2,5362010 or later
2,7882000 to 2009
2,6541990 to 1999
2,9091980 to 1989
2,4521970 to 1979
2,097Before 1970
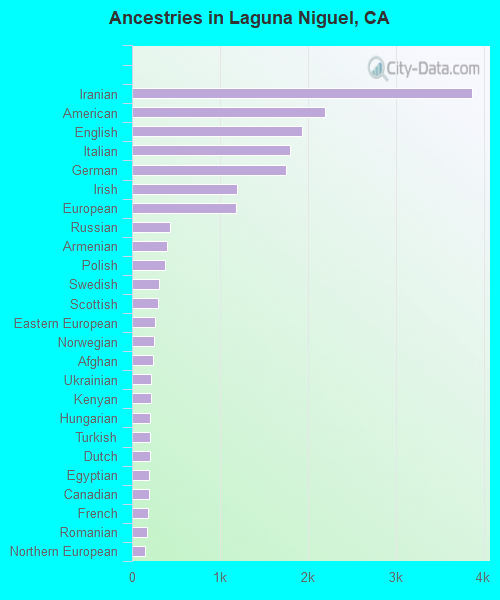
First ancestries reported:
Iranian: 3,866 (11.3%)
American: 2,194 (6.4%)
English: 1,936 (5.7%)
Italian: 1,799 (5.3%)
German: 1,749 (5.1%)
Irish: 1,192 (3.5%)
European: 1,182 (3.5%)
Russian: 435 (1.3%)
Armenian: 403 (1.2%)
Polish: 378 (1.1%)
Swedish: 308 (0.9%)
Scottish: 291 (0.9%)
Eastern European: 265 (0.8%)
Norwegian: 255 (0.7%)
Afghan: 238 (0.7%)
Ukrainian: 214 (0.6%)
Kenyan: 213 (0.6%)
Hungarian: 202 (0.6%)
Turkish: 202 (0.6%)
Dutch: 202 (0.6%)
Egyptian: 196 (0.6%)
Canadian: 194 (0.6%)
French: 184 (0.5%)
Romanian: 169 (0.5%)
Northern European: 150 (0.4%)
Scotch-Irish: 128 (0.4%)
British: 126 (0.4%)
Syrian: 102 (0.3%)
Greek: 100 (0.3%)
Portuguese: 75 (0.2%)
Slavic: 68 (0.2%)
Austrian: 66 (0.2%)
Danish: 57 (0.2%)
Croatian: 57 (0.2%)
Israeli: 45 (0.1%)
Welsh: 45 (0.1%)
Czechoslovakian: 43 (0.1%)
Scandinavian: 43 (0.1%)
Lebanese: 42 (0.1%)
Slovak: 42 (0.1%)
Macedonian: 36 (0.1%)
Arab: 35 (0.1%)
Estonian: 33 (0.10%)
Finnish: 32 (0.09%)
Basque: 28 (0.08%)
French Canadian: 26 (0.08%)
Australian: 26 (0.08%)
Serbian: 23 (0.07%)
Bulgarian: 20 (0.06%)
Brazilian: 20 (0.06%)
Czech: 20 (0.06%)
Palestinian: 19 (0.06%)
Nigerian: 17 (0.05%)
Assyrian: 17 (0.05%)
African: 15 (0.04%)
Jamaican: 14 (0.04%)
Belgian: 14 (0.04%)
Latvian: 13 (0.04%)
Maltese: 13 (0.04%)
Lithuanian: 12 (0.04%)
Cajun: 11 (0.03%)
Jordanian: 11 (0.03%)
Haitian: 10 (0.03%)
Swiss: 7 (0.02%)
Slovene: 4 (0.01%)
Most common places of birth for foreign-born residents (%):
Iran
Laguna Niguel:
24.4% (3,721)
California:
2.0% (206,004)
Mexico
Laguna Niguel:
14.3% (2,174)
California:
37.2% (3,881,193)
Philippines
Laguna Niguel:
5.9% (905)
California:
7.8% (818,297)
China, excluding Hong Kong and Taiwan
Laguna Niguel:
5.1% (781)
California:
6.6% (684,672)
Vietnam
Laguna Niguel:
4.5% (692)
California:
4.9% (512,335)
United Kingdom, excluding England and Scotland
Laguna Niguel:
3.8% (572)
California:
0.6% (60,582)
Korea
Laguna Niguel:
3.5% (535)
California:
3.0% (315,248)
Germany
Laguna Niguel:
3.4% (516)
California:
0.7% (73,304)
Canada
Laguna Niguel:
3.0% (453)
California:
1.2% (127,477)
India
Laguna Niguel:
2.9% (438)
California:
5.2% (539,184)
Peru
Laguna Niguel:
2.5% (377)
California:
0.7% (74,025)
Taiwan
Laguna Niguel:
2.4% (361)
California:
1.7% (176,274)
Syria
Laguna Niguel:
1.6% (241)
California:
0.3% (30,949)
Argentina
Laguna Niguel:
1.6% (240)
California:
0.3% (33,960)
Ukraine
Laguna Niguel:
1.6% (238)
California:
0.6% (60,761)
Place of birth for U.S.-born residents:
This state: 30,870
Other state: 16,089
Northeast: 4,204
Midwest: 5,696
South: 3,209
West: 2,969
88.6% of Laguna Niguel residents lived in the same house 1 years ago. Out of people who lived in different houses, 38.7% lived in this county. Out of people who lived in different counties, 54.4% lived in California.
Laguna Niguel:
88.6%
State average:
88.9%
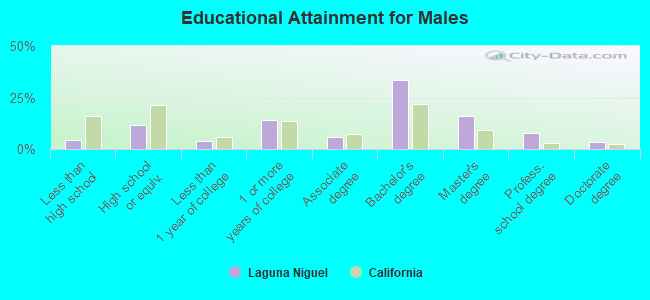
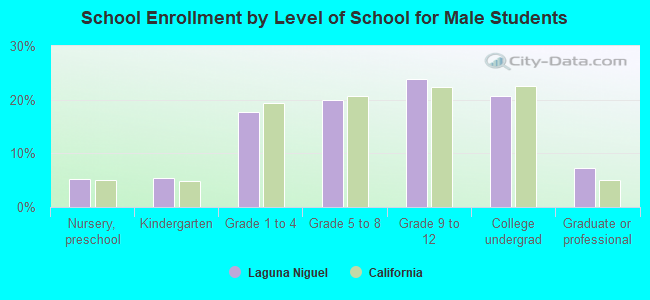
Education attainment for males 25 years and older:
No schooling: 242
Nursery to 4th grade: 113
5th and 6th grade: 106
7th and 8th grade: 77
9th grade: 127
10th grade: 46
11th grade: 0
12th grade, no diploma: 303
High school graduate (or equivalency): 2,688
Less than 1 year of college: 844
Some college more than 1 year, no degree: 3,257
Associate degree: 1,387
Bachelor's degree: 7,630
Master's degree: 3,618
Professional school degree: 1,740
Doctorate degree: 737
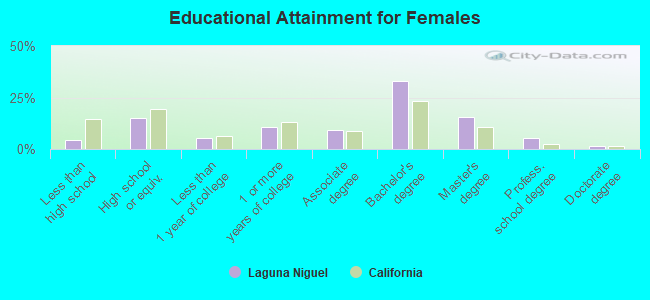
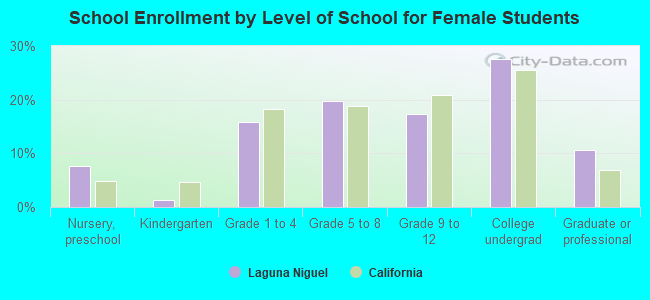
Education attainment for females 25 years and older:
No schooling: 455
Nursery to 4th grade: 74
5th and 6th grade: 174
7th and 8th grade: 36
9th grade: 66
10th grade: 59
11th grade: 31
12th grade, no diploma: 192
High school graduate (or equivalency): 3,808
Less than 1 year of college: 1,304
Some college more than 1 year, no degree: 2,654
Associate degree: 2,279
Bachelor's degree: 8,346
Master's degree: 3,965
Professional school degree: 1,347
Doctorate degree: 402
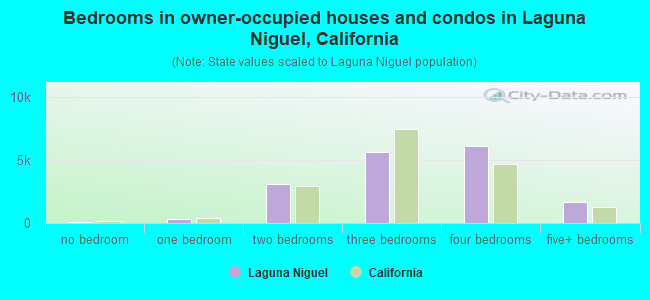
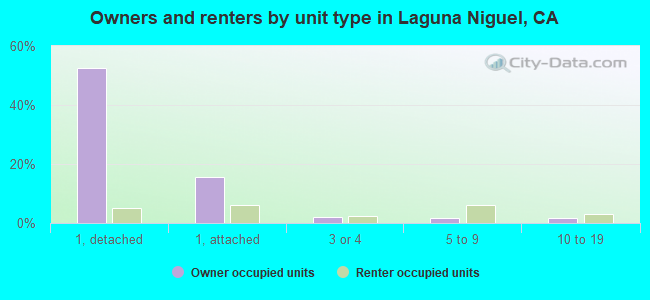
Housing units in structures:
One, detached: 15,062
One, attached: 5,307
Two: 146
3 or 4: 1,573
5 to 9: 1,615
10 to 19: 928
20 to 49: 311
50 or more: 2,550
Mobile homes: 44
Housing units lacking complete plumbing facilities in 2022: 0.4%
Housing units lacking complete kitchen facilities in 2022: 0.5%
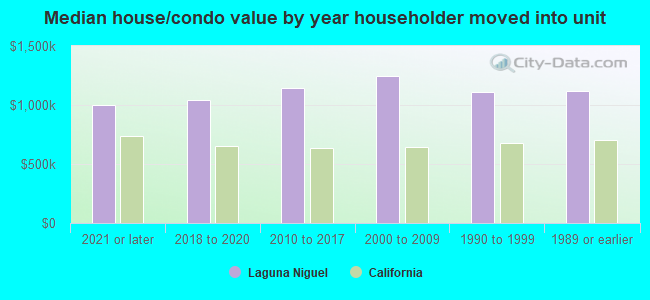
House/condo owner moved in on average 15 years ago