La Questa Verde neighborhood in Laguna Hills, California (CA), 92653 detailed profile
Settings
X

Business Search - 14 Million verified businesses
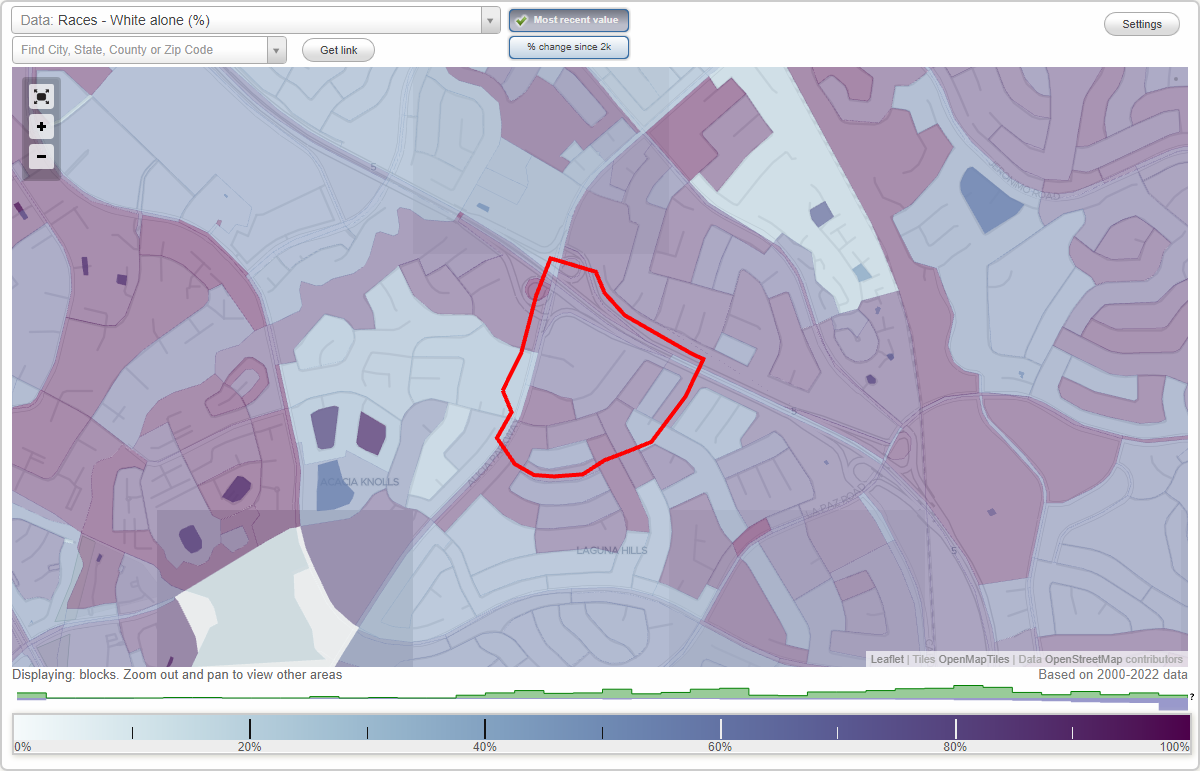
Area: 0.165 square miles
Population: 1,289
Population density:
| La Questa Verde: | 7,812 people per square mile |
| Laguna Hills: | 4,910 people per square mile |

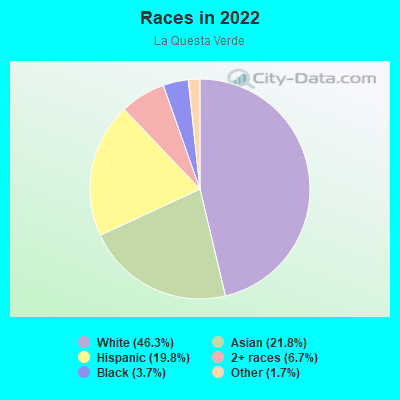
- 61146.3%White
- 28721.8%Asian
- 26119.8%Hispanic or Latino
- 896.7%Two or more races
- 493.7%Black
- 221.7%Some other race
Median household income in 2022:
| La Questa Verde: | $136,238 |
| Laguna Hills: | $122,902 |
Distribution of median household income
![Distribution of median household income]()
- 19Less than $10,000
- 23$10,000 to $19,999
- 35$20,000 to $29,999
- 17$30,000 to $39,999
- 31$40,000 to $49,999
- 55$50,000 to $59,999
- 13$60,000 to $74,999
- 20$75,000 to $99,999
- 60$100,000 to $124,999
- 60$125,000 to $149,999
- 54$150,000 to $199,999
- 104$200,000 or more

Distribution of owner-occupied house/condo value
![Distribution of owner-occupied house/condo value]()
- 16Less than $50,000
- 15$50,000 to $99,999
- 4$250,000 to $299,999
- 2$300,000 to $399,999
- 39$400,000 to $499,999
- 86$500,000 to $749,999
- 178$750,000 to $999,999
- 86$1,000,000 or more

Distribution of rent paid by renters
![Distribution of rent paid by renters]()
- 82$1,500 to $1,999
- 164$2,000 or more

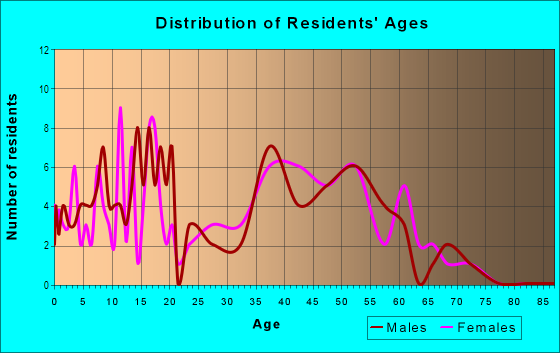
| Males: | 601 |
| Females: | 688 |
Males:
| This neighborhood: | 46.5 years |
| Whole city: | 41.1 years |
| This neighborhood: | 54.2 years |
| Whole city: | 46.4 years |
Average household size:
| La Questa Verde: | 3.1 people |
| Laguna Hills: | 2.6 people |
Percentage of family households:
| La Questa Verde: | 47.6% |
| Laguna Hills: | 46.0% |
| Here: | 69.0% |
| Laguna Hills: | 56.1% |
Percentage of married-couple families with children (among all households):
| La Questa Verde: | 27.5% |
| Laguna Hills: | 31.4% |
Percentage of single-mother households (among all households):
| La Questa Verde: | 2.0% |
| Laguna Hills: | 2.3% |
Percentage of never married males 15 years old and over:
Percentage of never married females 15 years old and over:
| La Questa Verde: | 15.8% |
| Laguna Hills: | 14.8% |
Percentage of never married females 15 years old and over:
| La Questa Verde: | 13.5% |
| city: | 13.8% |
Percentage of people that speak English not well or not at all:
| La Questa Verde: | 7.1% |
| Laguna Hills: | 5.1% |
Percentage of people born in this state:
Percentage of people born in another U.S. state:
Percentage of native residents but born outside the U.S.:
Percentage of foreign born residents:
| Here: | 54.6% |
| Laguna Hills: | 51.0% |
Percentage of people born in another U.S. state:
| La Questa Verde: | 16.5% |
| Laguna Hills: | 21.2% |
Percentage of native residents but born outside the U.S.:
| Here: | 3.8% |
| city: | 1.8% |
Percentage of foreign born residents:
| Here: | 25.1% |
| Laguna Hills: | 26.0% |
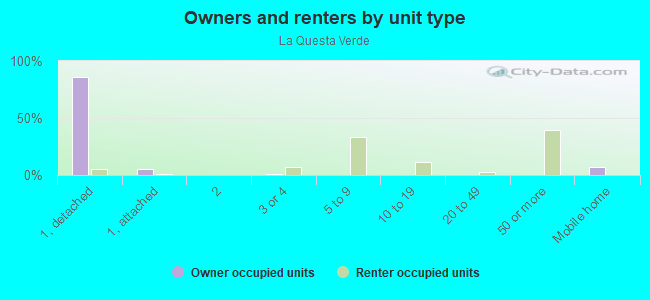
Owner-occupied
Renter-occupied

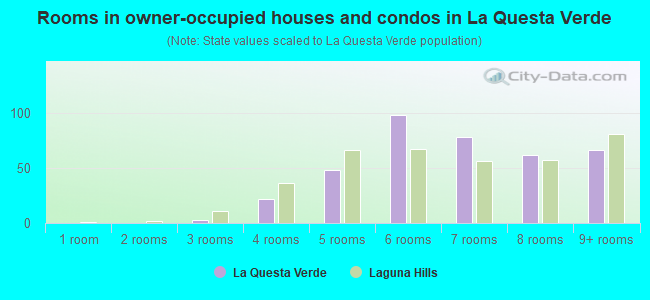
- Rooms in owner-occupied houses and condos in La Questa Verde
- 01 room
- 02 rooms
- 33 rooms
- 224 rooms
- 485 rooms
- 986 rooms
- 787 rooms
- 628 rooms
- 669+ rooms
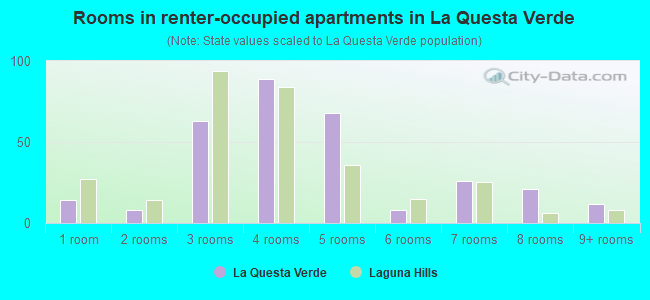
- Rooms in renter-occupied apartments in La Questa Verde
- 141 room
- 82 rooms
- 633 rooms
- 894 rooms
- 685 rooms
- 86 rooms
- 267 rooms
- 218 rooms
- 129+ rooms
Owner-occupied
Renter-occupied
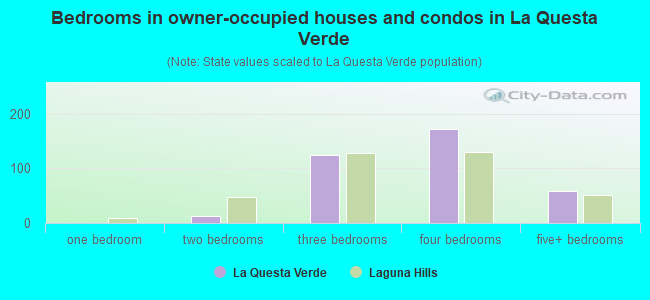
- Bedrooms in owner-occupied houses and condos in La Questa Verde
- 0no bedroom
- 01 bedroom
- 132 bedrooms
- 1243 bedrooms
- 1724 bedrooms
- 595+ bedrooms
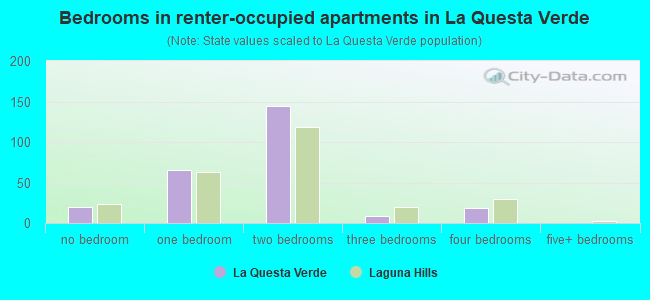
- Bedrooms in renter-occupied apartments in La Questa Verde
- 20no bedroom
- 661 bedroom
- 1442 bedrooms
- 93 bedrooms
- 184 bedrooms
- 05+ bedrooms
Average number of cars or other vehicles available in houses/condos:
Average number of cars or other vehicles available in apartments:
| This neighborhood: | 2.7 |
| Laguna Hills: | 2.3 |
Average number of cars or other vehicles available in apartments:
| Here: | 16.8 |
| city: | 1.6 |
Percentage of units with a mortgage:
| La Questa Verde: | 72.3% |
| Laguna Hills: | 71.0% |
Average estimated value of detached houses in 2022 (94.0% of all units):
| La Questa Verde: | $983,092 |
| California: | $988,808 |
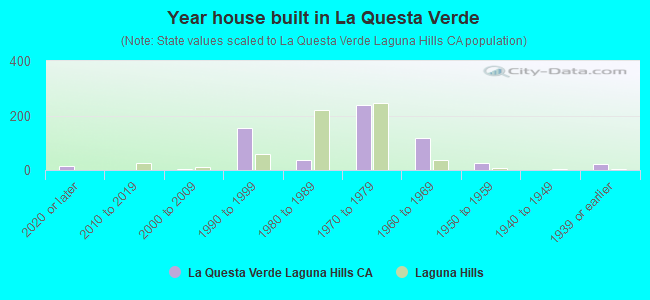
- Year house built in La Questa Verde
- 132020 or later
- 02010 to 2019
- 42000 to 2009
- 1531990 to 1999
- 381980 to 1989
- 2391970 to 1979
- 1191960 to 1969
- 261950 to 1959
- 01940 to 1949
- 231939 or earlier
City-data.com crime index for city in 2020 (higher means more crime):
| City: | 121.0 |
| U.S. average: | 219.5 |
Travel time to work (commute)
![Travel time to work (commute)]()
- 9Less than 5 minutes
- 295 to 9 minutes
- 6510 to 14 minutes
- 11415 to 19 minutes
- 8520 to 24 minutes
- 2525 to 29 minutes
- 5930 to 34 minutes
- 135 to 39 minutes
- 440 to 44 minutes
- 6645 to 59 minutes
- 1560 to 89 minutes
- 1890 or more minutes

Means of transportation to work
![Means of transportation to work]()
- 82.1%420Drove a car alone
- 7.8%40Carpooled
- 4.7%24Bus
- 1.0%5Long-distance train or commuter rail
- 3.5%18Motorcycle
- 0.8%4Bicycle
- 1.0%5Walked
- 2.7%14Other means
- 7.8%40Worked at home

Time leaving home to go to work
![Time leaving home to go to work]()
- 712:00 a.m. to 4:59 a.m.
- 145:00 a.m. to 5:29 a.m.
- 185:30 a.m. to 5:59 a.m.
- 56:00 a.m. to 6:29 a.m.
- 506:30 a.m. to 6:59 a.m.
- 717:00 a.m. to 7:29 a.m.
- 667:30 a.m. to 7:59 a.m.
- 738:00 a.m. to 8:29 a.m.
- 448:30 a.m. to 8:59 a.m.
- 349:00 a.m. to 9:59 a.m.
- 5310:00 a.m. to 10:59 a.m.
- 811:00 a.m. to 11:59 a.m.
- 2012:00 p.m. to 3:59 p.m.
- 204:00 p.m. to 11:59 p.m.

Occupations of males:
- Percentage of males in management occupations (except farmers):
Here: 4.6% city: 17.1%
- Percentage of males in business and financial operations occupations:
Here: 10.6% city: 7.1%
- Percentage of males in architecture and engineering occupations:
Here: 8.1% city: 7.4%
- Percentage of males in legal occupations:
Here: 2.0% city: 2.0%
- Percentage of males in education, training, and library occupations:
Here: 2.4% city: 3.6%
- Percentage of males in arts, design, entertainment, sports, and media occupations:
Here: 4.4% city: 3.8%
- Percentage of males in healthcare practitioners and technical occupations:
Here: 2.5% city: 2.8%
- Percentage of males in service occupations:
Here: 16.7% city: 10.1%
- Percentage of males in sales and office occupations:
Here: 23.1% city: 19.7%
- Percentage of males in construction, extraction, and maintenance occupations:
Here: 17.3% city: 6.5%
- Percentage of males in transportation occupations:
Here: 1.3% city: 5.5%
- Percentage of males in material moving occupations:
Here: 5.7% city: 2.4%
Occupations of females:
- Percentage of females in management occupations (except farmers):
Here: 8.7% city: 10.2%
- Percentage of females in business and financial operations occupations:
Here: 10.3% city: 12.0%
- Percentage of females in computer and mathematical occupations:
Here: 2.3% city: 1.5%
- Percentage of females in life, physical, and social science occupations:
Here: 4.2% city: 1.0%
- Percentage of females in legal occupations:
Here: 2.1% city: 1.2%
- Percentage of females in education, training, and library occupations:
Here: 14.5% city: 9.9%
- Percentage of females in healthcare practitioners and technical occupations:
Here: 8.6% city: 8.8%
- Percentage of females in service occupations:
Here: 13.0% city: 17.2%
- Percentage of females in sales and office occupations:
Here: 26.7% city: 26.0%
- Percentage of females in production occupations:
Here: 9.2% city: 3.6%
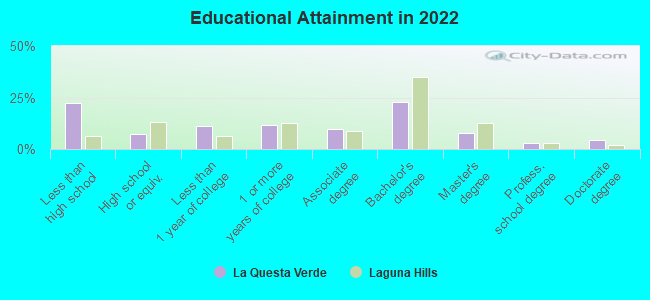
Education in this neighborhood (subdivision or community):
- Percentage of people 3 years and older in K-12 schools:
La Questa Verde: 20.0% Laguna Hills: 15.5%
- Percentage of people 3 years and older in undergraduate colleges:
La Questa Verde: 5.3% Laguna Hills: 5.0%
- Percentage of people 3 years and older in grad. or professional schools:
La Questa Verde: 5.3% Laguna Hills: 1.6%
- Percentage of students K-12 enrolled in private schools:
La Questa Verde: 12.6% Laguna Hills: 12.1%
Percentage of population below poverty level:
| La Questa Verde: | 7.0% |
| Laguna Hills: | 8.3% |
Median year owner moved in (as recorded in 2022):
| La Questa Verde: | 2002 |
| Laguna Hills: | 2006 |
Percentage of married-couple families with both working:
| La Questa Verde: | 63.6% |
| Laguna Hills: | 63.4% |
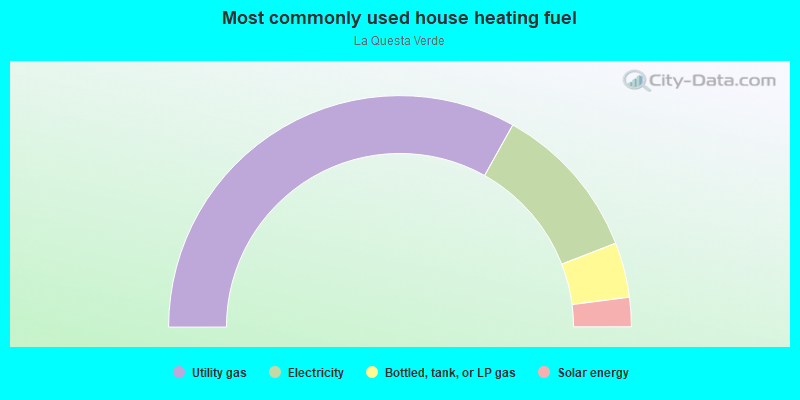
- 66.3%Utility gas
- 22.0%Electricity
- 7.7%Bottled, tank, or LP gas
- 4.1%Solar energy
Limited-access highways (interstate or state) in this neighborhood:
I- 5 (San Diego Fwy)
Length: 0.35 miles
Directions: E-W, SE-NW
Directions: E-W, SE-NW
Roads and streets:
Costeau St
Length: 0.46 miles
Directions: E-W, SW-NE
Address range: 25092 to 25499
Directions: E-W, SW-NE
Address range: 25092 to 25499
Alicia Pkwy
Length: 0.45 miles
Directions: N-S, SW-NE
Directions: N-S, SW-NE
Bentley
Length: 0.33 miles
Directions: E-W, SW-NE
Address range: 25100 to 25399
Directions: E-W, SW-NE
Address range: 25100 to 25399
Tasman Rd
Length: 0.21 miles
Direction: E-W
Address range: 25100 to 25399
Direction: E-W
Address range: 25100 to 25399
Hartog St
Length: 0.20 miles
Directions: E-W, SE-NW
Address range: 25100 to 25399
Directions: E-W, SE-NW
Address range: 25100 to 25399
Wells Fargo Dr
Length: 0.13 miles
Direction: SW-NE
Address range: 24800 to 24999
Direction: SW-NE
Address range: 24800 to 24999
Mackenzie St
Length: 0.12 miles
Direction: SE-NW
Address range: 24900 to 25035
Direction: SE-NW
Address range: 24900 to 25035
Overland Dr
Length: 0.11 miles
Direction: SW-NE
Address range: 24800 to 24999
Direction: SW-NE
Address range: 24800 to 24999
Cajon Dr
Length: 0.10 miles
Directions: E-W, N-S, SE-NW
Address range: 25400 to 25999
Directions: E-W, N-S, SE-NW
Address range: 25400 to 25999
Velasquez Rd
Length: 0.10 miles
Directions: E-W, N-S, SW-NE
Address range: 25000 to 25099
Directions: E-W, N-S, SW-NE
Address range: 25000 to 25099
Ericson Way
Length: 0.06 miles
Direction: SE-NW
Address range: 25000 to 25032
Direction: SE-NW
Address range: 25000 to 25032
Pso de Alicia
Length: 0.05 miles
Direction: E-W
Address range: 25100 to 25299
Direction: E-W
Address range: 25100 to 25299
Valerie St
Length: 0.05 miles
Direction: N-S
Address range: 24900 to 24950
Direction: N-S
Address range: 24900 to 24950
Las Bolsas
Length: 0.05 miles
Directions: N-S, SE-NW
Address range: 25000 to 25106
Directions: N-S, SE-NW
Address range: 25000 to 25106
Hon Ave
Length: 0.01 miles
Direction: E-W
Address range: 25092 to 25099
Direction: E-W
Address range: 25092 to 25099