Long Beach and Mission Viejo, Californian cities located in Los Angeles County and Orange County respectively, offer contrasting lifestyles and attributes. With Long Beach being a larger, coastal city that buzzes with vibrant culture, diverse food scenes, and a harbor-centric economy, Mission Viejo is a suburban city known for its stunning topography, lower crime rates, better educational offerings, and a higher cost of living due to real-estate values. Herein, we delve into the details, comparing these cities based on various factors to help determine which might be the ideal location for relocation or a tourist visit.
Distance between
Long Beach, CA and
Mission Viejo, CA : 31.7 miles
Long Beach's population is larger by 393%. Its population has decreased by 5,460 people (1.2%) since 2000. The population of Mission Viejo has decreased by 653 people (0.7%) during that time.
In terms of crime and safety, Mission Viejo is often viewed as safer than Long Beach. According to Neighborhood Scout, Mission Viejo's crime rate is significantly lower than the national average, contrasting with Long Beach which has a higher crime rate than the national average. Tourists and potential residents can thereby expect a safer environment in Mission Viejo.
City-data.com crime index counts serious crimes and violent crime more heavily. It adjusts for the number of visitors and daily workers commuting into cities. (higher means more crime, U.S. average = 301.1)
City-data.com crime index counts serious crimes and violent crime more heavily. It adjusts for the number of visitors and daily workers commuting into cities. (higher means more crime, U.S. average = 301.1)
Sex Offenders
According to our data, there are 807 registered sex offenders living in Long Beach and 29 registered sex offenders living in . The ratio of residents to sex offenders in Long Beach is 583 to 1; the ratio in Mission Viejo is 3,359 to 1. The number of registered sex offenders compared to the number of residents is much larger in Long Beach than that in Mission Viejo.
Cost of Living
The cost of living in Mission Viejo is significantly higher than Long Beach, especially when it comes to housing. According to BestPlaces, the median home cost in Long Beach is less than in Mission Viejo, making Long Beach potentially more affordable for those planning to own a home.
Income Tax
Income tax is governed at the state level; hence residents of both cities pay the same income tax rates, embraced by California’s progressive income tax system. This rate can range from 1% to 13.3% depending on income level.
Property Tax
Both cities fall under California's Proposition 13, with the annual property tax rate set at 1% of the assessed property value at acquisition, which increases no more than 2% per year unless the property is sold.
Sales Tax
Both Long Beach and Mission Viejo abide by the California state sales tax, which, as of 2022, is 7.25%. However, with local taxes included, the total can be higher, particularly in Long Beach where the total sales tax rate hits 9.75%.
Income
Type
Long Beach
Mission Viejo
Estimated median household income
$73,905
$124,971
Estimated per capita income
$37,217
$60,644
Cost of living index (U.S. average is 100)
142
87.9
If you make $50,000 in Mission Viejo, you will have to make $80,774 in Long Beach to maintain the same standard of living.
Geographical Conditions
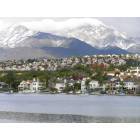
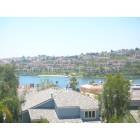
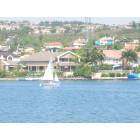
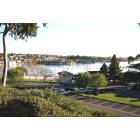
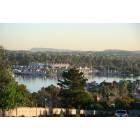
Long Beach, aptly named, is a coastal city with extensive beachfront, marinas, and a thriving port. Mission Viejo is set against rolling hills and is distinguished by its large man-made lake, Lake Mission Viejo, around which much of the city is built.
For education, Mission Viejo could be a better choice. The city boasts excellent schools and higher graduation rates than Long Beach. It is home to Saddleback College and is in a short commute of several other higher education institutions.
Long Beach has a more diverse and dynamic economy, anchored by industries such as shipping, manufacturing, healthcare, and education. Notably, it houses one of the world's largest shipping ports. Conversely, Mission Viejo’s economy is more suburban-oriented, focusing on services and retail.
Biggest Employers
Major employers in Long Beach include Long Beach Unified School District, the City of Long Beach, and Long Beach Memorial Medical Center. In Mission Viejo, the key employers include Saddleback College, Capistrano Unified School District, and Mission Hospital.
There were 304 building permits issued in Long Beach in 2012 (238 more than in 2011) compared to 32 building permits issued in Mission Viejo in 2012 (10 less than in 2011).
In Long Beach (Los Angeles County), 69.7% voted for Democrats and 27.8% for Republicans in 2012 Presidential Election. In Mission Viejo (Orange County), 45.8% voted for Democrats and 52.0% for Republicans.
Elections
Type
Democrats
Republicans
Other
Year
Long Beach
Mission Viejo
Long Beach
Mission Viejo
Long Beach
Mission Viejo
2020
71.0%
53.6%
26.9%
44.6%
2.1%
1.8%
2016
72.0%
50.9%
22.5%
42.4%
5.5%
6.7%
2012
69.7%
45.8%
27.8%
52.0%
2.4%
2.3%
2008
69.2%
47.8%
28.8%
50.3%
1.9%
1.9%
2004
63.3%
39.3%
35.7%
60.2%
1.0%
0.5%
2000
63.6%
40.4%
32.4%
55.9%
4.0%
3.7%
1996
59.3%
37.9%
31.0%
51.7%
9.7%
10.5%
Breakdown of population affiliated with a religious congregation
Type
Adherents
Congregations
Religion
Long Beach
Mission Viejo
Long Beach
Mission Viejo
CATHOLIC CHURCH
36.1%
26.5%
4.7%
4.4%
SOUTHERN BAPTIST CONVENTION
1.0%
2.3%
9.0%
8.8%
MUSLIM ESTIMATE
0.7%
0.8%
1.0%
1.3%
AMERICAN BAPTIST CHURCHES IN THE USA
0.5%
0.2%
3.1%
1.7%
SEVENTH DAY ADVENTIST CHURCH
0.5%
0.4%
2.4%
1.3%
EPISCOPAL CHURCH
0.4%
0.4%
1.4%
1.4%
EVANGELICAL LUTHERAN CHURCH IN AMERICA
0.2%
0.4%
1.9%
2.3%
LUTHERAN CHURCH
0.2%
0.6%
1.6%
2.0%
REFORMED CHURCH IN AMERICA
0.1%
0.3%
0.2%
0.2%
Weather
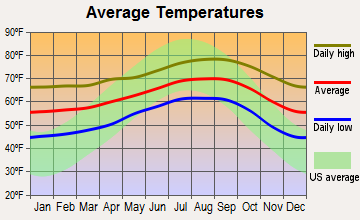
Both cities experience typical Southern Californian weather—warm, sunny, and relatively mild year-round. However, as Long Beach is coastal, it experiences somewhat cooler, more temperate weather and beautiful sea breezes as compared to the hotter summers and slightly cooler winters of Mission Viejo.
Weather and climate
Type
Long Beach
Mission Viejo
Temperature - Average
65.3°F
62.6°F
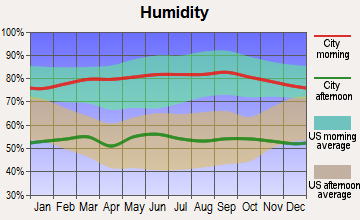
Humidity - Average morning or afternoon humidity
70.4%
68.9%
Humidity - Differences between morning and afternoon humidity
27%
24.5%
Humidity - Maximum monthly morning or afternoon humidity
79%
76.7%
Humidity - Minimum monthly morning or afternoon humidity
52%
52.2%
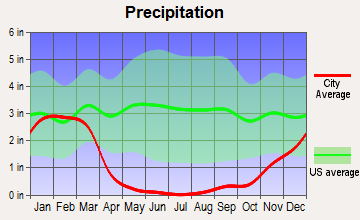
Precipitation - Yearly average
13.1 in
13.2 in
Snowfall - Yearly average
0 in
0 in
Clouds - Number of days clear of clouds
26.4%
26.8%
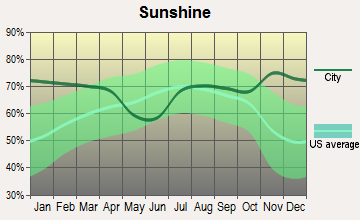
Sunshine amount - Average
78.4%
77.9%
Sunshine amount - Differences during a year
22%
21.1%
Sunshine amount - Maximum monthly
85%
83.2%
Sunshine amount - Minimum monthly
63%
62.1%
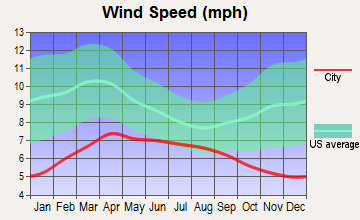
Wind speed - Average
6.1 mph
5.4 mph
Average climate in Long Beach, California
Average climate in Mission Viejo, California
Air pollution
Type
AQI
CO
NO2
OZONE
PB
PM10
PM25
SO2
Year
Long Beach
Mission Viejo
Long Beach
Mission Viejo
Long Beach
Mission Viejo
Long Beach
Mission Viejo
Long Beach
Long Beach
Mission Viejo
Long Beach
Mission Viejo
Long Beach
Mission Viejo
2018
124
121
0.37
0.19
17.2
10.8
22.1
34.2
0.008
N/A
27.5
24.2
13.5
9.2
0.7
N/A
2017
122
122
0.36
0.22
18.1
10.5
23.2
34.7
0.007
N/A
26.7
24.6
14.5
12.2
0.8
N/A
2016
115
112
0.36
0.12
18.5
10.7
21.9
34.2
0.007
N/A
24.1
22.8
11.6
11.1
0.9
0.1
2015
111
123
0.38
0.07
19.9
11.3
22.5
32.8
0.005
N/A
25.0
21.8
13.9
12.4
0.9
0.1
2014
127
107
0.50
0.09
20.3
10.9
22.0
31.7
0.007
N/A
26.7
26.0
14.3
13.8
1.3
0.3
2013
126
110
0.48
0.16
20.0
11.6
24.7
30.0
0.005
N/A
32.3
26.1
14.6
11.9
1.0
0.2
2012
132
114
0.48
0.29
19.3
11.2
24.4
31.3
0.004
N/A
30.8
23.9
14.1
12.3
0.6
0.1
2011
119
129
0.43
0.13
20.2
11.8
23.4
30.5
0.006
N/A
28.4
25.5
15.6
13.0
1.2
0.3
2010
115
113
0.38
0.21
20.8
12.1
22.7
31.1
0.011
N/A
24.1
23.5
11.9
12.9
0.7
0.6
2009
132
134
0.50
0.12
21.0
14.2
22.0
31.7
0.008
N/A
27.7
26.1
13.1
13.8
1.1
1.1
2008
124
142
0.53
0.23
20.8
14.9
23.2
31.8
0.008
N/A
27.2
35.6
21.6
12.5
1.0
1.1
2007
109
114
0.60
0.21
20.3
15.1
21.1
30.8
0.010
N/A
N/A
N/A
N/A
N/A
1.4
0.8
2006
119
113
0.76
0.30
21.4
15.9
19.9
31.0
0.005
N/A
N/A
N/A
N/A
N/A
1.7
1.3
2005
108
112
0.74
0.27
24.3
15.5
20.5
29.8
0.011
N/A
N/A
N/A
N/A
N/A
2.7
1.3
2004
125
132
0.56
0.26
28.0
16.6
22.9
32.8
0.012
N/A
N/A
N/A
N/A
N/A
2.0
1.6
2003
130
132
0.83
0.33
28.1
19.6
22.4
30.7
0.032
N/A
N/A
N/A
N/A
N/A
1.1
1.1
2002
120
130
0.90
0.36
29.6
19.2
22.2
27.4
0.011
N/A
N/A
N/A
N/A
N/A
2.8
1.6
2001
124
140
0.81
0.47
30.3
19.3
21.5
27.2
0.011
N/A
N/A
N/A
N/A
N/A
3.3
1.4
2000
142
140
0.71
0.45
31.5
21.3
19.6
23.6
0.018
N/A
N/A
N/A
N/A
N/A
2.0
1.9
Natural disasters
Type
Long Beach
Mission Viejo
Tornado activity compared to U.S. average
18.3%
17.9%
Earthquake activity compared to U.S. average
6,875.1%
6,866.6%
Natural disasters compared to U.S. average
57%
32%
Transportation
Long Beach has a more extensive public transportation system, encompassing buses, light rail, and a bicycle sharing program. Mission Viejo is largely car-dependent, though it does maintain a bus network and Metrolink commuter trains for connections to larger urban areas.
Transport
Type
Long Beach
Mission Viejo
Amtrak stations
1
0
Amtrak stations nearby
3
3
FAA registered aircraft
312
58
FAA registered aircraft manufacturers and dealers
29
3
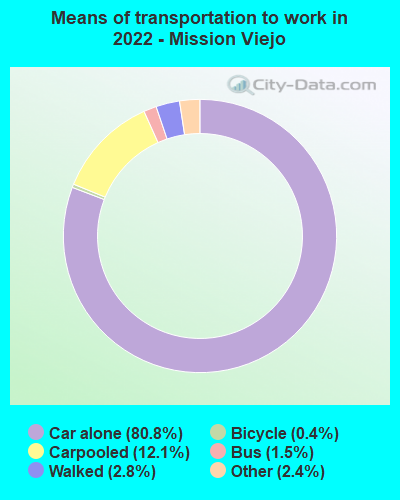
Means of transportation to work
Type
Long Beach
Mission Viejo
Bicycle
0.5%
0.4%
Bus
3.3%
1.6%
Carpooled
9.8%
10.7%
Car alone
81.8%
83.1%
Motorcycle
0.2%
0.2%
Railroad
0%
0.1%
Subway
0.5%
0.3%
Walked
2.8%
2.5%
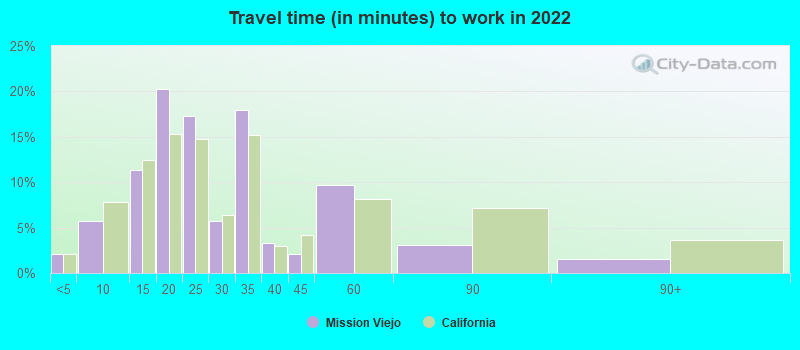
Average travel time to work
Type
Long Beach
Mission Viejo
Average
30.7 min
26.6 min
Other means
28.5 min
28.7 min
Public transportation
46.4 min
47 min
Private vehicle occupancy
Type
Long Beach
Mission Viejo
Average
1.1
1.1
Drove alone
89.7%
91.3%
In 2 person carpool
8.5%
6.6%
In 3 person carpool
1.4%
1.1%
In 4 person carpool
0.3%
0.5%
In 5-6 person carpool
0%
0.4%
How many people usually rode to work in the car, truck or van.
Real Estate
Real estate in Mission Viejo is costlier than in Long Beach. The higher prices in Mission Viejo are reflective of its more luxurious, aesthetically pleasing neighborhoods. However, Long Beach offers a broader range of options, including affordable housing, condos, and upscale beachfront properties.
Neighborhoods
Long Beach is well-known for its diverse neighborhoods, each offering unique cultural experiences. In comparison, Mission Viejo provides a more homogeneous neighborhood experience noted for its tranquility and family-friendly environments.
Houses and residents
Type
Long Beach
Mission Viejo
Houses
179,856
36,316
Average household size (people)
2.8
2.8
Median year apartment built
1964
1984
Median year house/condo built
1954
1978
Length of stay in the house since moving in
15.7 years
15 years
Houses occupied
172,599 (96%)
34,168 (94.1%)
Houses occupied by owners
69,470 (40.2%)
26,639 (78%)
Houses occupied by renters
103,129 (59.8%)
7,529 (22%)
Median rent asked for vacant for-rent units
$1,057
$3,060
Median monthly housing costs
$1,692
$2,299
Median price asked for vacant for-sale houses and condos
$520,992
$630,958
Estimated median house or condo value
$693,600
$859,500
Median numbers of rooms
4.2
6.2
Median number of rooms in apartments
3.6
4.1
Median number of rooms in houses and condos
5.5
6.5
Median house price - detached houses
$900,658
$937,136
Median house price - in 3-to-4-unit structures
$495,928
$449,468
Median house price - in 5 or more unit structures
$488,399
$447,280
Median house price - Townhouses or other attached units
$634,684
$576,818
Median house price - All housing units
$805,766
$875,068
Median house age
62
42
Renting percentage
58.4%
22.1%
Housing density (houses/condos per square mile)
3,565.7
1,946.5
House value disparities
21.3%
16.8%
Household income disparities
44.7%
37%
Median household income for houses/condes with a mortgage
$116,421
$155,949
Median household income for apartments without a mortgage
$79,392
$96,763
Housing units without a mortgage
394 (0.8%)
531 (2.7%)
Housing units with both a second mortgage and home equity loan
3,069 (6.2%)
1,736 (8.8%)
Housing units with a mortgage
49,321 (99.2%)
19,220 (97.3%)
Housing units with a home equity loan
48 (0.1%)
0 (0%)
Housing units with a second mortgage
3,709 (7.5%)
1,980 (10%)
House/condo owner moved in on average (years ago)
15
14
House/condo renter moved in on average (years ago)
3
1
Housing units lacking complete kitchen facilities
2.6%
2.2%
Housing units lacking complete plumbing facilities
0.4%
0.2%
Housing units in structures
Housing units in structures
Long Beach
Mission Viejo
One, detached
40.2%
73.2%
One, attached
4.9%
10.7%
Two
5.3%
0.4%
3 or 4
8.8%
2.4%
5 to 9
10.4%
1.8%
10 to 19
10.8%
3.7%
20 to 49
8.0%
0.1%
50 or more
10.6%
7.7%
Mobile homes
0.8%
0.0%
Boats, RVs, vans, etc.
0.2%
0.0%
Median real estate property taxes paid for housing units
Self-employed workers in own not incorporated business
18,532
3,059
State government workers
6,550
1,541
Unpaid family workers
178
198
Industries and Occupations
Long Beach is home to a diversified economy spanning shipping, aerospace, manufacturing, healthcare, and education. On the other hand, Mission Viejo's primary areas of employment fall within healthcare, education, and retail sectors.
Both cities have robust healthcare systems, but Long Beach, being larger, has a higher number of hospitals and clinics. Mission Viejo, however, is home to the highly rated Mission Hospital, part of the St. Joseph Health network.
Health (county statistics)
Type
Long Beach
Mission Viejo
General health status score of residents in this county from 1 (poor) to 5 (excellent)
As a larger and more developed city, Long Beach boasts more extensive infrastructure compared to Mission Viejo, including a busy seaport and a public transportation system. However, Mission Viejo's smaller scale offers an organized suburban structure, with well-maintained roads and facilities.
Infrastructure
Type
Long Beach
Mission Viejo
Hospitals
17
12
TV stations
5
1
Bank branches located here
67
25
Bank institutions located here
18
11
Nuclear power plants nearby
0
2
Drinking water stations with no reported violations in the past
2
0
Drinking water stations with reported violations in the past
HMDA - Conventional home purchase loans - Applications denied
Year
Long Beach
Mission Viejo
1999
1,159
456
2000
710
175
2001
677
136
2002
708
125
2003
1,861
381
2004
2,162
422
2005
3,065
577
2006
3,591
531
2007
2,287
395
2008
887
181
2009
475
111
Culture and Food
Long Beach presents a more diverse culinary and cultural scene, influenced by its mix of communities and proximity to the ocean. It hosts many cultural festivals throughout the year. Mission Viejo offers a suburban-dining experience with high-end eateries, boutique cafés, and family-friendly dining options.
Sports Teams
In sports, Long Beach offers more local teams and facilities, including the Long Beach State 49ers. Mission Viejo lacks professional sports teams but has a robust culture of youth sports and outdoor activities.


 Long Beach, CA
 Mission Viejo, CA