Washington, DC, the nation's capital, and Alexandria, VA, a quaint historic town, offer different living experiences and have their unique attractions, with DC offering more urban appeal and Alexandria providing a small-town feel. Both areas present a variety of opportunities, whether you are relocating or just visiting for a short period. This comparison will shed light on the crucial aspects of living, working, or touring in these two culturally significant American cities.
Distance between
Washington, DC and
Alexandria, VA : 7.4 miles
Washington's population is larger by 333%. Its population has grown by 97,991 people (17.1%) since 2000. The population of Alexandria has grown by 26,423 people (20.6%) during that time.
Washington, DC, due to its larger size and urban setting, generally has higher crime rates than Alexandria, VA. However, it's important to note that crime is neighborhood-specific in both areas, and high-security levels are present in tourist-heavy places. Comparatively, Alexandria has a lower crime rate and is often considered one of Virginia's safest cities. Therefore, while you should maintain vigilance in both cities, Alexandria may offer a more comfortable sense of safety.
City-data.com crime index counts serious crimes and violent crime more heavily. It adjusts for the number of visitors and daily workers commuting into cities. (higher means more crime, U.S. average = 301.1)
City-data.com crime index counts serious crimes and violent crime more heavily. It adjusts for the number of visitors and daily workers commuting into cities. (higher means more crime, U.S. average = 301.1)
Sex Offenders
According to our data, there are 1,073 registered sex offenders living in Washington and 272 registered sex offenders living in . The ratio of residents to sex offenders in Washington is 635 to 1; the ratio in Alexandria is 573 to 1. The number of registered sex offenders compared to the number of residents in Washington is near to than in Alexandria.
Cost of Living
Living in DC is generally more expensive than in Alexandria. This difference is most noticeable in housing costs, with DC having a significantly higher median home cost. Other costs, like groceries, health, transportation, and utilities, can also be slightly higher in DC. However, Alexandria, due to its proximity to the capital, is not far behind, particularly in areas closer to DC.
Income Tax
Washington, DC, has progressive income tax rates ranging from 4% to 8.95%. On the other hand, Virginia, including Alexandria, follows a progressive state income tax system, with rates ranging from 2% to 5.75%, so the income tax is generally lower in Alexandria.
Property Tax
Property tax rates in both DC and Alexandria are relatively low compared to nationwide averages. DC has a property tax rate of 0.85% while Alexandria's rate stands at 1.13%. Hence, property owners in DC can expect slightly lower property tax rates.
Sales Tax
Washington, DC, has a city sales tax of 6%, while Virginia’s state sales tax is 4.3%, with Alexandria adding another 1.0%, making it 5.3% in total. Therefore, the sales tax is slightly lower in Alexandria than in DC.
Income
Type
Washington
Alexandria
Estimated median household income
$90,088
$101,162
Estimated per capita income
$65,808
$68,020
Cost of living index (U.S. average is 100)
124.2
171.5
If you make $50,000 in Washington, you will have to make $69,042 in Alexandria to maintain the same standard of living.
Geographical Conditions
Both cities sit along the Potomac River: DC to the east and Alexandria to the south. DC is more urban, with fewer natural settings, while Alexandria offers more green spaces. The cities both provide great waterfront views, with parks and outdoor activities.
Both cities are known for their excellent education systems. Washington, DC, is home to prestigious universities like Georgetown and George Washington University. It also has a robust public school system, which includes some highly rated schools. Alexandria, though smaller, also offers good quality education. Its school system is less varied than DC's but still includes standout options like T.C. Williams High School.
DC's economy is powered by the federal government, making it somewhat recession-resistant. The city has a highly educated workforce, and job opportunities are also abundant in sectors like education, health, and professional services. Alexandria's economy benefits from its proximity to DC, with many residents commuting to DC for work. It offers employment opportunities in sectors such as software services, technology, consulting, and defense contracting.
Biggest Employers
The biggest employer in Washington, DC, is the federal government. Other major employers include MedStar Health, Marriott International, Inova Health System, and Booz Allen Hamilton. In Alexandria, notable employers include the Department of Defense, Inova Health System, and Alexandria City Public Schools.
There were 376 building permits issued in Washington in 2012 (149 more than in 2011) compared to 12 building permits issued in Alexandria in 2012 (93 less than in 2011).
In Washington (District of Columbia), 90.9% voted for Democrats and 7.3% for Republicans in 2012 Presidential Election. In Alexandria (Alexandria city), 71.3% voted for Democrats and 27.7% for Republicans.
Elections
Type
Democrats
Republicans
Other
Year
Washington
Alexandria
Washington
Alexandria
Washington
Alexandria
2020
92.6%
80.3%
5.4%
17.6%
2.0%
2.1%
2016
90.9%
75.6%
4.1%
17.5%
5.0%
6.9%
2012
90.9%
71.3%
7.3%
27.7%
1.8%
1.0%
2008
92.5%
71.9%
6.5%
27.3%
1.0%
0.8%
2004
89.6%
66.8%
9.4%
32.3%
1.0%
0.9%
2000
85.2%
61.2%
9.0%
34.6%
5.9%
4.2%
1996
85.2%
61.6%
9.3%
34.3%
5.5%
4.1%
Breakdown of population affiliated with a religious congregation
Type
Adherents
Congregations
Religion
Washington
Alexandria
Washington
Alexandria
CATHOLIC CHURCH
12.6%
13.3%
7.4%
4.2%
AMERICAN BAPTIST CHURCHES IN THE USA
6.2%
0.8%
10.3%
3.2%
SOUTHERN BAPTIST CONVENTION
4.4%
4.1%
10.3%
9.5%
EPISCOPAL CHURCH
3.1%
5.8%
5.3%
8.4%
SEVENTH DAY ADVENTIST CHURCH
0.9%
1.1%
1.8%
3.2%
MUSLIM ESTIMATE
0.7%
2.5%
1.1%
1.1%
EVANGELICAL LUTHERAN CHURCH IN AMERICA
0.5%
0.3%
2.1%
1.1%
PRESBYTERIAN CHURCH IN AMERICA
0.1%
0.4%
0.2%
2.1%
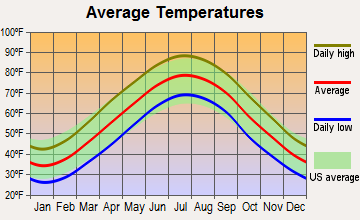
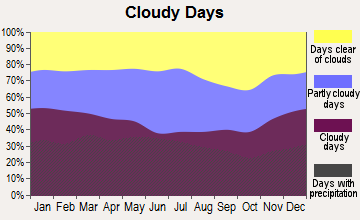
Weather
The weather in DC and Alexandria is virtually identical since they are geographically proximate. Both enjoy a humid subtropical climate, with hot, humid summers and moderately cold winters. The cities are at their most beautiful in spring when cherry blossoms bloom, and in fall, when the foliage turns a vibrant array of colors. However, be prepared for occasional heavy snow in winter and thunderstorms in summer.
Weather and climate
Type
Washington
Alexandria
Temperature - Average
56.4°F
57.2°F
Humidity - Average morning or afternoon humidity
68.8%
68.8%
Humidity - Differences between morning and afternoon humidity
33%
33%
Humidity - Maximum monthly morning or afternoon humidity
81%
81%
Humidity - Minimum monthly morning or afternoon humidity
48%
48%
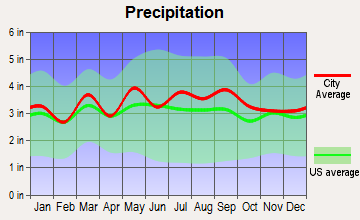
Precipitation - Yearly average
42.7 in
40.6 in
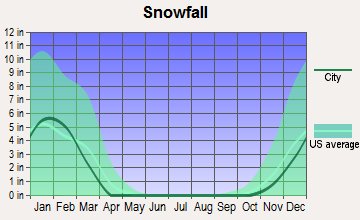
Snowfall - Yearly average
32.4 in
32.4 in
Clouds - Number of days clear of clouds
15.9%
15.9%
Sunshine amount - Average
61.5%
61.5%
Sunshine amount - Differences during a year
21%
21%
Sunshine amount - Maximum monthly
66%
66%
Sunshine amount - Minimum monthly
45%
45%
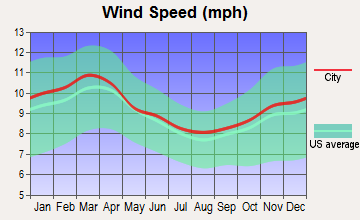
Wind speed - Average
9.7 mph
9.7 mph
Average climate in Washington, District of Columbia
Average climate in Alexandria, Virginia
Air pollution
Type
AQI
CO
NO2
OZONE
PB
PM10
PM25
SO2
Year
Washington
Alexandria
Washington
Alexandria
Washington
Alexandria
Washington
Alexandria
Washington
Alexandria
Washington
Alexandria
Washington
Alexandria
Washington
Alexandria
2018
88
88
0.32
0.31
11.6
10.4
23.2
25.5
N/A
N/A
16.4
16.4
8.8
7.7
0.8
0.6
2017
84
84
0.32
0.29
12.3
10.7
24.9
27.0
N/A
N/A
16.5
16.5
9.8
8.0
1.0
0.5
2016
98
98
0.43
0.31
14.7
12.1
24.6
27.0
0.002
0.002
17.2
17.2
9.5
7.5
1.0
0.5
2015
91
91
0.34
0.33
14.8
12.0
26.2
26.8
0.002
0.002
17.0
17.0
10.4
8.2
1.3
0.9
2014
85
84
0.33
0.31
11.6
12.0
25.9
26.5
0.002
0.002
17.1
17.1
10.0
8.2
1.0
1.0
2013
88
88
0.34
0.34
11.7
12.3
25.6
25.3
0.002
0.002
17.3
17.3
11.6
8.7
1.0
0.7
2012
103
103
0.58
0.26
15.2
13.0
27.6
26.9
0.002
0.002
N/A
N/A
12.2
9.3
1.6
0.6
2011
105
105
0.67
0.29
15.4
13.1
27.7
27.4
0.002
0.002
N/A
N/A
11.4
9.9
3.1
0.7
2010
114
114
0.88
0.22
15.9
15.7
29.3
28.6
0.003
0.003
N/A
N/A
9.3
9.8
3.4
2.1
2009
90
90
0.86
0.19
16.2
15.2
24.4
24.1
0.002
0.002
N/A
N/A
7.6
8.2
4.6
2.0
2008
103
103
1.23
0.24
16.2
15.9
25.3
23.8
0.003
0.003
N/A
N/A
8.5
9.0
5.6
3.0
2007
113
113
1.17
0.24
16.8
17.0
27.1
27.0
0.004
0.004
N/A
N/A
10.4
10.4
5.1
3.3
2006
114
114
1.11
0.31
17.2
19.1
25.5
25.4
0.004
0.004
N/A
N/A
10.9
10.9
4.5
2.9
2005
105
105
0.86
0.38
20.5
23.3
22.7
22.4
0.006
0.006
N/A
N/A
11.7
11.7
4.5
4.6
2004
113
113
0.62
0.35
21.3
24.1
20.6
22.5
0.004
0.004
N/A
N/A
11.3
11.3
6.5
5.5
2003
108
108
0.90
0.42
23.6
23.5
20.8
21.5
N/A
N/A
N/A
N/A
12.2
12.2
8.3
5.8
2002
125
125
1.16
0.52
23.7
24.7
25.0
24.5
N/A
N/A
N/A
N/A
N/A
N/A
6.7
6.1
2001
113
110
1.07
0.54
23.9
23.3
22.0
22.5
0.017
0.017
N/A
N/A
N/A
N/A
6.7
5.7
2000
115
110
1.17
0.60
20.2
23.0
19.1
19.1
N/A
N/A
N/A
N/A
N/A
N/A
8.2
6.4
Natural disasters
Type
Washington
Alexandria
Tornado activity compared to U.S. average
110.6%
108.9%
Earthquake activity compared to U.S. average
42.9%
43.4%
Natural disasters compared to U.S. average
19%
0%
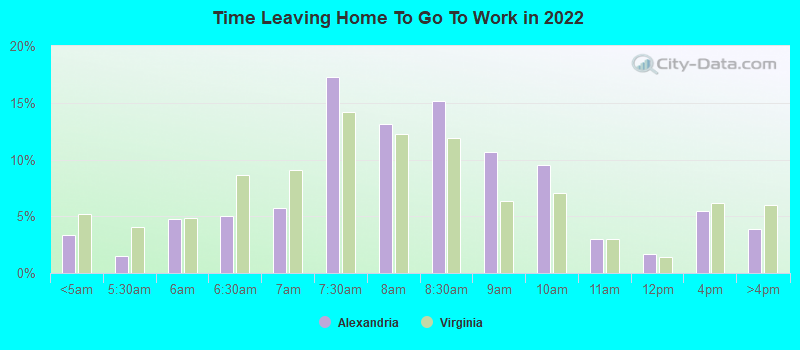
Transportation
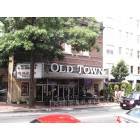
Both cities are served by the Washington Metro, providing seamless public transit. Traffic congestion can be an issue in DC due to its high population density. Meanwhile, commuting in Alexandria is generally easier, and many residents opt to walk or bike, especially in areas like Old Town.
Transport
Type
Washington
Alexandria
Amtrak stations
1
1
Amtrak stations nearby
3
3
FAA registered aircraft
456
163
FAA registered aircraft manufacturers and dealers
3
0
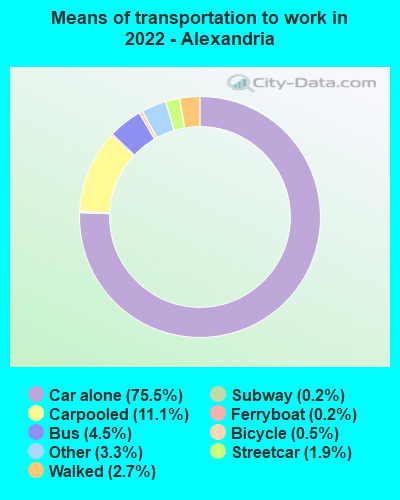
Means of transportation to work
Type
Washington
Alexandria
Bicycle
2%
0.8%
Bus
6.3%
7%
Carpooled
7.8%
13.1%
Car alone
62.5%
70.5%
Motorcycle
0.1%
0.1%
Railroad
0.3%
0.1%
Streetcar
10.6%
2.2%
Subway
1.3%
1%
Taxicab
0.8%
0.5%
Walked
5.7%
3.3%
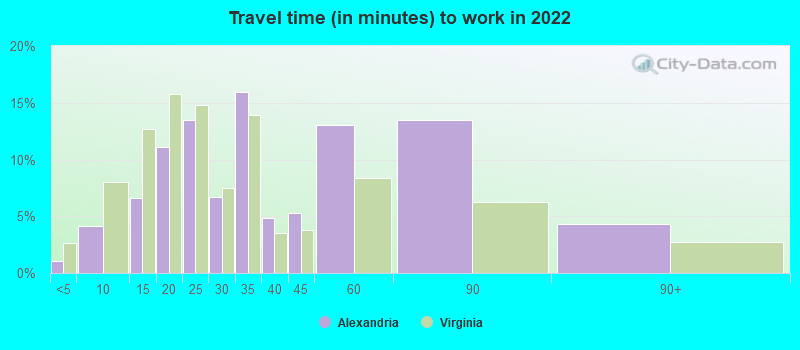
Average travel time to work
Type
Washington
Alexandria
Average
39.2 min
33.8 min
Other means
26 min
28.5 min
Public transportation
38.9 min
43.6 min
Private vehicle occupancy
Type
Washington
Alexandria
Average
1.1
1.2
Drove alone
89.4%
88.7%
In 2 person carpool
9.7%
8.1%
In 3 person carpool
0.6%
1.2%
In 4 person carpool
0.4%
1.9%
In 5-6 person carpool
0%
0.2%
How many people usually rode to work in the car, truck or van.
Real Estate
Real estate in DC is more expensive than in Alexandria. But due to its global significance, DC real estate represents a solid investment. Conversely, Alexandria offers more affordable suburban living options with excellent lifestyle amenities and historic charm. The city's real estate market is known for its waterfront properties, historic homes, and townhouses around Old Town.
Neighborhoods
DC offers an array of vibrant neighborhoods, from Capitol Hill's stately townhomes to Georgetown's elegant row houses and Foggy Bottom's modern condominiums. Alexandria is smaller but equally attractive with neighborhoods ranging from the historic charm of Old Town to the more suburban feel of areas like Seminary Hill and Rosemont.
Houses and residents
Type
Washington
Alexandria
Houses
357,482
80,350
Average household size (people)
2.1
2
Median year apartment built
1965
1977
Median year house/condo built
1941
1970
Length of stay in the house since moving in
13.5 years
10.9 years
Houses occupied
319,565 (89.4%)
72,024 (89.6%)
Houses occupied by owners
132,936 (41.6%)
31,137 (43.2%)
Houses occupied by renters
186,629 (58.4%)
40,887 (56.8%)
Median rent asked for vacant for-rent units
$2,791
$3,780
Median monthly housing costs
$1,817
$1,930
Median price asked for vacant for-sale houses and condos
$996,150
$1,479,435
Estimated median house or condo value
$669,900
$630,500
Median numbers of rooms
3.8
4.2
Median number of rooms in apartments
3.1
3.7
Median number of rooms in houses and condos
6
5.8
Median house price - detached houses
Over $1,000,000
$994,240
Median house price - in 2-unit structures
Over $1,000,000
$620,900
Median house price - in 3-to-4-unit structures
$471,443
$386,591
Median house price - in 5 or more unit structures
$527,983
$338,886
Median house price - Townhouses or other attached units
$817,288
$767,898
Median house price - All housing units
$790,542
$697,053
Median house age
65
47
Renting percentage
58%
56.7%
Housing density (houses/condos per square mile)
5,821.9
5,293.9
House value disparities
26.7%
29.5%
Household income disparities
45.7%
41.2%
Median household income for houses/condes with a mortgage
$163,111
$163,037
Median household income for apartments without a mortgage
$108,852
$112,052
Housing units without a mortgage
777 (0.8%)
279 (1.1%)
Housing units with both a second mortgage and home equity loan
8,586 (8.5%)
1,736 (7.1%)
Housing units with a mortgage
100,122 (99.2%)
24,232 (98.9%)
Housing units with a home equity loan
1,057 (1%)
131 (0.5%)
Housing units with a second mortgage
12,793 (12.7%)
2,115 (8.6%)
House/condo owner moved in on average (years ago)
10
7
House/condo renter moved in on average (years ago)
1
1
Housing units lacking complete kitchen facilities
1.5%
0.7%
Housing units lacking complete plumbing facilities
1.5%
0.5%
Housing units in structures
Housing units in structures
Washington
Alexandria
One, detached
11.2%
13.5%
One, attached
22.2%
20.9%
Two
2.7%
1.0%
3 or 4
6.8%
2.6%
5 to 9
7.3%
7.4%
10 to 19
8.5%
13.6%
20 to 49
7.6%
5.2%
50 or more
33.6%
35.8%
Mobile homes
0.2%
0.0%
Median real estate property taxes paid for housing units
Self-employed workers in own not incorporated business
16,654
4,414
State government workers
6,699
1,833
Unpaid family workers
580
84
Industries and Occupations
The industries in Washington, DC, are diversified, ranging from governmental jobs to education, health care, professional services, and information technology. In Alexandria, job opportunities are more concentrated in sectors like technology, professional services, defense contracting, and retail. DC generally offers more opportunities due to its much larger size and status as the nation's capital.
Healthcare services in both cities are top-notch. DC hosts world-class medical centers, including MedStar Washington Hospital Center and George Washington University Hospital. Alexandria provides quality healthcare with notable facilities like Inova Alexandria Hospital.
Urban infrastructure in DC is more developed than in Alexandria, featuring a mix of historic and modern residential, commercial, and government buildings. Meanwhile, Alexandria offers a more small-town, historic charm with its well-preserved 18th and 19th-century architecture, especially in Old Town. The city infrastructure is organized, clean, and consistent with the city’s historic character and watery setting.
Infrastructure
Type
Washington
Alexandria
Hospitals
114
4
TV stations
27
25
Bank branches located here
247
85
Bank institutions located here
34
15
Main business address for public companies
30
10
Drinking water stations with no reported violations in the past
5
1
Drinking water stations with reported violations in the past
HMDA - Conventional home purchase loans - Applications denied
Year
Washington
Alexandria
1999
1,328
0
2000
1,438
0
2001
935
0
2002
886
0
2003
1,319
231
2004
2,281
430
2005
2,920
642
2006
3,362
561
2007
2,548
314
2008
1,095
170
2009
514
80
Culture and Food
Washington, DC, is rich in culture and history, as the home of many national landmarks and museums. Its food scene is diverse, reflecting the variety of cultures within the city. Alexandria also boasts rich history and a vibrant cultural scene – its Old Town is renowned for its well-preserved 18th-century houses and brick sidewalks. The city provides a varied food scene, with a concentration of restaurants that offer farm-to-table, international, and coastal cuisine.
Sports Teams
Sports enthusiasts will find more variety in DC, which is home to several major professional sports teams, including the Washington Capitals (NHL), Washington Wizards (NBA), and Washington Nationals (MLB). In contrast, Alexandria does not have major sports teams but provides ample opportunities for local community sports.


 Washington, DC
 Alexandria, VA