Comparing Washington, DC and Arlington, VA provides insights into two very distinct areas, both rich in history and culture, but differing in many aspects such as cost of living, education, and commute times. Washington DC, the nation's capital, is a hub for politics and international diplomacy, with a high cost of living and a vibrant cultural scene. Arlington, VA, on the other hand, is a smaller, residential area offering a quieter, suburban feel while remaining close to the action of DC. Its cost of living is slightly lower and it's often considered safer.
Distance between
Washington, DC and
Arlington, VA : 5.6 miles
Washington's population is larger by 188%. Its population has grown by 97,991 people (17.1%) since 2000. The population of Arlington has grown by 43,512 people (23.0%) during that time.
In terms of crime and safety, Arlington is generally considered safer than Washington, DC. According to FBI data, the crime rate in Arlington is significantly lower than that of Washington. Residents and tourists alike can generally expect a safer living and visiting experience in Arlington. However, like any city, it's crucial to stay alert and take safety precautions.
Cost of Living
Living in Washington, DC is generally more expensive than in Arlington, VA. According to the cost of living calculator from PayScale, Washington DC has a higher cost of living index, due largely to housing costs. Despite this, many choose to live in DC for the proximity to work and cultural amenities.
Income Tax
Income tax is higher in Washington, DC, with rates ranging up to 8.95%, while Virginia’s top rate is 5.75%. This could be a consideration for people planning to work in one place and live in another.
Property Tax
The property tax rate in Washington, DC is generally lower than in Arlington, VA. However, considering house prices in DC tend to be higher, homeowners may end up paying similar amounts.
Sales Tax
Washington, DC has a sales tax rate of 6%, while Arlington, Virginia has a combined state and local sales tax rate of 6%. The rates are relatively comparable, with slight variations depending on specific goods and services.
Income
Type
Washington
Arlington
Estimated median household income
$90,088
$125,651
Estimated per capita income
$65,808
$80,996
Cost of living index (U.S. average is 100)
124.2
171.8
If you make $50,000 in Washington, you will have to make $69,163 in Arlington to maintain the same standard of living.
Geographical Conditions
Both cities are located along the Potomac River, offering beautiful waterfront views and plenty of parks and green spaces. The landscape of both includes flat land and some rolling hills.
Both Washington, DC and Arlington, VA have diverse educational offerings. However, the school systems in Arlington are often ranked higher than DC's. Arlington Public Schools excel in student performance metrics, while Washington, DC has struggled to improve their public school system. Both areas offer good options for higher education, with prestigious universities like Georgetown and George Washington University in DC.
Washington, DC's economy is heavily dependent on the federal government, with many residents working in government roles. However, it also has robust healthcare, education, and technology sectors. Meanwhile, Arlington has a diverse economy, with strong sectors in defense, government, education, and technology. Arlington is home to numerous federal agencies and the large tech presence of Amazon’s HQ2.
Biggest Employers
The major employers in Washington, DC are the federal government, District of Columbia Public Schools, and Washington Hospital Center. On the other hand, in Arlington, the Department of Defense, Arlington County, and Amazon, which opened its second headquarter in Arlington, tend to top the list of employers.
In Washington (District of Columbia), 90.9% voted for Democrats and 7.3% for Republicans in 2012 Presidential Election. In Arlington (Arlington County), 69.3% voted for Democrats and 29.4% for Republicans.
Elections
Type
Democrats
Republicans
Other
Year
Washington
Arlington
Washington
Arlington
Washington
Arlington
2020
92.6%
80.6%
5.4%
17.1%
2.0%
2.3%
2016
90.9%
75.8%
4.1%
16.6%
5.0%
7.5%
2012
90.9%
69.3%
7.3%
29.4%
1.8%
1.3%
2008
92.5%
71.8%
6.5%
27.2%
1.0%
1.0%
2004
89.6%
67.6%
9.4%
31.3%
1.0%
1.1%
2000
85.2%
60.4%
9.0%
34.3%
5.9%
5.3%
1996
85.2%
60.5%
9.3%
34.6%
5.5%
4.9%
Breakdown of population affiliated with a religious congregation
Type
Adherents
Congregations
Religion
Washington
Arlington
Washington
Arlington
CATHOLIC CHURCH
12.6%
14.6%
7.4%
6.2%
AMERICAN BAPTIST CHURCHES IN THE USA
6.2%
0.5%
10.3%
2.7%
SOUTHERN BAPTIST CONVENTION
4.4%
1.3%
10.3%
16.8%
EPISCOPAL CHURCH
3.1%
2.0%
5.3%
8.0%
SEVENTH DAY ADVENTIST CHURCH
0.9%
0.1%
1.8%
1.8%
MUSLIM ESTIMATE
0.7%
1.7%
1.1%
0.9%
EVANGELICAL LUTHERAN CHURCH IN AMERICA
0.5%
0.6%
2.1%
2.7%
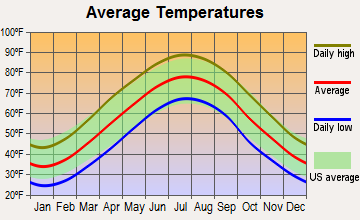
Weather
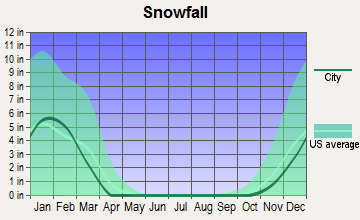
The weather in both Washington, DC and Arlington, VA is fairly similar given their close geographical proximity. They experience four distinct seasons, with hot, humid summers and mild to cold winters. Snowfall is relatively light in general. The weather can be unpredictable at times with occasional storms.
Weather and climate
Type
Washington
Arlington
Temperature - Average
56.4°F
56.6°F
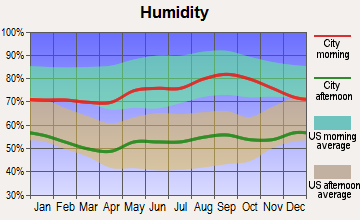
Humidity - Average morning or afternoon humidity
68.8%
68.8%
Humidity - Differences between morning and afternoon humidity
33%
33%
Humidity - Maximum monthly morning or afternoon humidity
81%
81%
Humidity - Minimum monthly morning or afternoon humidity
48%
48%
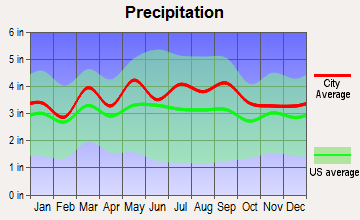
Precipitation - Yearly average
42.7 in
43.4 in
Snowfall - Yearly average
32.4 in
32.4 in
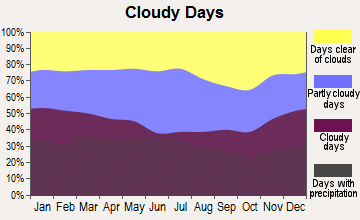
Clouds - Number of days clear of clouds
15.9%
15.9%
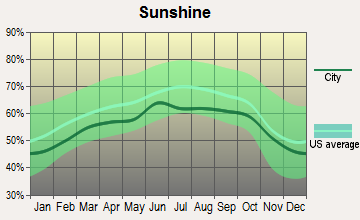
Sunshine amount - Average
61.5%
61.5%
Sunshine amount - Differences during a year
21%
21%
Sunshine amount - Maximum monthly
66%
66%
Sunshine amount - Minimum monthly
45%
45%
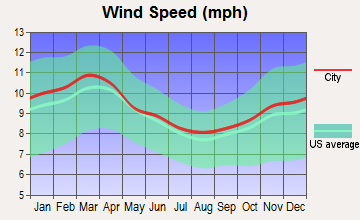
Wind speed - Average
9.7 mph
9.7 mph
Average climate in Washington, District of Columbia
Average climate in Arlington, Virginia
Air pollution
Type
AQI
CO
NO2
OZONE
PB
PM10
PM25
SO2
Year
Washington
Arlington
Washington
Arlington
Washington
Arlington
Washington
Arlington
Washington
Arlington
Washington
Arlington
Washington
Arlington
Washington
Arlington
2018
88
88
0.32
0.30
11.6
9.1
23.2
26.2
N/A
N/A
16.4
16.4
8.8
8.4
0.8
0.7
2017
84
84
0.32
0.25
12.3
9.5
24.9
27.7
N/A
N/A
16.5
16.5
9.8
9.0
1.0
0.7
2016
98
98
0.43
0.25
14.7
10.6
24.6
27.5
0.002
0.002
17.2
17.2
9.5
8.7
1.0
0.8
2015
91
91
0.34
0.34
14.8
10.9
26.2
26.7
0.002
0.002
17.0
17.0
10.4
9.5
1.3
1.1
2014
85
85
0.33
0.27
11.6
10.9
25.9
26.2
0.002
0.002
17.1
17.1
10.0
9.3
1.0
1.0
2013
88
90
0.34
0.33
11.7
10.9
25.6
26.6
0.002
0.002
17.3
17.3
11.6
10.1
1.0
0.8
2012
103
104
0.58
0.33
15.2
11.7
27.6
27.9
0.002
0.002
N/A
N/A
12.2
10.9
1.6
1.0
2011
105
105
0.67
0.18
15.4
12.3
27.7
28.4
0.002
0.002
N/A
N/A
11.4
11.0
3.1
1.5
2010
114
114
0.88
0.23
15.9
12.9
29.3
29.8
0.003
0.003
N/A
N/A
9.3
9.7
3.4
2.5
2009
90
90
0.86
0.24
16.2
12.7
24.4
24.7
0.002
0.002
N/A
N/A
7.6
8.1
4.6
2.7
2008
103
103
1.23
0.23
16.2
13.3
25.3
25.8
0.003
0.003
N/A
N/A
8.5
8.9
5.6
4.3
2007
113
113
1.17
0.28
16.8
15.6
27.1
27.7
0.004
0.004
N/A
N/A
10.4
10.4
5.1
4.5
2006
114
114
1.11
0.49
17.2
17.7
25.5
25.9
0.004
0.004
N/A
N/A
10.9
10.9
4.5
4.3
2005
105
105
0.86
0.30
20.5
21.0
22.7
23.6
0.006
0.006
N/A
N/A
11.7
11.7
4.5
5.7
2004
113
114
0.62
0.22
21.3
21.6
20.6
23.5
0.004
0.004
N/A
N/A
11.3
11.3
6.5
5.9
2003
108
108
0.90
0.36
23.6
26.0
20.8
21.7
N/A
N/A
N/A
N/A
12.2
12.2
8.3
6.1
2002
125
131
1.16
0.48
23.7
21.8
25.0
25.9
N/A
N/A
N/A
N/A
N/A
N/A
6.7
6.0
2001
113
111
1.07
0.43
23.9
22.1
22.0
24.1
0.017
0.017
N/A
N/A
N/A
N/A
6.7
7.2
2000
115
110
1.17
0.50
20.2
22.7
19.1
20.2
N/A
N/A
N/A
N/A
N/A
N/A
8.2
10.1
Natural disasters
Type
Washington
Arlington
Tornado activity compared to U.S. average
110.6%
110%
Earthquake activity compared to U.S. average
42.9%
43.5%
Natural disasters compared to U.S. average
19%
14%
Transportation
Both Washington, DC and Arlington have robust public transportation systems, with the Metro rail and bus system serving both areas. However, traffic and commuting times tend to be higher in DC. Arlington's proximity to Washington, DC also provides residents with easy access to the amenities of the nation's capital.
Transport
Type
Washington
Arlington
Amtrak stations
1
0
Amtrak stations nearby
3
3
FAA registered aircraft
456
103
FAA registered aircraft manufacturers and dealers
3
5
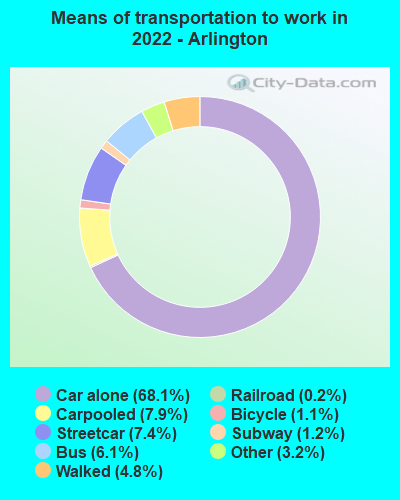
Means of transportation to work
Type
Washington
Arlington
Bicycle
2%
0.8%
Bus
6.3%
3.6%
Carpooled
7.8%
6.5%
Car alone
62.5%
71.3%
Motorcycle
0.1%
0.1%
Railroad
0.3%
0.4%
Streetcar
10.6%
7.8%
Subway
1.3%
1.1%
Taxicab
0.8%
0.4%
Walked
5.7%
6%
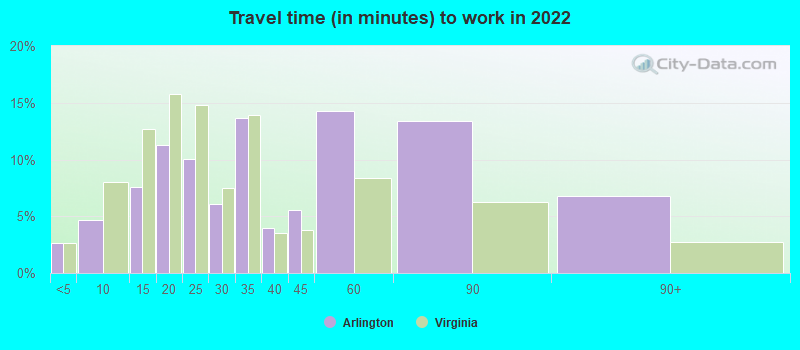
Average travel time to work
Type
Washington
Arlington
Average
39.2 min
34.8 min
Other means
26 min
25.7 min
Public transportation
38.9 min
36.7 min
Private vehicle occupancy
Type
Washington
Arlington
Average
1.1
1.1
Drove alone
89.4%
92.8%
In 2 person carpool
9.7%
6.3%
In 3 person carpool
0.6%
0.8%
In 4 person carpool
0.4%
0.1%
How many people usually rode to work in the car, truck or van.
Real Estate
Real estate in Washington, DC features historic row houses, high-rise apartments, and condos, with prices substantially higher than the national median. On the other hand, properties in Arlington tend to be more suburban-feel single-family homes, townhouses, and modern condos. The real estate market in both places is competitive.
Neighborhoods
Washington, DC boasts diverse and vibrant neighborhoods from the hip streets of Georgetown to the historic charm of Capitol Hill. Arlington's neighborhoods, on the other hand, tend to be quieter and more residential, like the leafy charm of Cherrydale or the walkable urban village of Clarendon.
Houses and residents
Type
Washington
Arlington
Houses
357,482
119,446
Average household size (people)
2.1
2.1
Median year apartment built
1965
1983
Median year house/condo built
1941
1959
Length of stay in the house since moving in
13.5 years
12.7 years
Houses occupied
319,565 (89.4%)
108,396 (90.7%)
Houses occupied by owners
132,936 (41.6%)
47,577 (43.9%)
Houses occupied by renters
186,629 (58.4%)
60,819 (56.1%)
Median rent asked for vacant for-rent units
$2,791
$3,620
Median monthly housing costs
$1,817
$2,164
Median price asked for vacant for-sale houses and condos
$996,150
$891,291
Estimated median house or condo value
$669,900
$779,400
Median numbers of rooms
3.8
4.1
Median number of rooms in apartments
3.1
3.3
Median number of rooms in houses and condos
6
6.7
Median house price - detached houses
Over $1,000,000
Over $1,000,000
Median house price - in 2-unit structures
Over $1,000,000
$648,538
Median house price - in 3-to-4-unit structures
$471,443
$442,578
Median house price - in 5 or more unit structures
$527,983
$566,559
Median house price - Townhouses or other attached units
$817,288
$703,291
Median house price - All housing units
$790,542
$877,770
Median house age
65
47
Renting percentage
58%
56.7%
Housing density (houses/condos per square mile)
5,821.9
4,617.2
House value disparities
26.7%
24.9%
Household income disparities
45.7%
37.5%
Median household income for houses/condes with a mortgage
$163,111
$201,635
Median household income for apartments without a mortgage
$108,852
$133,857
Housing units without a mortgage
777 (0.8%)
596 (1.6%)
Housing units with both a second mortgage and home equity loan
8,586 (8.5%)
3,235 (8.9%)
Housing units with a mortgage
100,122 (99.2%)
35,674 (98.4%)
Housing units with a home equity loan
1,057 (1%)
101 (0.3%)
Housing units with a second mortgage
12,793 (12.7%)
4,221 (11.6%)
House/condo owner moved in on average (years ago)
10
10
House/condo renter moved in on average (years ago)
1
1
Housing units lacking complete kitchen facilities
1.5%
0.7%
Housing units lacking complete plumbing facilities
1.5%
0.2%
Housing units in structures
Housing units in structures
Washington
Arlington
One, detached
11.2%
25.1%
One, attached
22.2%
9.6%
Two
2.7%
0.8%
3 or 4
6.8%
3.5%
5 to 9
7.3%
5.2%
10 to 19
8.5%
5.0%
20 to 49
7.6%
4.6%
50 or more
33.6%
46.1%
Mobile homes
0.2%
0.2%
Median real estate property taxes paid for housing units
Self-employed workers in own not incorporated business
16,654
6,119
State government workers
6,699
1,820
Unpaid family workers
580
32
Industries and Occupations
The industries in Washington, DC center around government, law, lobbying, and international diplomacy. IT and healthcare are also significant sectors. Major employers revolve around Federal agencies, with top private employers being MedStar Health and Georgetown University. In Arlington, government and defense contracting are key. Many residents also commute into DC for work.
In terms of healthcare, both Washington, DC and Arlington, VA have a number of high-quality medical facilities. DC is home to MedStar Georgetown University Hospital and George Washington University Hospital, while Arlington is served by Virginia Hospital Center.
HMDA - Conventional home purchase loans - Applications denied
Year
Washington
Arlington
1999
1,328
226
2000
1,438
196
2001
935
164
2002
886
146
2003
1,319
288
2004
2,281
461
2005
2,920
589
2006
3,362
563
2007
2,548
412
2008
1,095
272
2009
514
173
Culture and Food
Both cities offer rich cultural experiences. Washington, DC is known for its historical sites, museums, and cultural events, and boasts a diverse food scene with many different cuisines represented. Arlington has its own unique charm and cultural experiences with a variety of local festivals, events, and a growing food scene.
Sports Teams
Stop any Washingtonian on the street and you'll hear about the Redskins, Wizards, Capitals, and Nationals. All the major sports leagues are represented in DC. However, Arlington residents can avail themselves of all that DC offers, since the commute is relatively short and convenient.


 Washington, DC
 Arlington, VA