Washington, D.C., and Hampton, VA offer unique living experiences. The nation’s capital boasts historical significance, robust job markets, and diverse cuisine. On the other hand, Hampton provides a calmer atmosphere located near scenic beaches with a lower cost of living. This comparison will focus on crime/safety, weather, cost of living, education, work & economy, infrastructure, industries & occupations, real-estate, neighborhoods, transportation, taxes, culture/food, sports teams, geographical conditions, healthcare for tourism and potential relocation.
Distance between
Washington, DC and
Hampton, VA : 134.6 miles
Washington's population is larger by 386%. Its population has grown by 97,991 people (17.1%) since 2000. The population of Hampton has decreased by 8,691 people (5.9%) during that time.
Washington, D.C., has a higher crime rate than Hampton, which is a concern for both locals and tourists. D.C.'s higher rate is due to higher property and violent crime rates. That said, crime varies by neighborhood, so research is advised before visiting or moving. On the flip side, Hampton has a lower overall crime rate, but residents still express concerns about safety. It has a crime rate similar to the national average and like any city, some areas are considered safer than others.
City-data.com crime index counts serious crimes and violent crime more heavily. It adjusts for the number of visitors and daily workers commuting into cities. (higher means more crime, U.S. average = 301.1)
City-data.com crime index counts serious crimes and violent crime more heavily. It adjusts for the number of visitors and daily workers commuting into cities. (higher means more crime, U.S. average = 301.1)
Sex Offenders
According to our data, there are 1,075 registered sex offenders living in Washington and 516 registered sex offenders living in . The ratio of residents to sex offenders in Washington is 634 to 1; the ratio in Hampton is 262 to 1. The number of registered sex offenders compared to the number of residents is a smaller in Washington than in Hampton.
Cost of Living
The cost of living in Washington, D.C. is notably higher than in Hampton. Housing costs are particularly higher in D.C., which greatly influences the cost of living. Meanwhile, Hampton offers a significantly more affordable lifestyle with lower housing, grocery, and healthcare costs.
Income Tax
In Washington, D.C., the income tax rate ranges from 4% to 8.95%, depending on income level. Virginia, including Hampton, has an income tax rate that varies between 2% and 5.75%.
Property Tax
The property tax rate in Washington, D.C. is quite lower than the national average. In contrast, Hampton’s property tax is comparatively higher than D.C., but it is about average when compared to the national average.
Sales Tax
Washington, D.C. has a sales tax rate of 6%, while Hampton, part of Virginia, has a combined state and local sales tax rate of 6%.
Income
Type
Washington
Hampton
Estimated median household income
$90,088
$57,647
Estimated per capita income
$65,808
$34,250
Cost of living index (U.S. average is 100)
124.2
96.1
If you make $50,000 in Hampton, you will have to make $64,620 in Washington to maintain the same standard of living.
Geographical Conditions
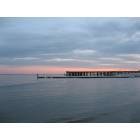
Washington, D.C. is located on the eastern seaboard, with the Potomac River flowing through it. It's flat and urban but has many parks and nature reserves. Hampton is more coastal and offers beach access, maritime forests, and protected wetlands, attracting those who enjoy an active outdoor lifestyle.
Both cities offer high-quality education systems. Washington, D.C. is known for its wide range of high-ranking public and private schools, as well as prestigious universities like Georgetown and George Washington University. Hampton also has good public and private schools, and is home to Hampton University, a respected historically black university.
Washington, D.C.'s economy is strongly influenced by the presence of the federal government, which provides numerous jobs. In addition, a strong job market in sectors such as healthcare, education, and technology exist. Hampton's economy is more tied to its military bases and industrial sectors, although tourism and retail are also significant.
Biggest Employers
In Washington, D.C., the largest employers are the federal government, Georgetown University, and George Washington University. In Hampton, the top employers include Hampton City Schools, Sentara Healthcare, and Huntington Ingalls Industries.
There were 376 building permits issued in Washington in 2012 (149 more than in 2011) compared to 242 building permits issued in Hampton in 2012 (78 more than in 2011).
In Washington (District of Columbia), 90.9% voted for Democrats and 7.3% for Republicans in 2012 Presidential Election. In Hampton (Hampton city), 71.0% voted for Democrats and 28.2% for Republicans.
Elections
Type
Democrats
Republicans
Other
Year
Washington
Hampton
Washington
Hampton
Washington
Hampton
2020
92.6%
70.1%
5.4%
28.0%
2.0%
1.9%
2016
90.9%
66.3%
4.1%
28.7%
5.0%
4.9%
2012
90.9%
71.0%
7.3%
28.2%
1.8%
0.8%
2008
92.5%
69.6%
6.5%
30.4%
1.0%
0.0%
2004
89.6%
57.6%
9.4%
42.1%
1.0%
0.3%
2000
85.2%
57.5%
9.0%
41.0%
5.9%
1.5%
1996
85.2%
55.0%
9.3%
37.3%
5.5%
7.7%
Breakdown of population affiliated with a religious congregation
Type
Adherents
Congregations
Religion
Washington
Hampton
Washington
Hampton
CATHOLIC CHURCH
12.6%
3.9%
7.4%
4.1%
AMERICAN BAPTIST CHURCHES IN THE USA
6.2%
2.2%
10.3%
3.4%
SOUTHERN BAPTIST CONVENTION
4.4%
11.4%
10.3%
13.8%
EPISCOPAL CHURCH
3.1%
1.0%
5.3%
2.8%
SEVENTH DAY ADVENTIST CHURCH
0.9%
0.5%
1.8%
2.1%
MUSLIM ESTIMATE
0.7%
5.0%
1.1%
1.4%
EVANGELICAL LUTHERAN CHURCH IN AMERICA
0.5%
0.7%
2.1%
1.4%
MENNONITE CHURCH USA
0.0%
1.7%
0.5%
0.7%
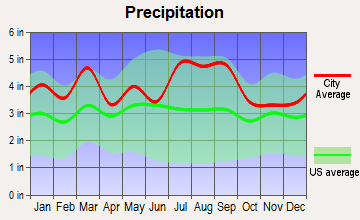
Weather
In terms of weather, both cities experience four seasons with hot summers and cold winters. However, the coastal location of Hampton often results in relatively milder winters and more humidity in the summer. Additionally, Hampton may experience occasional hurricanes. Washington, D.C. sees occasional snowstorms in winter and hot, humid summers influenced by nearby bodies of water.
Weather and climate
Type
Washington
Hampton
Temperature - Average
56.4°F
59.2°F
Humidity - Average morning or afternoon humidity
68.8%
73%
Humidity - Differences between morning and afternoon humidity
33%
32%
Humidity - Maximum monthly morning or afternoon humidity
81%
83%
Humidity - Minimum monthly morning or afternoon humidity
48%
51%
Precipitation - Yearly average
42.7 in
47.8 in
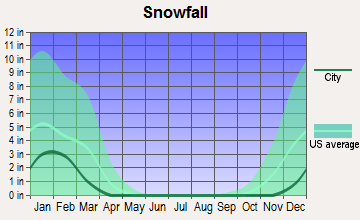
Snowfall - Yearly average
32.4 in
15.4 in
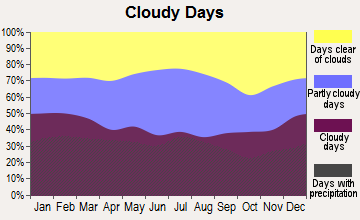
Clouds - Number of days clear of clouds
15.9%
17.6%
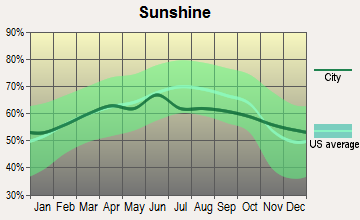
Sunshine amount - Average
61.5%
66.8%
Sunshine amount - Differences during a year
21%
14%
Sunshine amount - Maximum monthly
66%
67%
Sunshine amount - Minimum monthly
45%
53%
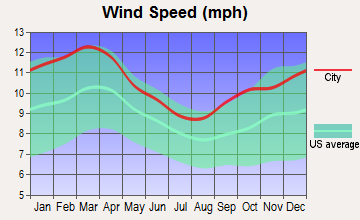
Wind speed - Average
9.7 mph
10.4 mph
Average climate in Washington, District of Columbia
Average climate in Hampton, Virginia
Air pollution
Type
AQI
CO
NO2
OZONE
PB
PM10
PM25
SO2
Year
Washington
Hampton
Washington
Hampton
Washington
Hampton
Washington
Hampton
Washington
Hampton
Washington
Washington
Hampton
Washington
Hampton
2018
88
57
0.32
0.17
11.6
3.3
23.2
33.1
N/A
0.002
16.4
N/A
8.8
6.1
0.8
0.6
2017
84
60
0.32
0.19
12.3
3.6
24.9
34.1
N/A
0.002
16.5
N/A
9.8
6.9
1.0
0.4
2016
98
66
0.43
0.17
14.7
3.4
24.6
33.1
0.002
0.002
17.2
N/A
9.5
6.1
1.0
0.7
2015
91
57
0.34
0.28
14.8
3.8
26.2
35.1
0.002
0.002
17.0
N/A
10.4
6.4
1.3
0.8
2014
85
59
0.33
0.25
11.6
3.9
25.9
34.8
0.002
0.002
17.1
N/A
10.0
6.8
1.0
1.0
2013
88
66
0.34
0.30
11.7
3.9
25.6
32.5
0.002
0.002
17.3
N/A
11.6
6.8
1.0
1.1
2012
103
76
0.58
0.26
15.2
5.1
27.6
36.3
0.002
0.002
N/A
N/A
12.2
8.1
1.6
1.0
2011
105
66
0.67
0.29
15.4
5.3
27.7
36.7
0.002
0.003
N/A
N/A
11.4
8.8
3.1
1.4
2010
114
80
0.88
0.15
15.9
6.4
29.3
39.7
0.003
0.004
N/A
N/A
9.3
N/A
3.4
2.3
2009
90
54
0.86
0.20
16.2
9.8
24.4
31.5
0.002
0.012
N/A
N/A
7.6
N/A
4.6
1.9
2008
103
77
1.23
0.20
16.2
10.3
25.3
36.2
0.003
0.004
N/A
N/A
8.5
N/A
5.6
3.0
2007
113
81
1.17
0.23
16.8
12.2
27.1
35.1
0.004
0.004
N/A
N/A
10.4
N/A
5.1
3.5
2006
114
62
1.11
0.29
17.2
N/A
25.5
34.2
0.004
0.004
N/A
N/A
10.9
N/A
4.5
3.5
2005
105
67
0.86
0.28
20.5
N/A
22.7
34.3
0.006
N/A
N/A
N/A
11.7
N/A
4.5
3.2
2004
113
80
0.62
0.31
21.3
15.9
20.6
32.5
0.004
N/A
N/A
N/A
11.3
N/A
6.5
3.7
2003
108
84
0.90
0.39
23.6
16.2
20.8
33.1
N/A
N/A
N/A
N/A
12.2
N/A
8.3
3.0
2002
125
99
1.16
0.37
23.7
17.8
25.0
37.2
N/A
N/A
N/A
N/A
N/A
N/A
6.7
3.4
2001
113
92
1.07
0.44
23.9
18.2
22.0
34.9
0.017
N/A
N/A
N/A
N/A
N/A
6.7
4.1
2000
115
85
1.17
0.49
20.2
15.7
19.1
34.9
N/A
N/A
N/A
N/A
N/A
N/A
8.2
5.0
Natural disasters
Type
Washington
Hampton
Tornado activity compared to U.S. average
110.6%
72.9%
Earthquake activity compared to U.S. average
42.9%
37.4%
Natural disasters compared to U.S. average
19%
0%
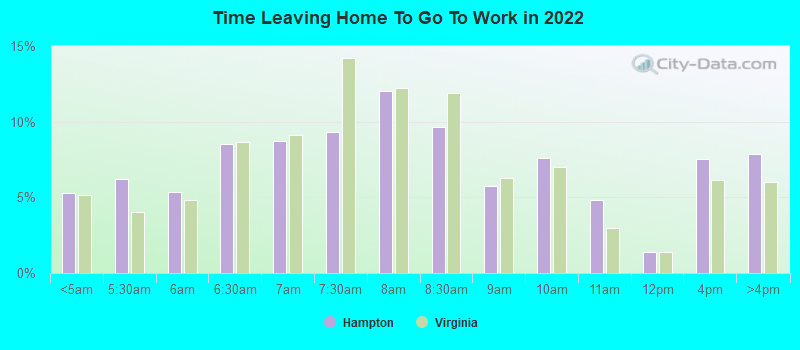
Transportation
Washington, D.C. has excellent public transit, including the Metro system and numerous bus routes. Traffic is prevalent, but many residents commute by public transit or biking. Hampton has limited public transit options, and many residents rely on private vehicles. Traffic is lighter, making it a more car-friendly city.
Transport
Type
Washington
Hampton
Amtrak stations
1
0
Amtrak stations nearby
3
2
FAA registered aircraft
456
107
FAA registered aircraft manufacturers and dealers
3
0
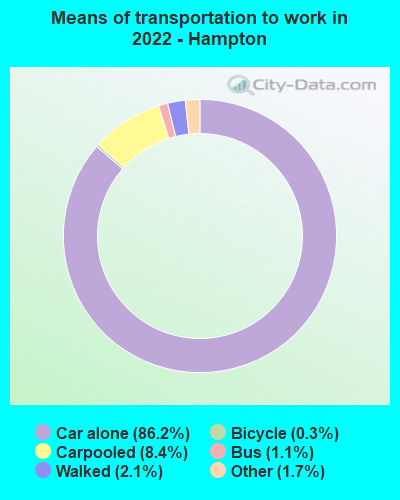
Means of transportation to work
Type
Washington
Hampton
Bicycle
2%
0.3%
Bus
6.3%
1.8%
Carpooled
7.8%
7.4%
Car alone
62.5%
86.1%
Motorcycle
0.1%
0.1%
Railroad
0.3%
0%
Streetcar
10.6%
0%
Subway
1.3%
0%
Taxicab
0.8%
0.2%
Walked
5.7%
2.5%
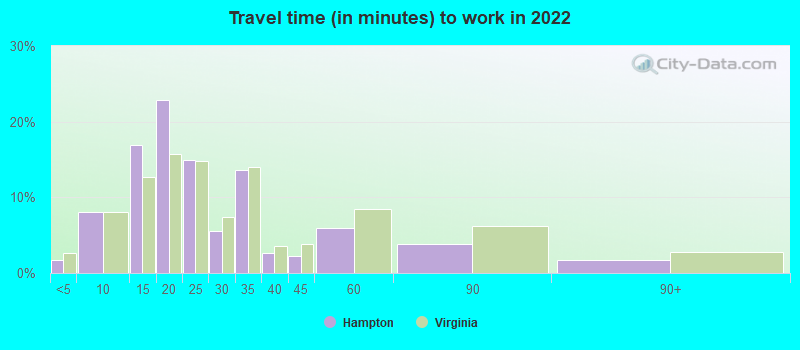
Average travel time to work
Type
Washington
Hampton
Average
39.2 min
24.4 min
Other means
26 min
22.4 min
Public transportation
38.9 min
43.8 min
Private vehicle occupancy
Type
Washington
Hampton
Average
1.1
1.1
Drove alone
89.4%
91.7%
In 2 person carpool
9.7%
6.6%
In 3 person carpool
0.6%
1.1%
In 4 person carpool
0.4%
0.4%
In 5-6 person carpool
0%
0.2%
How many people usually rode to work in the car, truck or van.
Real Estate
Real estate in Washington, D.C. is pricier compared to Hampton, largely due to higher demand and limited supply. A broad range of housing types is available, with row houses and condos being common. Hampton real estate is less expensive, offering more single-family homes in various styles.
Neighborhoods
Washington, D.C. offers diverse neighborhoods ranging from dense downtown cityscapes to quiet, tree-lined suburbs. Each neighborhood has its own character, with many offering historic homes and local shops. Hampton also offers a variety of neighborhoods, some with waterfront views, others located near historic sites or major employers.
Houses and residents
Type
Washington
Hampton
Houses
357,482
62,528
Average household size (people)
2.1
2.4
Median year apartment built
1965
1977
Median year house/condo built
1941
1969
Length of stay in the house since moving in
13.5 years
14.7 years
Houses occupied
319,565 (89.4%)
58,181 (93%)
Houses occupied by owners
132,936 (41.6%)
31,662 (54.4%)
Houses occupied by renters
186,629 (58.4%)
26,519 (45.6%)
Median rent asked for vacant for-rent units
$2,791
$935.15
Median monthly housing costs
$1,817
$1,204
Median price asked for vacant for-sale houses and condos
$996,150
$461,923
Estimated median house or condo value
$669,900
$211,900
Median numbers of rooms
3.8
5.6
Median number of rooms in apartments
3.1
4.4
Median number of rooms in houses and condos
6
6.6
Median house price - detached houses
Over $1,000,000
$237,519
Median house price - in 5 or more unit structures
$527,983
$419,879
Median house price - Townhouses or other attached units
$817,288
$155,959
Median house price - All housing units
$790,542
$230,261
Median house age
65
48
Renting percentage
58%
41.9%
Housing density (houses/condos per square mile)
5,821.9
1,207.5
House value disparities
26.7%
30.3%
Household income disparities
45.7%
43.1%
Median household income for houses/condes with a mortgage
$163,111
$84,995
Median household income for apartments without a mortgage
$108,852
$61,599
Housing units without a mortgage
777 (0.8%)
552 (2.5%)
Housing units with both a second mortgage and home equity loan
8,586 (8.5%)
1,775 (7.9%)
Housing units with a mortgage
100,122 (99.2%)
21,963 (97.5%)
Housing units with a home equity loan
1,057 (1%)
130 (0.6%)
Housing units with a second mortgage
12,793 (12.7%)
3,058 (13.6%)
House/condo owner moved in on average (years ago)
10
14
House/condo renter moved in on average (years ago)
1
1
Housing units lacking complete kitchen facilities
1.5%
0.6%
Housing units lacking complete plumbing facilities
1.5%
0.6%
Housing units in structures
Housing units in structures
Washington
Hampton
One, detached
11.2%
64.7%
One, attached
22.2%
6.6%
Two
2.7%
1.6%
3 or 4
6.8%
5.2%
5 to 9
7.3%
6.8%
10 to 19
8.5%
7.7%
20 to 49
7.6%
1.2%
50 or more
33.6%
4.1%
Mobile homes
0.2%
2.0%
Median real estate property taxes paid for housing units
Self-employed workers in own not incorporated business
16,654
1,776
State government workers
6,699
3,850
Unpaid family workers
580
162
Industries and Occupations
The main industries in Washington, D.C. are the federal government, education, and health services, although professional and business services are also substantial. Hampton's primary industries are defense, retail trade, and healthcare; however, manufacturing also plays a significant role.
Washington, D.C. has a high concentration of top-notch hospitals and healthcare facilities. This includes renowned institutions such as MedStar Washington Hospital Center and George Washington University Hospital. In Hampton, the care level is reliable with good hospitals including Sentara Hampton General Hospital.
Health (county statistics)
Type
Washington
Hampton
General health status score of residents in this county from 1 (poor) to 5 (excellent)
Washington, D.C. has well-developed infrastructure, with modern buildings, extensive public transportation, and numerous cultural attractions. Hampton, though smaller, also has good infrastructure; it boasts historical sites, good roads, and plenty of amenities.
HMDA - Conventional home purchase loans - Applications denied
Year
Washington
Hampton
1999
1,328
0
2000
1,438
0
2001
935
0
2002
886
0
2003
1,319
295
2004
2,281
489
2005
2,920
576
2006
3,362
588
2007
2,548
376
2008
1,095
87
2009
514
29
Culture and Food
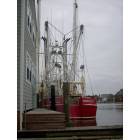
Washington, D.C.'s cultural scene is diverse and rich, with numerous museums, art galleries, theaters, and ethnic neighborhoods. The food scene is equally diverse, catering to a wide variety of tastes. Hampton also has a vibrant culture influenced by its maritime history and military presence. Seafood is a culinary staple in Hampton, with the Chesapeake Bay Blue Crab being a delicacy.
Sports Teams
Washington, D.C. is home to several professional sports teams, including the Washington Football Team (NFL), the Washington Nationals (MLB), and the Washington Capitals (NHL). Hampton lacks professional teams, but residents support regional pro sports teams and enjoy local college sports.


 Washington, DC
 Hampton, VA