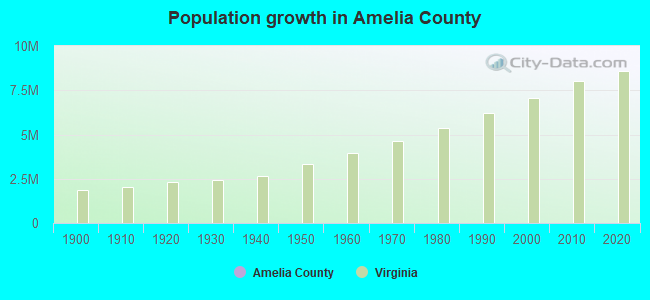
Amelia County, Virginia (VA)
County owner-occupied free and clear houses and condos in 2010: 1,236
County owner-occupied houses and condos in 2000: 3,477
Renter-occupied apartments: 900 (it was 763 in 2000)
| % of renters here: | 18% |
| State: | 33% |
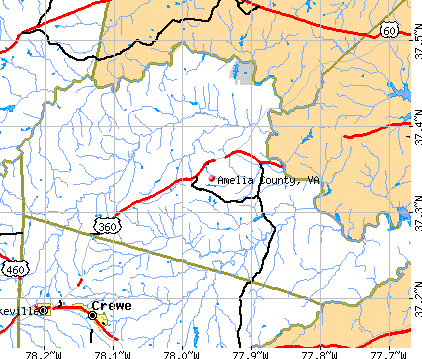
Land area: 357 sq. mi.
Water area: 1.7 sq. mi.
Population density: 38 people per square mile (low).
Industries providing employment: Construction (17.2%), Educational, health and social services (16.7%), Retail trade (13.4%), Professional, scientific, management, administrative, and waste management services (11.2%).
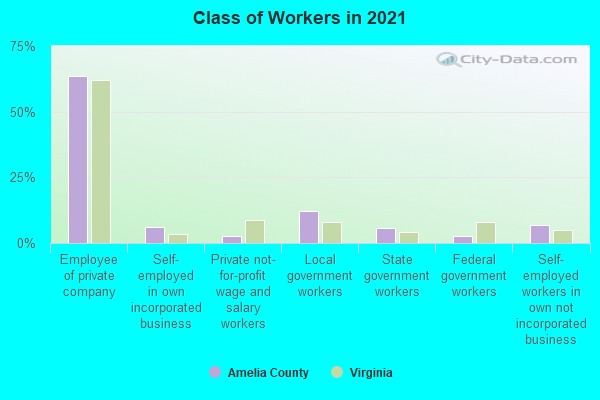
Type of workers:
- Private wage or salary: 74%
- Government: 19%
- Self-employed, not incorporated: 7%
- Unpaid family work: 0%
- OSM Map
- General Map
- Google Map
- MSN Map

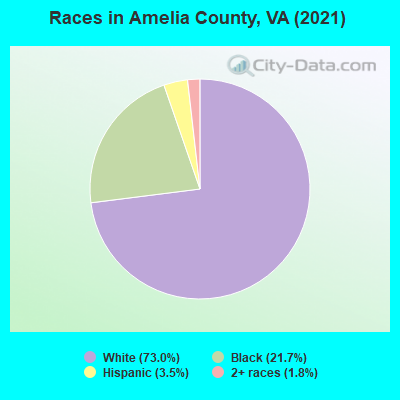
- 9,60072.4%White Non-Hispanic Alone
- 2,66320.1%Black Non-Hispanic Alone
- 5143.9%Two or more races
- 4763.6%Hispanic or Latino
- 10.01%Asian alone
| Median resident age: | 45.4 years |
| Virginia median age: | 39.0 years |
| Males: 6,577 | |
| Females: 6,823 |

 | Dinwiddie Virginia (4 replies) |
| Live in Richmond, work in Amelia County? (0 replies) |
| Need "Country Like" / "Rural Like" Areas Of Richmond (5 replies) |
| State Senate Approves additional $300 million for Phase Two of Silver Line (80 replies) |
| Seeking advice about school distrcits in VA (11 replies) |
| Another soon-to-be newcomer to the area! (6 replies) |
| Amelia County: | 2.0 people |
| Virginia: | 3 people |
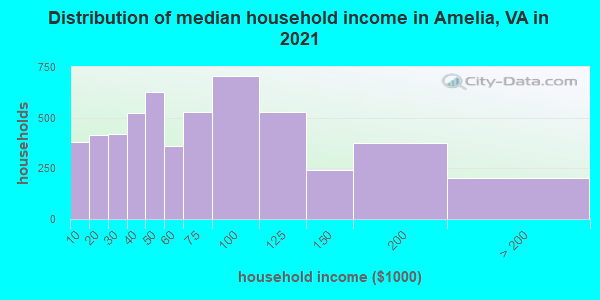
Estimated median household income in 2022: $62,437 ($40,252 in 1999)
| This county: | $62,437 |
| Virginia: | $85,873 |
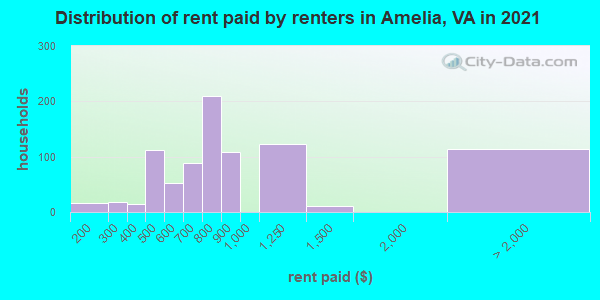
Median contract rent in 2022 for apartments: $795 (lower quartile is $704, upper quartile is $1,033)
| This county: | $795 |
| State: | $1270 |
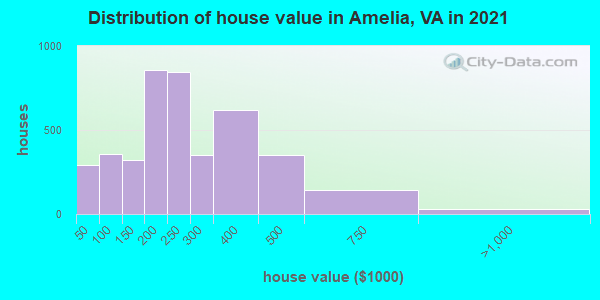
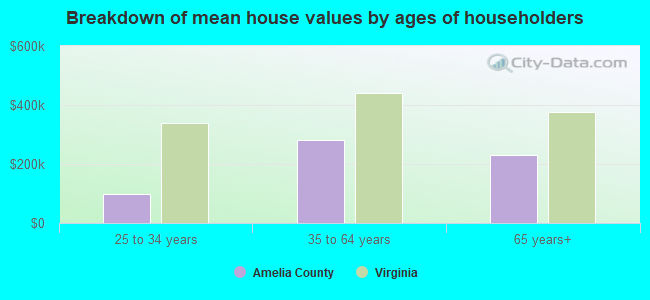
Estimated median house or condo value in 2022: $251,513 (it was $92,200 in 2000)
| Amelia: | $251,513 |
| Virginia: | $365,700 |
Mean price in 2022:
Median monthly housing costs for homes and condos with a mortgage: $1,531Detached houses: $328,676
Here: $328,676 State: $472,865 Townhouses or other attached units: $385,165
Here: $385,165 State: $457,437 Mobile homes: $163,903
Here: $163,903 State: $100,736
Median monthly housing costs for units without a mortgage: $364
Institutionalized population: 99
Crime in 2021 (reported by the sheriff's office or county police, not the county total):
- Murders: 1
- Rapes: 6
- Robberies: 0
- Assaults: 17
- Burglaries: 29
- Thefts: 108
- Auto thefts: 16
Crime in 2020 (reported by the sheriff's office or county police, not the county total):
- Murders: 1
- Rapes: 3
- Robberies: 1
- Assaults: 13
- Burglaries: 27
- Thefts: 81
- Auto thefts: 14
Health of residents in Amelia County based on CDC Behavioral Risk Factor Surveillance System Survey Questionnaires from 2013 to 2021:
General health status score of residents in this county from 1 (poor) to 5 (excellent) is 3.5. This is about average.73.5% of residents exercised in the past month. This is about average.
42.1% of residents smoked 100+ cigarettes in their lives. This is about average.
54.8% of adult residents drank alcohol in the past 30 days. This is less than average.
74.3% of residents visited a dentist within the past year. This is about average.
Average weight of males is 200 pounds. This is more than average.
Average weight of females is 167 pounds. This is more than average.
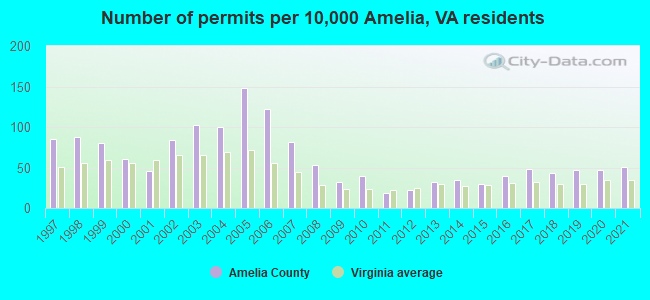
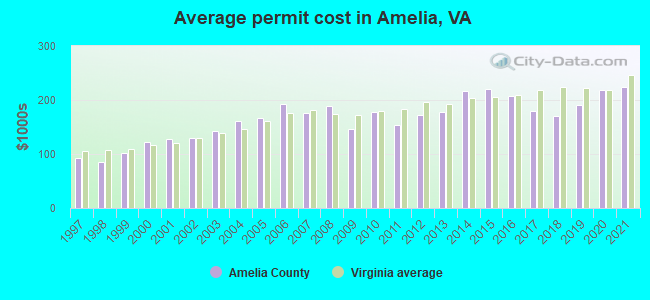
Single-family new house construction building permits:
- 2022: 73 buildings, average cost: $270,400
- 2021: 58 buildings, average cost: $223,800
- 2020: 54 buildings, average cost: $218,800
- 2019: 54 buildings, average cost: $190,900
- 2018: 49 buildings, average cost: $170,300
- 2017: 55 buildings, average cost: $178,900
- 2016: 44 buildings, average cost: $207,000
- 2015: 34 buildings, average cost: $219,800
- 2014: 40 buildings, average cost: $215,800
- 2013: 37 buildings, average cost: $176,500
- 2012: 25 buildings, average cost: $172,500
- 2011: 22 buildings, average cost: $153,000
- 2010: 44 buildings, average cost: $176,500
- 2009: 36 buildings, average cost: $146,700
- 2008: 60 buildings, average cost: $187,900
- 2007: 94 buildings, average cost: $175,900
- 2006: 139 buildings, average cost: $193,400
- 2005: 169 buildings, average cost: $167,200
- 2004: 114 buildings, average cost: $161,800
- 2003: 116 buildings, average cost: $142,400
- 2002: 96 buildings, average cost: $129,900
- 2001: 53 buildings, average cost: $128,200
- 2000: 69 buildings, average cost: $123,000
- 1999: 91 buildings, average cost: $101,600
- 1998: 100 buildings, average cost: $84,900
- 1997: 97 buildings, average cost: $92,100
Median real estate property taxes paid for housing units with mortgages in 2022: $1,157 (0.4%)
Median real estate property taxes paid for housing units with no mortgage in 2022: $780 (0.3%)
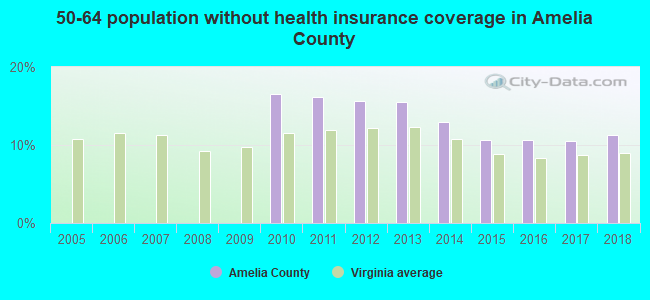
| Amelia County: | 11.8% |
| Virginia: | 10.6% |
Median age of residents in 2022: 45.4 years old
(Males: 45.2 years old, Females: 45.8 years old)
(Median age for: White residents: 45.4 years old, Black residents: 51.7 years old, Hispanic or Latino residents: 28.8 years old)
Area name: Richmond, VA HUD Metro FMR Area
Fair market rent in 2006 for a 1-bedroom apartment in Amelia County is $678 a month.
Fair market rent for a 2-bedroom apartment is $757 a month.
Fair market rent for a 3-bedroom apartment is $1010 a month.
Cities in this county include: Amelia Court House.
Notable locations in this county outside city limits:
Notable locations in Amelia County: Oldfield (A), Nances Shop (B), Charles City Landfill (C), Cherry Hall (D), Hughes Store (E), Harrison Lake National Fish Hatchery (F), Blanks Tavern (G), Camp Weyanoke (H), Willcox Wharf (I), Binns Hall (J), Adkins Store (K), Wyanoke Wharf (L), Kimmages Wharf (M), Evelynton Plantation (N), Edgewood Plantation (O), Cypress Bank Landing (P), Graves Landing (Q), Harrisons Landing (R), Oldhouse Landing (S), Winns Landing (T). Display/hide their locations on the map
Churches in Amelia County include: Bethany Church (A), Cedar Grove Church (B), Elam Church (C), Gillfield Church (D), Jerusalem Church (E), Liberty Church (F), Little Elam Church (G), Mount Pleasant Church (H), Mount Stirling Church (I). Display/hide their locations on the map
Cemeteries: Chapel Cemetery (1), Eiam Cemetery (2), Grace Chapel Cemetery (3), Union Cemetery (4), Salem Cemetery (5), Mapsico Cemetery (6), Mount Pleasant Cemetery (7). Display/hide their locations on the map
Reservoirs and swamps: Charles Lake (A), Harrison Lake (B), Lake Charles (C), Lake Harrison (D), Sunken Marsh (E). Display/hide their locations on the map
Streams, rivers, and creeks: Salem Run (A), Potato Run (B), Possum Run (C), Parson Creek (D), Morris Creek (E), Mapsico Creek (F), Kittewan Creek (G), Kimages Creek (H), Kennon Creek (I). Display/hide their locations on the map
Parks in Amelia County include: Chickahominy State Wildlife Management Area (1), Shirley Plantation (2), Berkeley Plantation (3). Display/hide their locations on the map
Neighboring counties: Boyle County, Kentucky  , Charlotte County
  , Merced County, California , Hopkins County, Kentucky , Lynchburg city , Salem city .
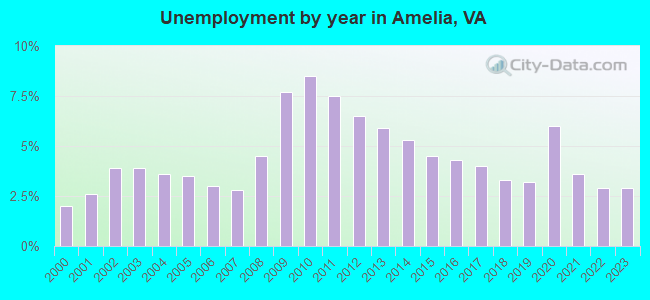
| Here: | 2.7% |
| Virginia: | 2.7% |
Current college students: 219
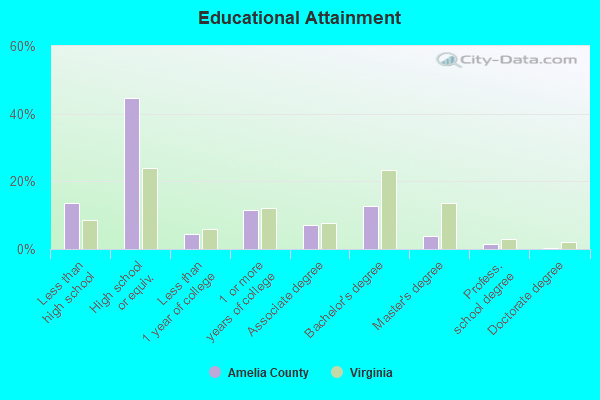
People 25 years of age or older with a high school degree or higher: 86.4%
People 25 years of age or older with a bachelor's degree or higher: 17.7%
Number of foreign born residents: 139 (21.3% naturalized citizens)
| Amelia County: | 1.0% |
| Whole state: | 12.7% |
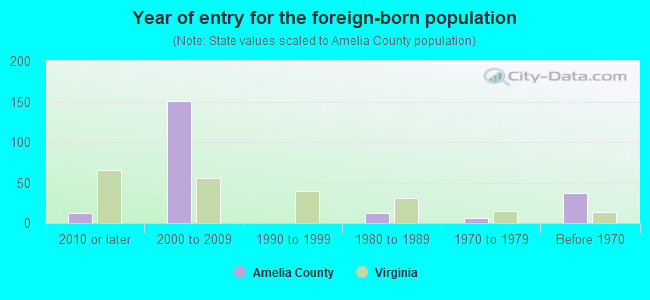
- Year of entry for the foreign-born population
- 392010 or later
- 772000 to 2009
- 01990 to 1999
- 121980 to 1989
- 61970 to 1979
- 37Before 1970
Mean travel time to work (commute): $ minutes
Percentage of county residents living and working in this county: 101.1%
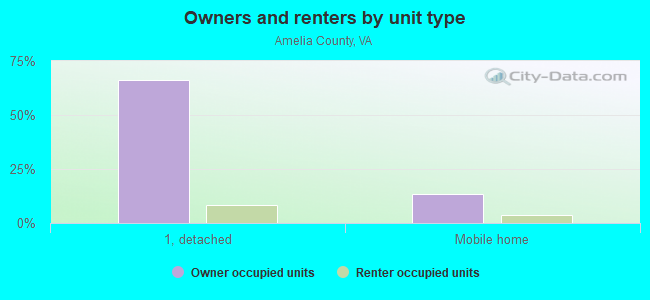
Housing units in structures:
- One, detached: 4,519
- 5 to 9: 56
- 50 or more: 28
- Mobile homes: 1,172
Housing units in Amelia County with a mortgage: 2,566 (173 second mortgage, 23 home equity loan, 94 both second mortgage and home equity loan)
Houses without a mortgage: 0
| Here: | 100.0% with mortgage |
| State: | 97.2% with mortgage |
Religion statistics for Amelia County

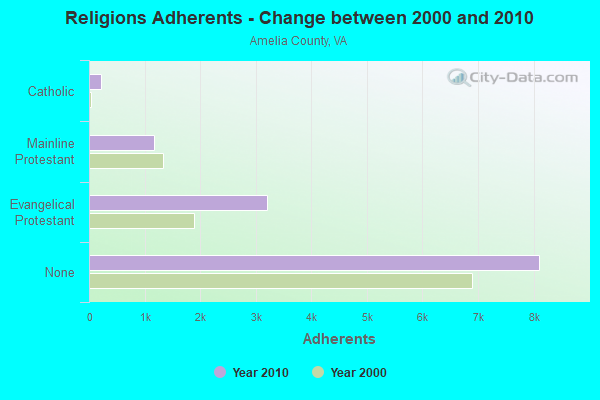
| Religion | Adherents | Congregations |
|---|---|---|
| Evangelical Protestant | 3,196 | 14 |
| Mainline Protestant | 1,164 | 15 |
| Catholic | 218 | 1 |
| Other | 5 | 1 |
| None | 8,107 | - |
Source: Clifford Grammich, Kirk Hadaway, Richard Houseal, Dale E.Jones, Alexei Krindatch, Richie Stanley and Richard H.Taylor. 2012. 2010 U.S.Religion Census: Religious Congregations & Membership Study. Association of Statisticians of American Religious Bodies. Jones, Dale E., et al. 2002. Congregations and Membership in the United States 2000. Nashville, TN: Glenmary Research Center.
Food Environment Statistics:
| Amelia County: | 1.58 / 10,000 pop. |
| State: | 2.03 / 10,000 pop. |
| Amelia County: | 5.54 / 10,000 pop. |
| Virginia: | 4.03 / 10,000 pop. |
| This county: | 3.96 / 10,000 pop. |
| State: | 7.65 / 10,000 pop. |
| Amelia County: | 11.1% |
| Virginia: | 9.3% |
| Amelia County: | 29.7% |
| State: | 26.7% |
| Here: | 12.8% |
| State: | 18.6% |
Agriculture in Amelia County:
Average size of farms: 200 acresAverage value of agricultural products sold per farm: $113,163
Average value of crops sold per acre for harvested cropland: $146.96
The value of nursery, greenhouse, floriculture, and sod as a percentage of the total market value of agricultural products sold: 0.13%
The value of livestock, poultry, and their products as a percentage of the total market value of agricultural products sold: 93.46%
Average total farm production expenses per farm: $94,398
Harvested cropland as a percentage of land in farms: 25.19%
Average market value of all machinery and equipment per farm: $33,056
The percentage of farms operated by a family or individual: 90.57%
Average age of principal farm operators: 58 years
Average number of cattle and calves per 100 acres of all land in farms: 16.95
Milk cows as a percentage of all cattle and calves: 14.87%
Corn for grain: 1406 harvested acres
All wheat for grain: 843 harvested acres
Soybeans for beans: 5984 harvested acres
Land in orchards: 6 acres
Tornado activity:
Amelia County historical area-adjusted tornado activity is significantly below Virginia state average. It is 2536349.8 times below overall U.S. average.Tornadoes in this county have caused 15 injuries recorded between 1950 and 2004.
On 5/8/1984, a category 3 (max. wind speeds 158-206 mph) tornado injured 15 people and caused between $500,000 and $5,000,000 in damages.
Earthquake activity:
Amelia County-area historical earthquake activity is significantly above Virginia state average. It is 50% smaller than the overall U.S. average.On 8/23/2011 at 17:51:04, a magnitude 5.8 (5.8 MW, Depth: 3.7 mi, Class: Moderate, Intensity: VI - VII) earthquake occurred 39.5 miles away from Amelia County center
On 12/9/2003 at 20:59:14, a magnitude 4.5 (4.5 MB, 4.5 LG, Class: Light, Intensity: IV - V) earthquake occurred 17.5 miles away from the county center
On 12/9/2003 at 20:59:18, a magnitude 4.5 (4.5 ML, Depth: 6.2 mi) earthquake occurred 31.1 miles away from the county center
On 8/25/2011 at 05:07:52, a magnitude 4.5 (4.5 ML, Depth: 4.2 mi) earthquake occurred 42.1 miles away from the county center
On 8/9/2020 at 12:07:37, a magnitude 5.1 (5.1 MW, Depth: 4.7 mi) earthquake occurred 183.3 miles away from Amelia County center
On 8/24/2011 at 00:04:36, a magnitude 4.2 (4.2 ML) earthquake occurred 39.9 miles away from the county center
Magnitude types: regional Lg-wave magnitude (LG), body-wave magnitude (MB), local magnitude (ML), moment magnitude (MW)
Most recent natural disasters:
- Virginia Covid-19 Pandemic, Incident Period: January 20, 2020, Major Disaster (Presidential) Declared DR-4512-VA: April 2, 2020, FEMA Id: 4512, Natural disaster type: Other
- Virginia Tropical Storm Michael, Incident Period: October 9, 2018 - October 16, 2018, FEMA Id: 4411, Natural disaster type: Tropical Storm
- Virginia Hurricane Sandy, Incident Period: October 26, 2012 to November 01, 2012, Emergency Declared EM-3359: October 29, 2012, FEMA Id: 3359, Natural disaster type: Hurricane
- Virginia Severe Storms and Straight-line Winds, Incident Period: June 29, 2012 to July 01, 2012, Major Disaster (Presidential) Declared DR-4072: July 27, 2012, FEMA Id: 4072, Natural disaster type: Storm, Wind
- Virginia Hurricane Irene, Incident Period: August 26, 2011 to August 28, 2011, Major Disaster (Presidential) Declared DR-4024: September 03, 2011, FEMA Id: 4024, Natural disaster type: Hurricane
- Virginia Hurricane Katrina Evacuation, Incident Period: August 29, 2005 to October 01, 2005, Emergency Declared EM-3240: September 12, 2005, FEMA Id: 3240, Natural disaster type: Hurricane
- Virginia Hurricane Isabel, Incident Period: September 18, 2003 to October 01, 2003, Major Disaster (Presidential) Declared DR-1491: September 18, 2003, FEMA Id: 1491, Natural disaster type: Hurricane
- Virginia Winter Storm, Incident Period: January 25, 2000 to January 30, 2000, Major Disaster (Presidential) Declared DR-1318: February 28, 2000, FEMA Id: 1318, Natural disaster type: Winter Storm
- Virginia Hurricane Fran, Incident Period: September 05, 1996 to September 23, 1996, Major Disaster (Presidential) Declared DR-1135: September 06, 1996, FEMA Id: 1135, Natural disaster type: Hurricane
- Virginia Blizzard, Incident Period: January 06, 1996 to January 12, 1996, Major Disaster (Presidential) Declared DR-1086: January 13, 1996, FEMA Id: 1086, Natural disaster type: Blizzard
- 6 other natural disasters have been reported since 1953.
The number of natural disasters in Amelia County (16) is near the US average (15).
Major Disasters (Presidential) Declared: 10
Emergencies Declared: 5
Causes of natural disasters: Hurricanes: 5, Storms: 3, Droughts: 2, Floods: 2, Tropical Storms: 2, Winter Storms: 2, Blizzard: 1, Ice Storm: 1, Wind: 1, Other: 1 (Note: some incidents may be assigned to more than one category).
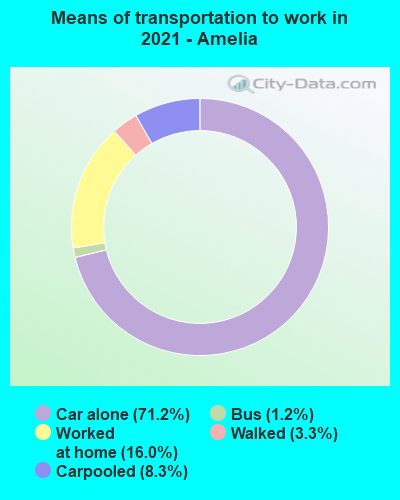
Means of transportation to work:
- Drove a car alone: 1,655 (64.2%)
- Carpooled: 160 (6.2%)
- Bus: 1 (0.0%)
- Taxicab, motorcycle, or other means: 39 (1.5%)
- Walked: 72 (2.8%)
- Worked at home: 733 (28.5%)
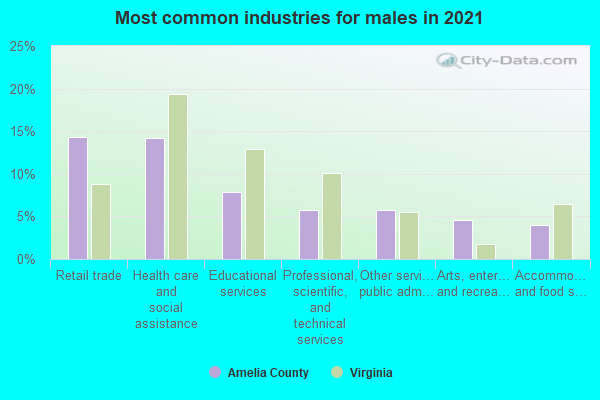
- Health care and social assistance (17%)
- Retail trade (10%)
- Educational services (8%)
- Professional, scientific, and technical services (8%)
- Finance and insurance (7%)
- Other services, except public administration (6%)
- Arts, entertainment, and recreation (4%)
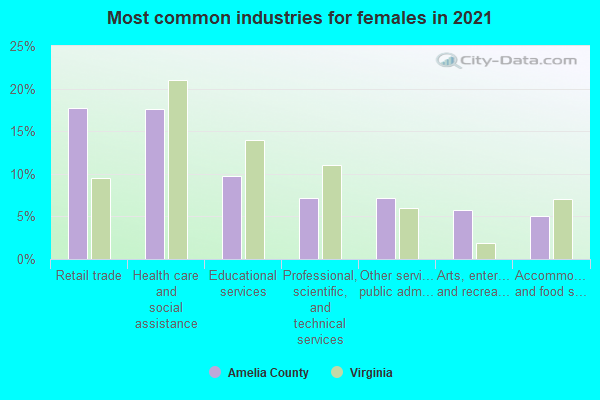
- Health care and social assistance (20%)
- Retail trade (13%)
- Educational services (10%)
- Professional, scientific, and technical services (10%)
- Finance and insurance (8%)
- Other services, except public administration (8%)
- Arts, entertainment, and recreation (5%)
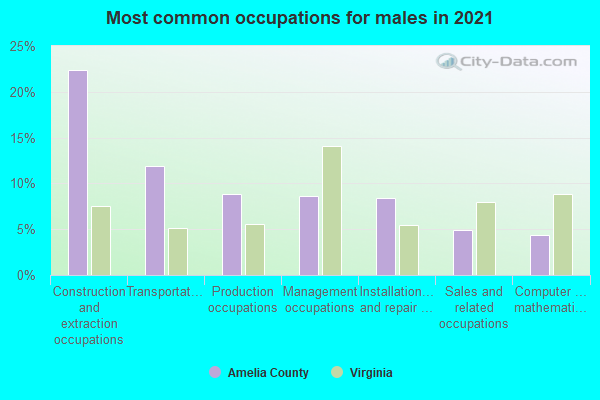
- Construction and extraction occupations (23%)
- Transportation occupations (14%)
- Management occupations (11%)
- Installation, maintenance, and repair occupations (10%)
- Sales and related occupations (8%)
- Production occupations (6%)
- Computer and mathematical occupations (5%)
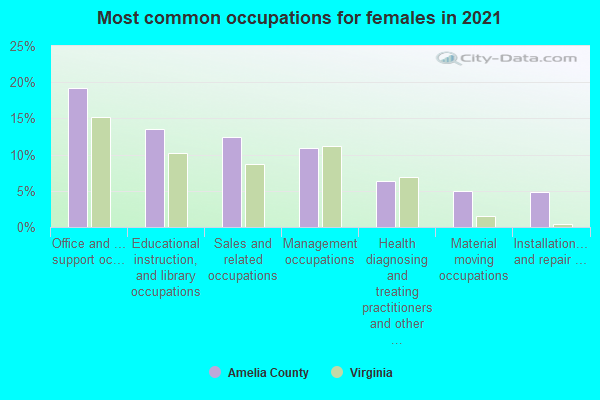
- Office and administrative support occupations (18%)
- Management occupations (13%)
- Educational instruction, and library occupations (13%)
- Sales and related occupations (8%)
- Health diagnosing and treating practitioners and other technical occupations (7%)
- Personal care and service occupations (6%)
- Material moving occupations (5%)
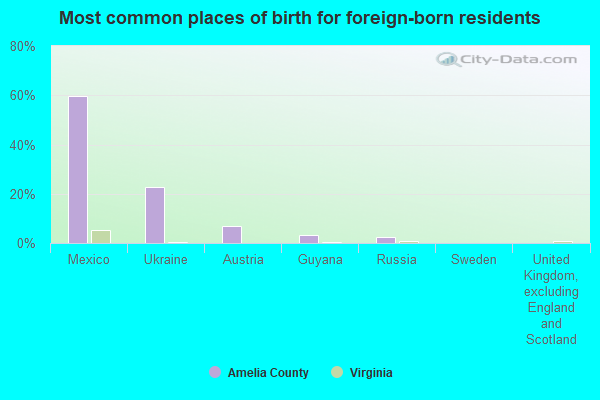
- Mexico (51%)
- Colombia (27%)
- Guyana (19%)
- Russia (1%)
- Sweden (0%)
- United Kingdom, excluding England and Scotland (0%)
- England (0%)
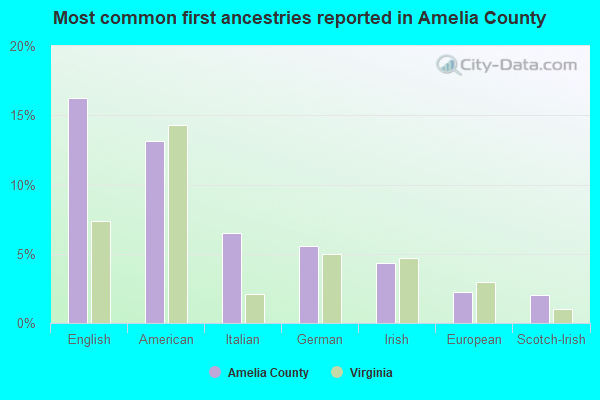
- English (20%)
- American (16%)
- German (6%)
- Italian (4%)
- Irish (3%)
- Scottish (2%)
- Scotch-Irish (2%)
People in group quarters in Amelia County, Virginia in 2010:
- 99 people in nursing facilities/skilled-nursing facilities
- 27 people in group homes intended for adults
- 2 people in workers' group living quarters and job corps centers
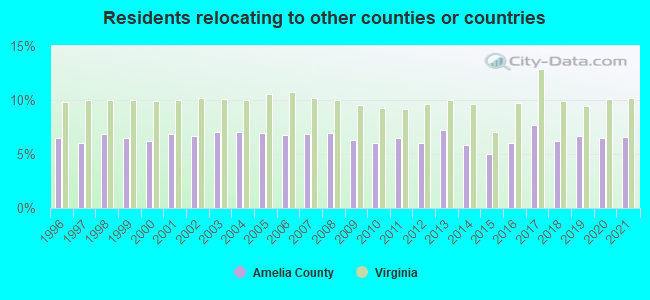
7.89% of this county's 2021 resident taxpayers lived in other counties in 2020 ($52,367 average adjusted gross income)
| Here: | 7.89% |
| Virginia average: | 10.16% |
10 or fewer of this county's residents moved from foreign countries.
7.24% relocated from other counties in Virginia ($48,439 average AGI)
0.65% relocated from other states ($3,927 average AGI)
Amelia County: 0.65% Virginia average: 3.91%

Top counties from which taxpayers relocated into this county between 2020 and 2021:
| from Chesterfield County, VA | |
| from Powhatan County, VA | |
| from Richmond city, VA |
6.56% of this county's 2020 resident taxpayers moved to other counties in 2021 ($51,997 average adjusted gross income)
| Here: | 6.56% |
| Virginia average: | 10.20% |
10 or fewer of this county's residents moved to foreign countries.
5.79% relocated to other counties in Virginia ($43,121 average AGI)
0.78% relocated to other states ($8,876 average AGI)
Amelia County: 0.78% Virginia average: 3.98%
Top counties to which taxpayers relocated from this county between 2020 and 2021:
| to Chesterfield County, VA | |
| to Nottoway County, VA | |
| to Powhatan County, VA | |
| to Prince Edward County, VA |
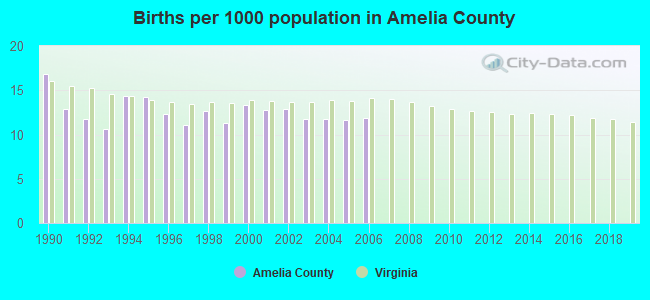
Births per 1000 population from 1990 to 1999: 12.8
Births per 1000 population from 2000 to 2006: 12.3
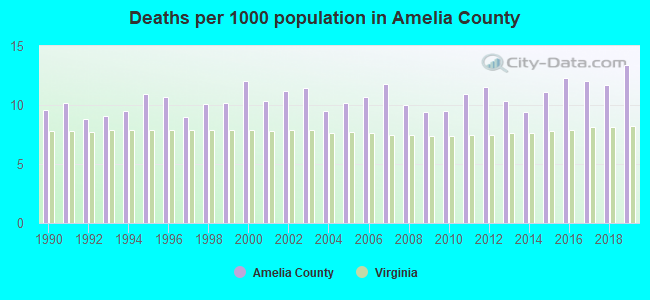
Deaths per 1000 population from 1990 to 1999: 9.8
Deaths per 1000 population from 2000 to 2009: 10.7
Deaths per 1000 population from 2010 to 2020: 11.5
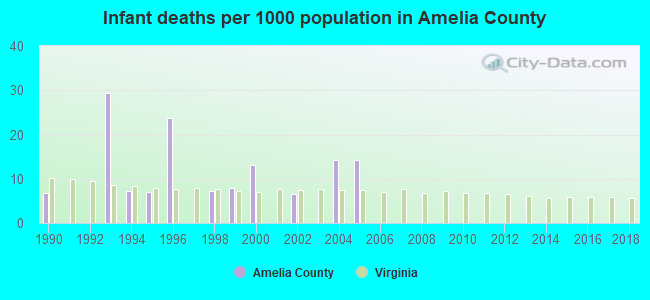
Infant deaths per 1000 live births from 1990 to 1999: 8.9
Infant deaths per 1000 live births from 2000 to 2006: 6.9
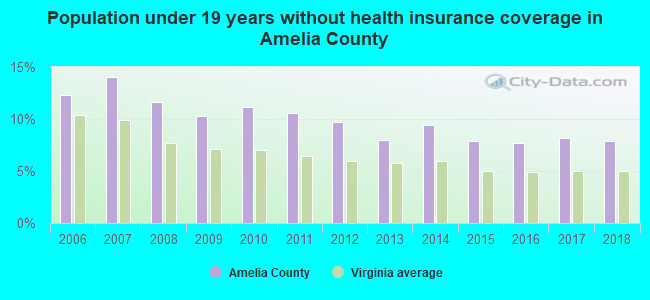
Persons under 19 years old without health insurance coverage in 2018: 7.9%
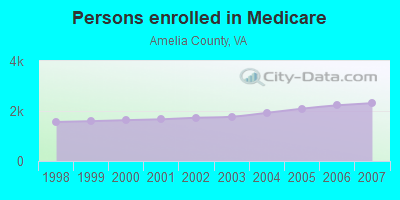
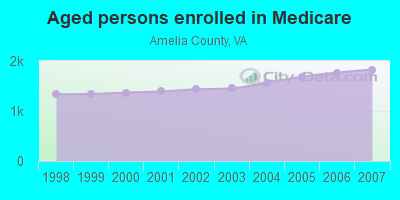
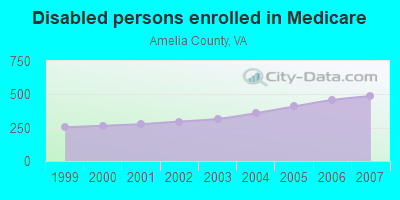
Persons enrolled in hospital insurance and/or supplemental medical insurance (Medicare) in July 1, 2007: 2,315 (1,828 aged, 487 disabled)
Children under 18 without health insurance coverage in 2007: 388 (13%)
Most common underlying causes of death in Amelia County, Virginia in 1999 - 2019:
- Bronchus or lung, unspecified - Malignant neoplasms (178)
- Atherosclerotic heart disease (56)
- Chronic obstructive pulmonary disease, unspecified (54)
- Acute myocardial infarction, unspecified (32)
- Atherosclerotic cardiovascular disease, so described (11)
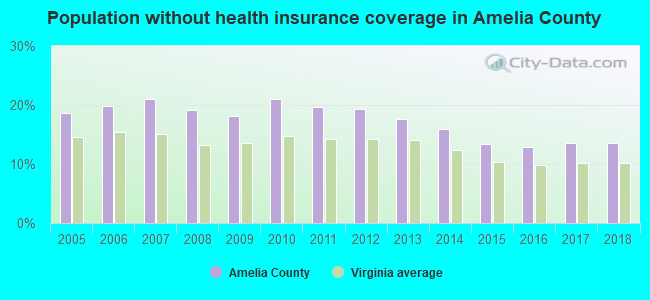
Population without health insurance coverage in 2000: 11%
Children under 18 without health insurance coverage in 2000: 7%
Medical specialist MDs per 100,000 population in 2005: 1,198
Dentists per 100,000 population in 1998: 8
Total births per 100,000 population, July 2005 - July 2006 : 19
Total deaths per 100,000 population, July 2005 - July 2006: 24
Limited-service eating places per 100,000 population in 2005 : 8
Crimes per 100,000 population in 1996: 1
Household type by relationship:
Households: 13,400- Male householders: 2,497 (638 living alone), Female householders: 2,908 (729 living alone)
3,268 spouses (3,268 opposite-sex spouses), 161 unmarried partners, (161 opposite-sex unmarried partners), 3,235 children (3,099 natural, 9 adopted, 133 stepchildren), 668 grandchildren, 37 brothers or sisters, 196 parents, 0 foster children, 150 other relatives, 128 non-relatives
- In group quarters: 133
Size of family households: 1,890 2-persons, 735 3-persons, 626 4-persons, 240 5-persons, 121 6-persons, 195 7-or-more-persons.
Size of nonfamily households: 1,368 1-person, 190 2-persons, 44 3-persons.
1,945 married couples with children.
177 single-parent households (73 men, 104 women).
96.4% of residents of Amelia speak English at home.
3.2% of residents speak Spanish at home (53% speak English very well, 21% speak English well, 26% speak English not well).
0.2% of residents speak other Indo-European language at home (100% speak English very well).
In fiscal year 2004:
Federal Government expenditure: $52,488,000 ($4,400 per capita)
Department of Defense expenditure: $2,424,000
Federal direct payments to individuals for retirement and disability: $30,768,000
Federal other direct payments to individuals: $8,336,000
Federal direct payments not to individuals: $1,124,000
Federal grants: $10,144,000
Federal procurement contracts: $457,000 ($0,000 Department of Defense)
Federal salaries and wages: $1,659,000 ($0,000 Department of Defense)
Federal Government direct loans: $702,000
Federal guaranteed/insured loans: $10,315,000
Federal Government insurance: $4,449,000
Population change from April 1, 2000 to July 1, 2005:
Births: 779| Here: | 63 per 1000 residents |
| State: | 70 per 1000 residents |
Deaths: 674
| Here: | 55 per 1000 residents |
| State: | 40 per 1000 residents |
Net international migration: 0
| Here: | 0 per 1000 residents |
| State: | +18 per 1000 residents |
Net internal migration: +799
| Here: | +65 per 1000 residents |
| State: | +14 per 1000 residents |
Total withdrawal of fresh water for public supply: 0.00 millions of gallons per day (all from surface)
| Here: | 6.4 |
| State: | 7.0 |
| Here: | 5.5 |
| State: | 4.3 |
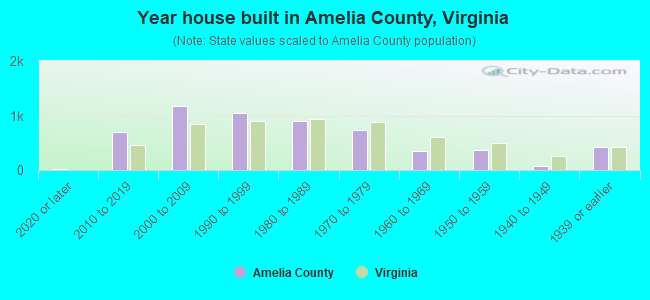
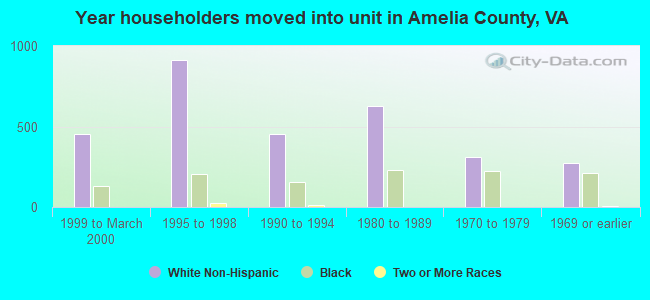
- Year house built in Amelia County, Virginia
- 482020 or later
- 6762010 to 2019
- 1,3992000 to 2009
- 9781990 to 1999
- 8851980 to 1989
- 5261970 to 1979
- 4021960 to 1969
- 3401950 to 1959
- 531940 to 1949
- 5111939 or earlier
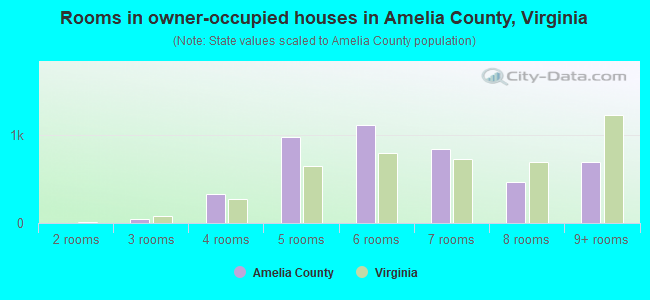
- Rooms in owner-occupied houses in Amelia County, Virginia
- 01 room
- 02 rooms
- 323 rooms
- 4324 rooms
- 7275 rooms
- 1,1896 rooms
- 1,0587 rooms
- 4228 rooms
- 7369+ rooms
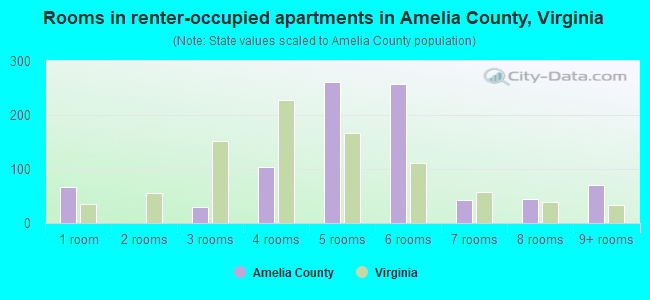
- Rooms in renter-occupied apartments in Amelia County, Virginia
- 711 room
- 02 rooms
- 03 rooms
- 104 rooms
- 3005 rooms
- 2376 rooms
- 327 rooms
- 568 rooms
- 1119+ rooms
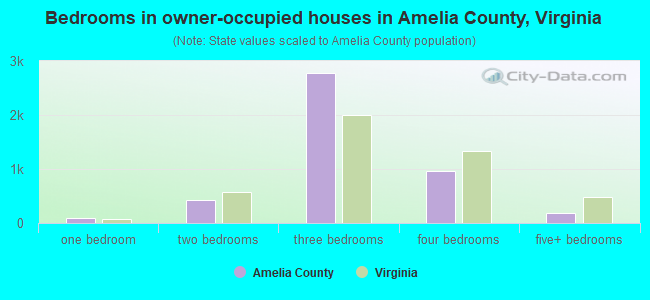
- Bedrooms in owner-occupied houses in Amelia County, Virginia
- 0no bedroom
- 891 bedroom
- 5082 bedrooms
- 2,8863 bedrooms
- 9314 bedrooms
- 1765+ bedrooms
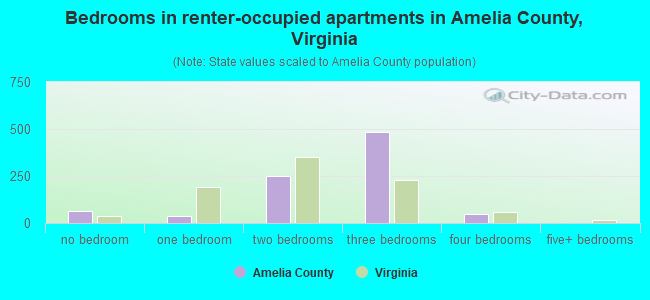
- Bedrooms in renter-occupied apartments in Amelia County, Virginia
- 72no bedroom
- 01 bedroom
- 1032 bedrooms
- 5763 bedrooms
- 754 bedrooms
- 05+ bedrooms
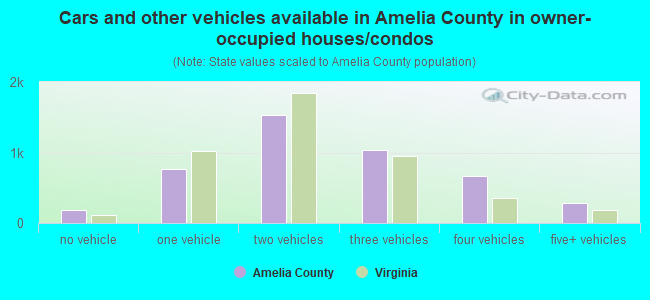
- Cars and other vehicles available in Amelia County in owner-occupied houses/condos
- 135no vehicle
- 9011 vehicle
- 1,5402 vehicles
- 1,0703 vehicles
- 6724 vehicles
- 2545+ vehicles
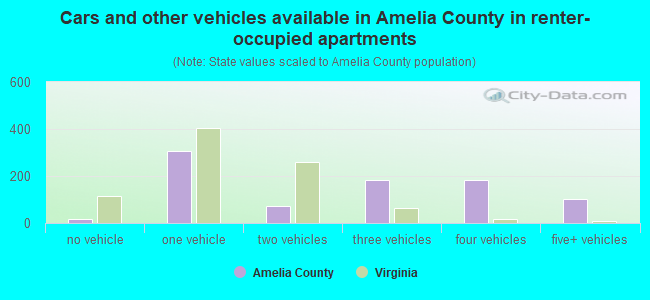
- Cars and other vehicles available in Amelia County in renter-occupied apartments
- 12no vehicle
- 1151 vehicle
- 1382 vehicles
- 1963 vehicles
- 2384 vehicles
- 1185+ vehicles
89.4% of Amelia County residents lived in the same house 1 years ago.
Out of people who lived in different houses, 7% lived in this county.
Out of people who lived in different counties, 99% lived in Virginia.
| Amelia County: | 89.4% |
| State average: | 86.6% |
Place of birth for U.S.-born residents:
- This state: 10,102
- Other state: 3,014
- Northeast: 1,063
- Midwest: 540
- South: 1,143
- West: 261
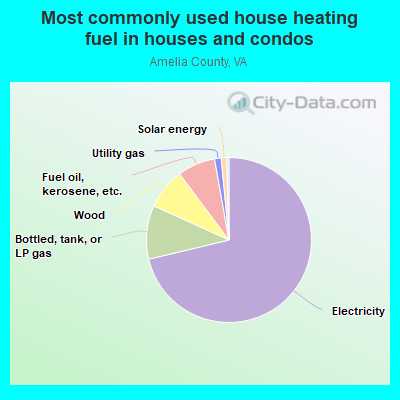
- 72.8%Electricity
- 7.8%Fuel oil, kerosene, etc.
- 7.5%Bottled, tank, or LP gas
- 7.4%Wood
- 2.7%Utility gas
- 1.3%Solar energy
- 0.5%No fuel used
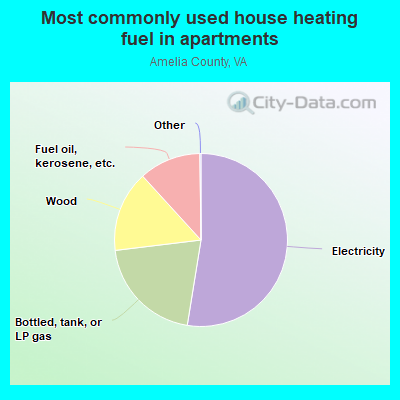
- 50.1%Electricity
- 22.7%Bottled, tank, or LP gas
- 14.1%Fuel oil, kerosene, etc.
- 13.0%Wood
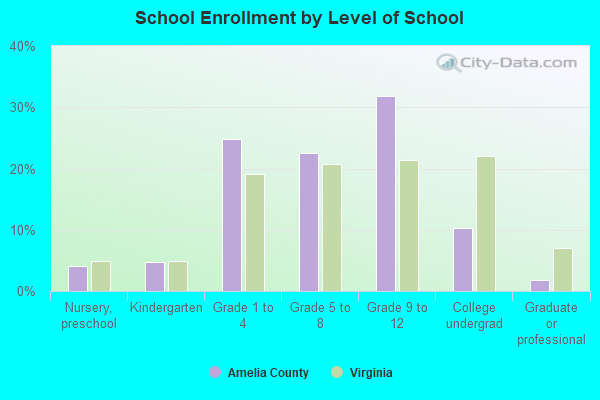
Private vs. public school enrollment:
| Here: | 21.8% |
| Virginia: | 13.2% |
| Here: | 9.5% |
| Virginia: | 10.2% |
| Here: | 14.4% |
| Virginia: | 18.7% |

Amelia County government finances - Expenditure in 2017:
- Charges - Solid Waste Management: $3,560,000
Elementary and Secondary Education School Lunch: $266,000
Other: $158,000
Elementary and Secondary Education - Other: $113,000
Parks and Recreation: $102,000
Elementary and Secondary Education School Tuition and Transportation: $53,000
- Construction - General Public Buildings: $294,000
Regular Highways: $221,000
Central Staff Services: $61,000
Water Utilities: $60,000
General - Other: $47,000
Elementary and Secondary Education: $23,000
Local Fire Protection: $3,000
Sewerage: $1,000
Parks and Recreation: $1,000
- Current Operations - Elementary and Secondary Education: $17,925,000
Police Protection: $2,062,000
Public Welfare - Other: $1,273,000
Judicial and Legal Services: $913,000
Local Fire Protection: $839,000
Financial Administration: $819,000
Central Staff Services: $784,000
General Public Buildings: $746,000
Sewerage: $559,000
Health - Other: $474,000
Public Welfare, Vendor Payments for Medical Care: $391,000
Libraries: $321,000
Correctional Institutions: $320,000
Parks and Recreation: $280,000
Solid Waste Management: $252,000
Natural Resources - Other: $95,000
Protective Inspection and Regulation - Other: $86,000
General - Other: $6,000
Public Welfare Institutions: $4,000
- Federal Intergovernmental - Public Welfare: $700,000
Other: $149,000
- Intergovernmental to Local - Other - Elementary and Secondary Education: $292,000
- Local Intergovernmental - Education: $441,000
- Long Term Debt - Beginning Outstanding - Unspecified Public Purpose: $6,031,000
Outstanding Unspecified Public Purpose: $5,528,000
Retired Unspecified Public Purpose: $503,000
- Miscellaneous - General Revenue - Other: $327,000
Fines and Forfeits: $152,000
Interest Earnings: $77,000
Rents: $19,000
Donations From Private Sources: $9,000
- Other Capital Outlay - Elementary and Secondary Education: $566,000
- Other Funds - Cash and Securities: $11,903,000
- Revenue - Water Utilities: $380,000
- State Intergovernmental - Education: $12,427,000
Other: $1,650,000
General Local Government Support: $1,391,000
Public Welfare: $343,000
Health and Hospitals: $205,000
- Tax - Property: $8,222,000
General Sales and Gross Receipts: $765,000
Motor Vehicle License: $364,000
Public Utilities Sales: $264,000
Occupation and Business License - Other: $226,000
Other License: $180,000
- Total Salaries and Wages: $10,544,000
- Water Utilities - Interest on Debt: $241,000
Amelia County government finances - Revenue in 2017:
- Charges - Solid Waste Management: $3,560,000
Elementary and Secondary Education School Lunch: $266,000
Other: $158,000
Elementary and Secondary Education - Other: $113,000
Parks and Recreation: $102,000
Elementary and Secondary Education School Tuition and Transportation: $53,000
- Construction - General Public Buildings: $294,000
Regular Highways: $221,000
Central Staff Services: $61,000
Water Utilities: $60,000
General - Other: $47,000
Elementary and Secondary Education: $23,000
Local Fire Protection: $3,000
Sewerage: $1,000
Parks and Recreation: $1,000
- Current Operations - Elementary and Secondary Education: $17,925,000
Police Protection: $2,062,000
Public Welfare - Other: $1,273,000
Judicial and Legal Services: $913,000
Local Fire Protection: $839,000
Financial Administration: $819,000
Central Staff Services: $784,000
General Public Buildings: $746,000
Sewerage: $559,000
Health - Other: $474,000
Public Welfare, Vendor Payments for Medical Care: $391,000
Libraries: $321,000
Correctional Institutions: $320,000
Parks and Recreation: $280,000
Solid Waste Management: $252,000
Natural Resources - Other: $95,000
Protective Inspection and Regulation - Other: $86,000
General - Other: $6,000
Public Welfare Institutions: $4,000
- Federal Intergovernmental - Public Welfare: $700,000
Other: $149,000
- Intergovernmental to Local - Other - Elementary and Secondary Education: $292,000
- Local Intergovernmental - Education: $441,000
- Long Term Debt - Beginning Outstanding - Unspecified Public Purpose: $6,031,000
Outstanding Unspecified Public Purpose: $5,528,000
Retired Unspecified Public Purpose: $503,000
- Miscellaneous - General Revenue - Other: $327,000
Fines and Forfeits: $152,000
Interest Earnings: $77,000
Rents: $19,000
Donations From Private Sources: $9,000
- Other Capital Outlay - Elementary and Secondary Education: $566,000
- Other Funds - Cash and Securities: $11,903,000
- Revenue - Water Utilities: $380,000
- State Intergovernmental - Education: $12,427,000
Other: $1,650,000
General Local Government Support: $1,391,000
Public Welfare: $343,000
Health and Hospitals: $205,000
- Tax - Property: $8,222,000
General Sales and Gross Receipts: $765,000
Motor Vehicle License: $364,000
Public Utilities Sales: $264,000
Occupation and Business License - Other: $226,000
Other License: $180,000
- Total Salaries and Wages: $10,544,000
- Water Utilities - Interest on Debt: $241,000
Amelia County government finances - Debt in 2017:
- Charges - Solid Waste Management: $3,560,000
Elementary and Secondary Education School Lunch: $266,000
Other: $158,000
Elementary and Secondary Education - Other: $113,000
Parks and Recreation: $102,000
Elementary and Secondary Education School Tuition and Transportation: $53,000
- Construction - General Public Buildings: $294,000
Regular Highways: $221,000
Central Staff Services: $61,000
Water Utilities: $60,000
General - Other: $47,000
Elementary and Secondary Education: $23,000
Local Fire Protection: $3,000
Sewerage: $1,000
Parks and Recreation: $1,000
- Current Operations - Elementary and Secondary Education: $17,925,000
Police Protection: $2,062,000
Public Welfare - Other: $1,273,000
Judicial and Legal Services: $913,000
Local Fire Protection: $839,000
Financial Administration: $819,000
Central Staff Services: $784,000
General Public Buildings: $746,000
Sewerage: $559,000
Health - Other: $474,000
Public Welfare, Vendor Payments for Medical Care: $391,000
Libraries: $321,000
Correctional Institutions: $320,000
Parks and Recreation: $280,000
Solid Waste Management: $252,000
Natural Resources - Other: $95,000
Protective Inspection and Regulation - Other: $86,000
General - Other: $6,000
Public Welfare Institutions: $4,000
- Federal Intergovernmental - Public Welfare: $700,000
Other: $149,000
- Intergovernmental to Local - Other - Elementary and Secondary Education: $292,000
- Local Intergovernmental - Education: $441,000
- Long Term Debt - Beginning Outstanding - Unspecified Public Purpose: $6,031,000
Outstanding Unspecified Public Purpose: $5,528,000
Retired Unspecified Public Purpose: $503,000
- Miscellaneous - General Revenue - Other: $327,000
Fines and Forfeits: $152,000
Interest Earnings: $77,000
Rents: $19,000
Donations From Private Sources: $9,000
- Other Capital Outlay - Elementary and Secondary Education: $566,000
- Other Funds - Cash and Securities: $11,903,000
- Revenue - Water Utilities: $380,000
- State Intergovernmental - Education: $12,427,000
Other: $1,650,000
General Local Government Support: $1,391,000
Public Welfare: $343,000
Health and Hospitals: $205,000
- Tax - Property: $8,222,000
General Sales and Gross Receipts: $765,000
Motor Vehicle License: $364,000
Public Utilities Sales: $264,000
Occupation and Business License - Other: $226,000
Other License: $180,000
- Total Salaries and Wages: $10,544,000
- Water Utilities - Interest on Debt: $241,000
Amelia County government finances - Cash and Securities in 2017:
- Charges - Solid Waste Management: $3,560,000
Elementary and Secondary Education School Lunch: $266,000
Other: $158,000
Elementary and Secondary Education - Other: $113,000
Parks and Recreation: $102,000
Elementary and Secondary Education School Tuition and Transportation: $53,000
- Construction - General Public Buildings: $294,000
Regular Highways: $221,000
Central Staff Services: $61,000
Water Utilities: $60,000
General - Other: $47,000
Elementary and Secondary Education: $23,000
Local Fire Protection: $3,000
Sewerage: $1,000
Parks and Recreation: $1,000
- Current Operations - Elementary and Secondary Education: $17,925,000
Police Protection: $2,062,000
Public Welfare - Other: $1,273,000
Judicial and Legal Services: $913,000
Local Fire Protection: $839,000
Financial Administration: $819,000
Central Staff Services: $784,000
General Public Buildings: $746,000
Sewerage: $559,000
Health - Other: $474,000
Public Welfare, Vendor Payments for Medical Care: $391,000
Libraries: $321,000
Correctional Institutions: $320,000
Parks and Recreation: $280,000
Solid Waste Management: $252,000
Natural Resources - Other: $95,000
Protective Inspection and Regulation - Other: $86,000
General - Other: $6,000
Public Welfare Institutions: $4,000
- Federal Intergovernmental - Public Welfare: $700,000
Other: $149,000
- Intergovernmental to Local - Other - Elementary and Secondary Education: $292,000
- Local Intergovernmental - Education: $441,000
- Long Term Debt - Beginning Outstanding - Unspecified Public Purpose: $6,031,000
Outstanding Unspecified Public Purpose: $5,528,000
Retired Unspecified Public Purpose: $503,000
- Miscellaneous - General Revenue - Other: $327,000
Fines and Forfeits: $152,000
Interest Earnings: $77,000
Rents: $19,000
Donations From Private Sources: $9,000
- Other Capital Outlay - Elementary and Secondary Education: $566,000
- Other Funds - Cash and Securities: $11,903,000
- Revenue - Water Utilities: $380,000
- State Intergovernmental - Education: $12,427,000
Other: $1,650,000
General Local Government Support: $1,391,000
Public Welfare: $343,000
Health and Hospitals: $205,000
- Tax - Property: $8,222,000
General Sales and Gross Receipts: $765,000
Motor Vehicle License: $364,000
Public Utilities Sales: $264,000
Occupation and Business License - Other: $226,000
Other License: $180,000
- Total Salaries and Wages: $10,544,000
- Water Utilities - Interest on Debt: $241,000
Supplemental Security Income (SSI) in 2006:
- Total number of recipients: 343
- Number of aged recipients: 67
- Number of blind and disabled recipients: 276
- Number of recipients under 18: 48
- Number of recipients between 18 and 64: 204
- Number of recipients older than 64: 91
- Number of recipients also receiving OASDI: 146
- Amount of payments (thousands of dollars): 143
| Businesses in Amelia County, VA | ||||
| Name | Count | Name | Count | |
|---|---|---|---|---|
| Circle K | 1 | Rite Aid | 2 | |
| Econo Lodge | 1 | Subway | 1 | |
| H&R Block | 1 | U-Haul | 1 | |
| McDonald's | 1 | UPS | 1 | |