Merced County, California (CA)
County owner-occupied free and clear houses and condos in 2010: 10,326
County owner-occupied houses and condos in 2000: 37,475
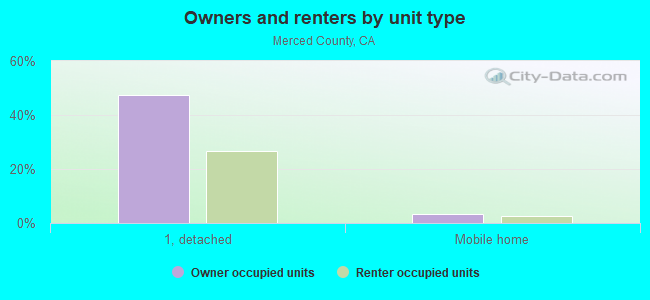
Renter-occupied apartments: 34,446 (it was 26,340 in 2000)
| % of renters here: | 41% |
| State: | 44% |
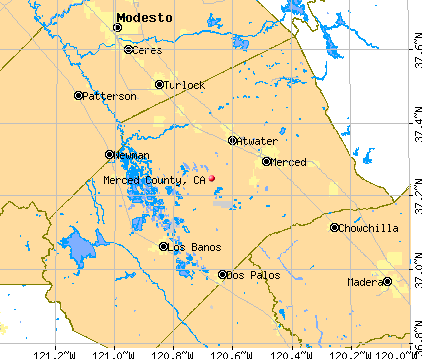
Land area: 1929 sq. mi.
Water area: 43.2 sq. mi.
Population density: 150 people per square mile (average).
Industries providing employment: Educational, health and social services (21.5%), Agriculture,forestry,fishing and hunting, and mining (11.1%), Retail trade (10.7%), Manufacturing (10.6%).
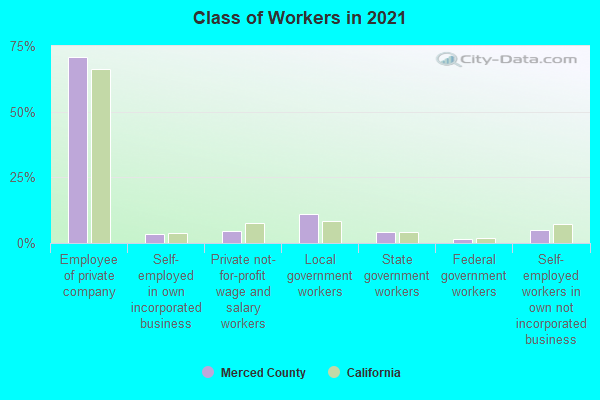
Type of workers:
- Private wage or salary: 77%
- Government: 17%
- Self-employed, not incorporated: 6%
- Unpaid family work: 0%
- OSM Map
- General Map
- Google Map
- MSN Map

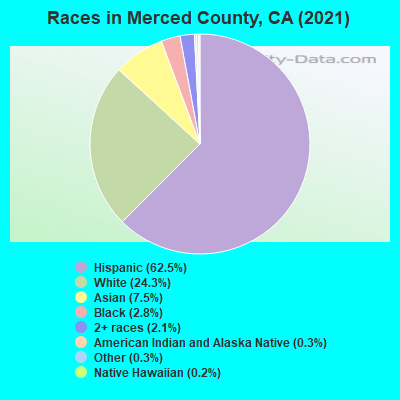
- 183,28663.2%Hispanic or Latino
- 68,17223.5%White Non-Hispanic Alone
- 19,6736.8%Asian alone
- 8,3362.9%Two or more races
- 7,8852.7%Black Non-Hispanic Alone
- 1,0370.4%Some other race alone
- 8960.3%Native Hawaiian and Other
Pacific Islander alone - 7290.3%American Indian and Alaska Native alone
| Median resident age: | 31.9 years |
| California median age: | 37.9 years |
| Males: 147,970 | |
| Females: 142,044 |


| Merced County: | 3.0 people |
| California: | 3 people |
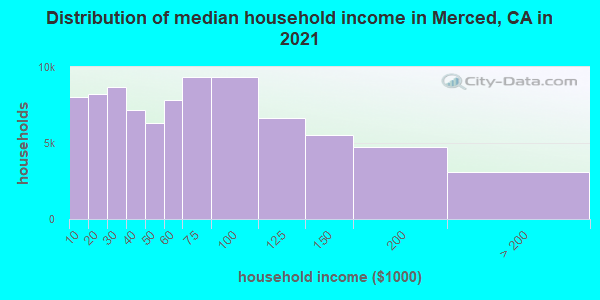
Estimated median household income in 2022: $66,164 ($35,532 in 1999)
| This county: | $66,164 |
| California: | $91,551 |
Median contract rent in 2022 for apartments: $989 (lower quartile is $745, upper quartile is $1,246)
| This county: | $989 |
| State: | $1719 |
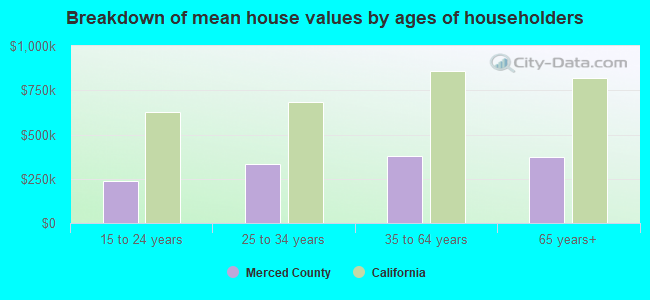
Estimated median house or condo value in 2022: $388,300 (it was $110,900 in 2000)
| Merced: | $388,300 |
| California: | $715,900 |
Mean price in 2022:
Median monthly housing costs for homes and condos with a mortgage: $1,769Detached houses: $450,200
Here: $450,200 State: $988,808 Townhouses or other attached units: $402,896
Here: $402,896 State: $838,546 In 2-unit structures: $421,570
Here: $421,570 State: $1,138,100 In 3-to-4-unit structures: $246,549
Here: $246,549 State: $824,253 In 5-or-more-unit structures: $591,155
Here: $591,155 State: $730,996 Mobile homes: $153,905
Here: $153,905 State: $184,506 Occupied boats, RVs, vans, etc.: $63,008
Here: $63,008 State: $204,957
Median monthly housing costs for units without a mortgage: $571
Institutionalized population: 2,728
Crime in 2020 (reported by the sheriff's office or county police, not the county total):
- Murders: 3
- Rapes: 19
- Robberies: 30
- Assaults: 415
- Burglaries: 360
- Thefts: 797
- Auto thefts: 200
Crime in 2019 (reported by the sheriff's office or county police, not the county total):
- Murders: 4
- Rapes: 19
- Robberies: 24
- Assaults: 453
- Burglaries: 487
- Thefts: 956
- Auto thefts: 72
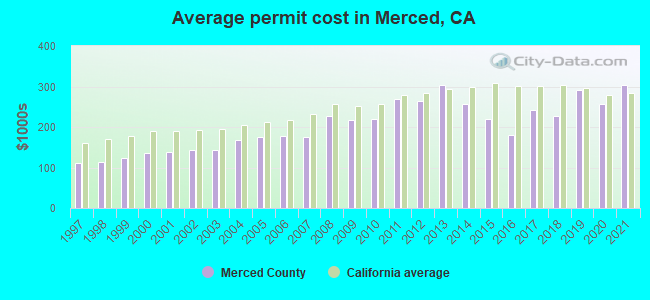
Single-family new house construction building permits:
- 2022: 373 buildings, average cost: $290,000
- 2021: 1017 buildings, average cost: $302,600
- 2020: 998 buildings, average cost: $256,500
- 2019: 948 buildings, average cost: $290,900
- 2018: 630 buildings, average cost: $227,700
- 2017: 546 buildings, average cost: $241,300
- 2016: 611 buildings, average cost: $180,000
- 2015: 228 buildings, average cost: $219,800
- 2014: 163 buildings, average cost: $257,900
- 2013: 99 buildings, average cost: $303,100
- 2012: 71 buildings, average cost: $263,500
- 2011: 87 buildings, average cost: $268,800
- 2010: 104 buildings, average cost: $219,000
- 2009: 94 buildings, average cost: $217,900
- 2008: 244 buildings, average cost: $227,000
- 2007: 780 buildings, average cost: $175,500
- 2006: 2136 buildings, average cost: $178,100
- 2005: 3479 buildings, average cost: $176,300
- 2004: 2544 buildings, average cost: $166,800
- 2003: 2465 buildings, average cost: $142,200
- 2002: 1674 buildings, average cost: $144,000
- 2001: 1090 buildings, average cost: $139,400
- 2000: 1344 buildings, average cost: $134,600
- 1999: 1001 buildings, average cost: $122,500
- 1998: 979 buildings, average cost: $113,800
- 1997: 897 buildings, average cost: $111,700

Median real estate property taxes paid for housing units with mortgages in 2022: $3,227 (0.8%)
Median real estate property taxes paid for housing units with no mortgage in 2022: $1,548 (0.4%)


| Merced County: | 19.3% |
| California: | 12.2% |
Median age of residents in 2022: 31.9 years old
(Males: 31.3 years old, Females: 32.5 years old)
(Median age for: White residents: 44.5 years old, Black residents: 40.1 years old, American Indian residents: 29.3 years old, Asian residents: 31.5 years old, Hispanic or Latino residents: 27.9 years old, Other race residents: 28.6 years old)
Area name: Merced, CA MSA
Fair market rent in 2006 for a 1-bedroom apartment in Merced County is $523 a month.
Fair market rent for a 2-bedroom apartment is $635 a month.
Fair market rent for a 3-bedroom apartment is $906 a month.
Cities in this county include: Merced, Los Banos, Atwater, Livingston, Winton, Delhi, Hilmar-Irwin, Gustine, Dos Palos, Planada.
| Zip code | City | Number of tests | Number of tests >= 4 pCi/L |
|---|---|---|---|
| 93635 | Los Banos | 17 | 0 |
| 93661 | Santa Rita Park | 1 | 0 |
| 95301 | Atwater | 10 | 0 |
| 95315 | Delhi | 2 | 0 |
| 95317 | El Nido | 1 | 0 |
| 95322 | Gustine | 2 | 0 |
| 95324 | Hilmar | 2 | 0 |
| 95333 | Le Grand | 1 | 0 |
| 95340 | Merced | 35 | 9 |
| 95344 | Merced | 1 | 1 |
| 95348 | Merced | 6 | 1 |
Neighboring counties: Amelia County, Virginia  , Boyle County, Kentucky , Huerfano County, Colorado , Mingo County, West Virginia , Sedgwick County, Kansas , Lynchburg city, Virginia .
| Here: | 10.2% |
| California: | 5.1% |

Current college students: 11,077
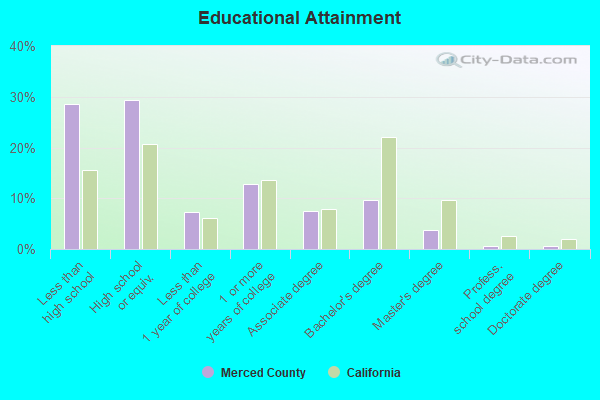
People 25 years of age or older with a high school degree or higher: 74.3%
People 25 years of age or older with a bachelor's degree or higher: 16.2%
Number of foreign born residents: 70,594 (46.4% naturalized citizens)
| Merced County: | 24.3% |
| Whole state: | 26.7% |
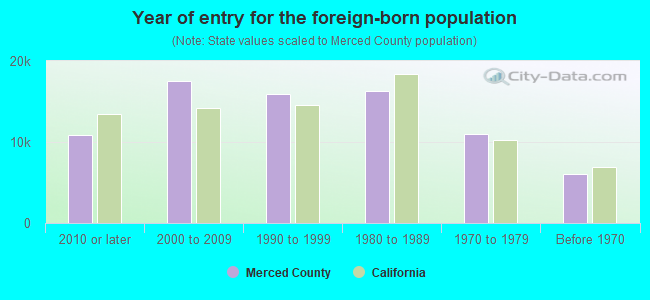
- Year of entry for the foreign-born population
- 12,9482010 or later
- 17,8212000 to 2009
- 15,3161990 to 1999
- 16,2741980 to 1989
- 10,9721970 to 1979
- 6,110Before 1970
Mean travel time to work (commute): minutes
Percentage of county residents living and working in this county: 99.6%
Housing units in structures:
- One, detached: 71,715
- One, attached: 1,402
- Two: 2,501
- 3 or 4: 3,280
- 5 to 9: 3,425
- 10 to 19: 1,678
- 20 to 49: 743
- 50 or more: 1,048
- Mobile homes: 4,399
- Boats, RVs, vans, etc.: 117
Housing units in Merced County with a mortgage: 36,892 (1,522 second mortgage, 25 home equity loan, 777 both second mortgage and home equity loan)
Houses without a mortgage: 222
| Here: | 14.0% with mortgage |
| State: | 98.6% with mortgage |
Religion statistics for Merced County
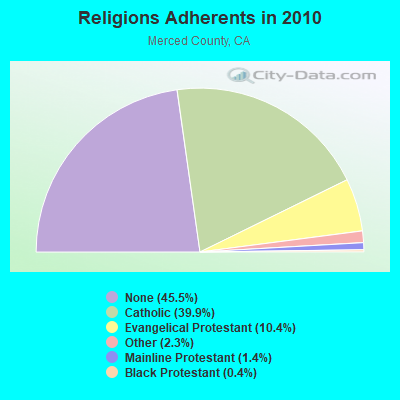
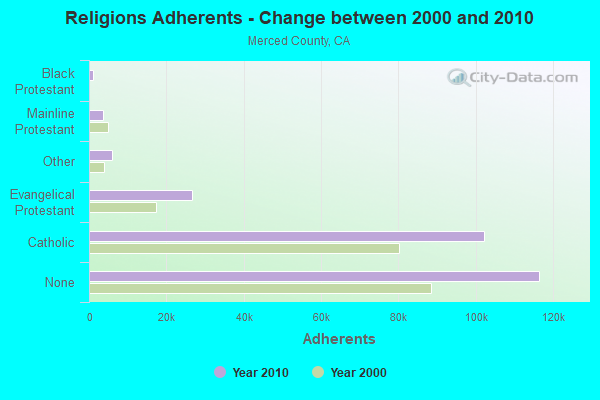
| Religion | Adherents | Congregations |
|---|---|---|
| Catholic | 102,005 | 18 |
| Evangelical Protestant | 26,640 | 124 |
| Other | 5,884 | 23 |
| Mainline Protestant | 3,673 | 18 |
| Black Protestant | 1,087 | 8 |
| Orthodox | 64 | 1 |
| None | 116,440 | - |
Source: Clifford Grammich, Kirk Hadaway, Richard Houseal, Dale E.Jones, Alexei Krindatch, Richie Stanley and Richard H.Taylor. 2012. 2010 U.S.Religion Census: Religious Congregations & Membership Study. Association of Statisticians of American Religious Bodies. Jones, Dale E., et al. 2002. Congregations and Membership in the United States 2000. Nashville, TN: Glenmary Research Center.
Food Environment Statistics:
| Merced County: | 2.37 / 10,000 pop. |
| State: | 2.14 / 10,000 pop. |
| Here: | 0.04 / 10,000 pop. |
| California: | 0.04 / 10,000 pop. |
| This county: | 1.06 / 10,000 pop. |
| California: | 0.62 / 10,000 pop. |
| Merced County: | 2.17 / 10,000 pop. |
| California: | 1.49 / 10,000 pop. |
| This county: | 4.09 / 10,000 pop. |
| State: | 7.42 / 10,000 pop. |
| Merced County: | 6.9% |
| California: | 7.3% |
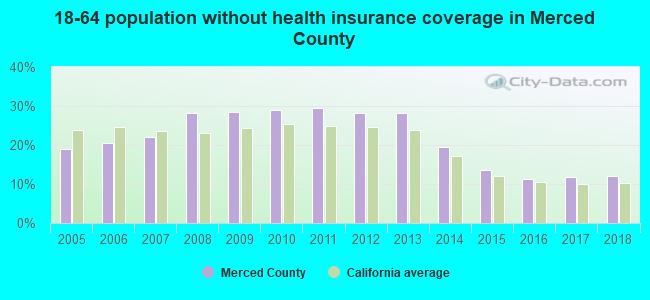
| Merced County: | 29.5% |
| State: | 21.3% |
| Here: | 17.8% |
| State: | 17.9% |
Agriculture in Merced County:
Average size of farms: 339 acresAverage value of agricultural products sold per farm: $475,457
Average value of crops sold per acre for harvested cropland: $1247.14
The value of nursery, greenhouse, floriculture, and sod as a percentage of the total market value of agricultural products sold: 1.10%
The value of livestock, poultry, and their products as a percentage of the total market value of agricultural products sold: 57.60%
Average total farm production expenses per farm: $419,663
Harvested cropland as a percentage of land in farms: 47.62%
Irrigated harvested cropland as a percentage of land in farms: 96.28%
Average market value of all machinery and equipment per farm: $114,594
The percentage of farms operated by a family or individual: 79.18%
Average age of principal farm operators: 55 years
Average number of cattle and calves per 100 acres of all land in farms: 46.23
Milk cows as a percentage of all cattle and calves: 48.01%
Corn for grain: 9142 harvested acres
All wheat for grain: 14198 harvested acres
Upland cotton: 56008 harvested acres
Vegetables: 46,499 harvested acres
Land in orchards: 145,106 acres
Earthquake activity:
Merced County-area historical earthquake activity is significantly above California state average. It is 8282% greater than the overall U.S. average.On 4/18/1906 at 13:12:21, a magnitude 7.9 (7.9 UK, Class: Major, Intensity: VIII - XII) earthquake occurred 137.7 miles away from Merced County center, causing $524,000,000 total damage
On 7/21/1952 at 11:52:14, a magnitude 7.7 (7.7 UK) earthquake occurred 181.3 miles away from the county center, causing $50,000,000 total damage
On 10/18/1989 at 00:04:15, a magnitude 7.1 (6.5 MB, 7.1 MS, 6.9 MW, 7.0 ML) earthquake occurred 61.1 miles away from the county center, causing 62 deaths (62 shaking deaths) and 3757 injuries, causing $1,305,032,704 total damage
On 11/4/1927 at 13:51:53, a magnitude 7.5 (7.5 UK) earthquake occurred 162.4 miles away from the county center
On 12/21/1932 at 06:10:09, a magnitude 7.2 (7.2 UK) earthquake occurred 166.2 miles away from Merced County center
On 10/3/1915 at 06:52:48, a magnitude 7.6 (7.6 UK) earthquake occurred 282.6 miles away from the county center
Magnitude types: body-wave magnitude (MB), local magnitude (ML), surface-wave magnitude (MS), moment magnitude (MW)
Most recent natural disasters:
- California Covid-19 Pandemic, Incident Period: January 20, 2020, FEMA Id: 4482, Natural disaster type: Other
- California Severe Winter Storms, Flooding, Mudslides, Incident Period: February 1, 2017 - February 23, 2017, FEMA Id: 4308, Natural disaster type: Winter Storm, Mudslide, Flood
- California Severe Winter Storms, Flooding, And Mudslides, Incident Period: January 3, 2017 - January 12, 2017, FEMA Id: 4301, Natural disaster type: Winter Storm, Mudslide, Flood
- California Severe Storms, Flooding, Landslides, and Mudslides, Incident Period: March 29, 2006 to April 16, 2006, Major Disaster (Presidential) Declared DR-1646: June 05, 2006, FEMA Id: 1646, Natural disaster type: Storm, Mudslide, Landslide, Flood
- California Hurricane Katrina Evacuation, Incident Period: August 29, 2005 to October 01, 2005, Emergency Declared EM-3248: September 13, 2005, FEMA Id: 3248, Natural disaster type: Hurricane
- California Severe Freeze, Incident Period: December 20, 1998 to December 28, 1998, Major Disaster (Presidential) Declared DR-1267: February 09, 1999, FEMA Id: 1267, Natural disaster type: Freeze
- California Severe Winter Storms and Flooding, Incident Period: February 02, 1998 to April 30, 1998, Major Disaster (Presidential) Declared DR-1203: February 09, 1998, FEMA Id: 1203, Natural disaster type: Winter Storm, Flood
- California Severe Storms/Flooding, Incident Period: December 28, 1996 to April 01, 1997, Major Disaster (Presidential) Declared DR-1155: January 04, 1997, FEMA Id: 1155, Natural disaster type: Storm, Flood
- California Severe Winter Storms, Flooding, Landslides, Mud Flows, Incident Period: February 13, 1995 to April 19, 1995, Major Disaster (Presidential) Declared DR-1046: March 12, 1995, FEMA Id: 1046, Natural disaster type: Winter Storm, Landslide, Flood
- California Severe Freeze, Incident Period: December 19, 1990 to January 03, 1991, Major Disaster (Presidential) Declared DR-894: February 11, 1991, FEMA Id: 894, Natural disaster type: Freeze
- 3 other natural disasters have been reported since 1953.
The number of natural disasters in Merced County (13) is near the US average (15).
Major Disasters (Presidential) Declared: 8
Emergencies Declared: 2
Causes of natural disasters: Floods: 8, Storms: 4, Winter Storms: 4, Mudslides: 3, Freezes: 2, Landslides: 2, Drought: 1, Hurricane: 1, Tornado: 1, Other: 1 (Note: some incidents may be assigned to more than one category).
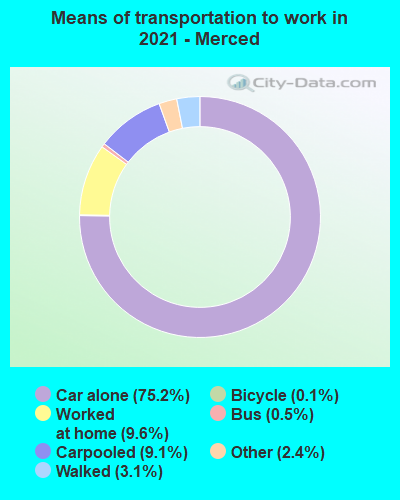
Means of transportation to work:
- Drove a car alone: 66,012 (72.1%)
- Carpooled: 11,450 (12.5%)
- Bus: 199 (0.2%)
- Taxicab, motorcycle, or other means: 3,270 (3.6%)
- Bicycle: 353 (0.4%)
- Walked: 2,502 (2.7%)
- Worked at home: 7,797 (8.5%)
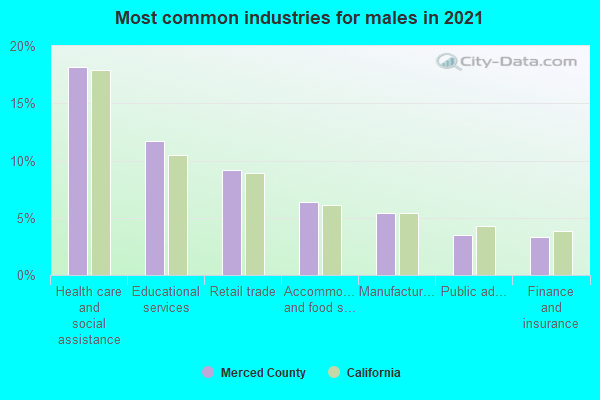
- Health care and social assistance (15%)
- Retail trade (10%)
- Educational services (10%)
- Accommodation and food services (7%)
- Agriculture, forestry, fishing and hunting (6%)
- Manufacturing (4%)
- Other services, except public administration (3%)
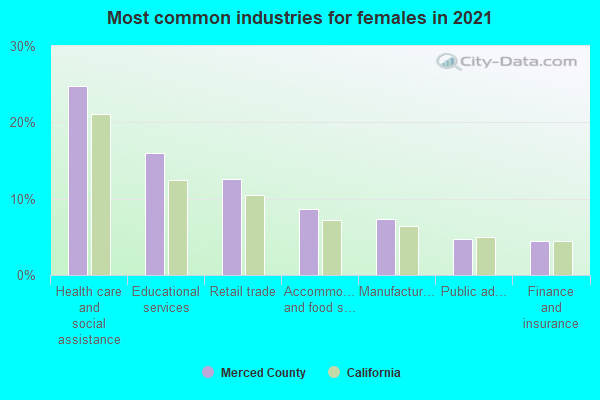
- Health care and social assistance (22%)
- Retail trade (14%)
- Educational services (14%)
- Accommodation and food services (10%)
- Agriculture, forestry, fishing and hunting (9%)
- Manufacturing (5%)
- Other services, except public administration (5%)
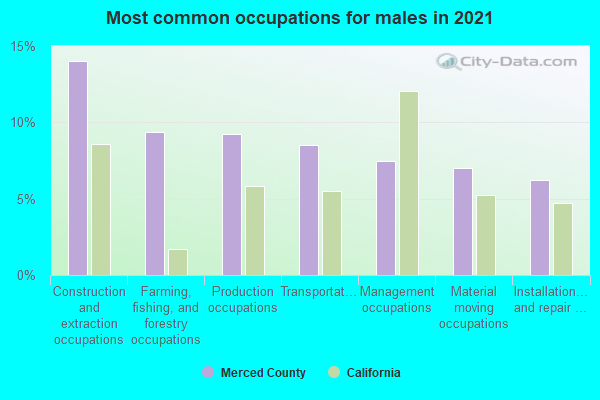
- Production occupations (11%)
- Construction and extraction occupations (10%)
- Management occupations (9%)
- Sales and related occupations (9%)
- Material moving occupations (9%)
- Farming, fishing, and forestry occupations (8%)
- Installation, maintenance, and repair occupations (8%)
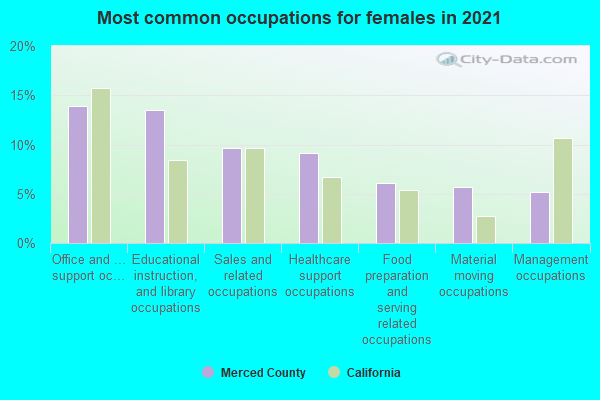
- Office and administrative support occupations (15%)
- Sales and related occupations (11%)
- Educational instruction, and library occupations (10%)
- Management occupations (8%)
- Food preparation and serving related occupations (7%)
- Personal care and service occupations (7%)
- Material moving occupations (6%)
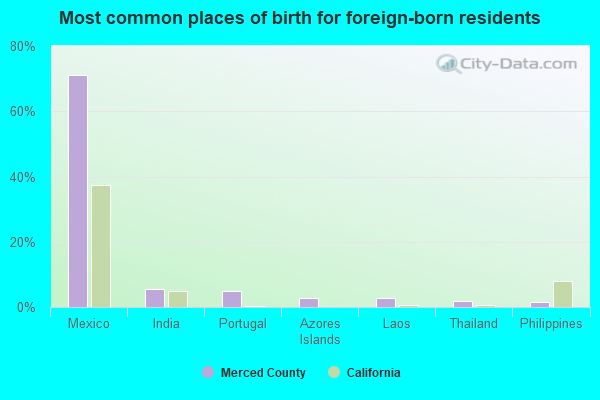
- Mexico (72%)
- India (6%)
- Portugal (4%)
- Azores Islands (2%)
- Laos (2%)
- Thailand (2%)
- Philippines (2%)
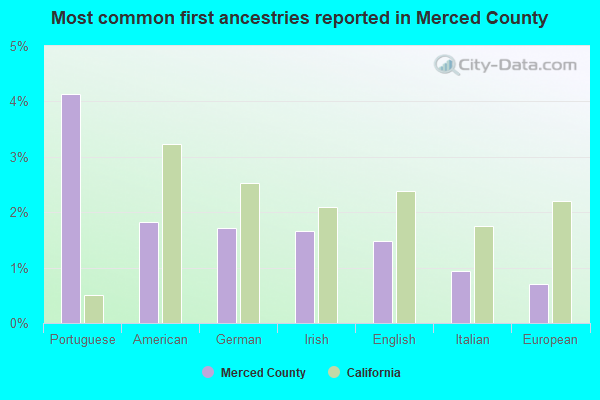
- Portuguese (4%)
- American (2%)
- German (1%)
- Irish (1%)
- English (1%)
- Italian (1%)
- European (1%)
People in group quarters in Merced County, California in 2010:
- 1,286 people in federal prisons
- 1,116 people in college/university student housing
- 661 people in local jails and other municipal confinement facilities
- 512 people in nursing facilities/skilled-nursing facilities
- 404 people in workers' group living quarters and job corps centers
- 334 people in other noninstitutional facilities
- 123 people in group homes intended for adults
- 106 people in correctional facilities intended for juveniles
- 100 people in emergency and transitional shelters (with sleeping facilities) for people experiencing homelessness
- 96 people in mental (psychiatric) hospitals and psychiatric units in other hospitals
- 91 people in residential treatment centers for adults
- 67 people in group homes for juveniles (non-correctional)
People in group quarters in Merced County, California in 2000:
- 819 people in agriculture workers' dormitories on farms
- 603 people in other noninstitutional group quarters
- 539 people in local jails and other confinement facilities (including police lockups)
- 446 people in nursing homes
- 111 people in homes or halfway houses for drug/alcohol abuse
- 92 people in other nonhousehold living situations
- 87 people in homes for the mentally retarded
- 59 people in homes for the mentally ill
- 45 people in short-term care, detention or diagnostic centers for delinquent children
- 31 people in unknown juvenile institutions
- 6 people in schools, hospitals, or wards for the intellectually disabled
- 6 people in homes for the physically handicapped
- 4 people in mental (psychiatric) hospitals or wards
- 4 people in religious group quarters
- 3 people in other group homes
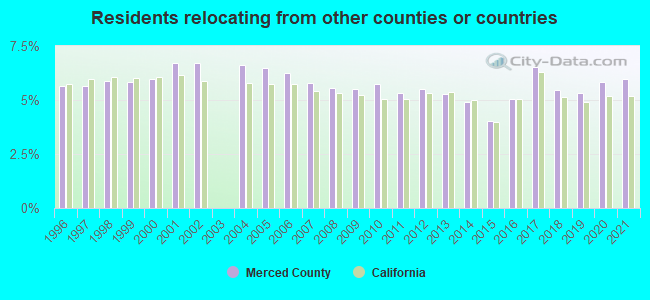
5.99% of this county's 2021 resident taxpayers lived in other counties in 2020 ($49,669 average adjusted gross income)
| Here: | 5.99% |
| California average: | 5.19% |
10 or fewer of this county's residents moved from foreign countries.
5.16% relocated from other counties in California ($44,146 average AGI)
0.83% relocated from other states ($5,524 average AGI)
Merced County: 0.83% California average: 1.56%
Top counties from which taxpayers relocated into this county between 2020 and 2021:
| from Stanislaus County, CA | |
| from Santa Clara County, CA | |
| from San Joaquin County, CA | |
| from Fresno County, CA | |
| from Alameda County, CA | |
| from Monterey County, CA | |
| from Los Angeles County, CA |
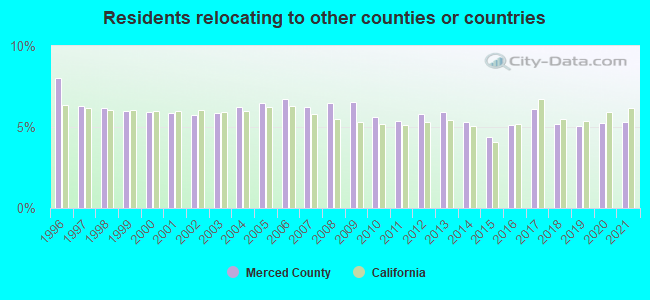
5.33% of this county's 2020 resident taxpayers moved to other counties in 2021 ($50,097 average adjusted gross income)
| Here: | 5.33% |
| California average: | 6.14% |
10 or fewer of this county's residents moved to foreign countries.
3.90% relocated to other counties in California ($36,384 average AGI)
1.43% relocated to other states ($13,714 average AGI)
Merced County: 1.43% California average: 2.55%
Top counties to which taxpayers relocated from this county between 2020 and 2021:
| to Stanislaus County, CA | |
| to Santa Clara County, CA | |
| to Fresno County, CA | |
| to Madera County, CA | |
| to San Joaquin County, CA | |
| to Sacramento County, CA | |
| to Los Angeles County, CA |
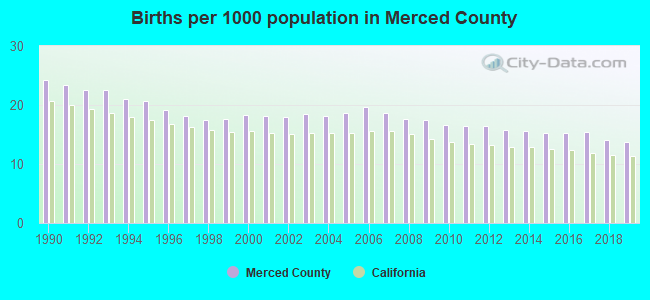
Births per 1000 population from 1990 to 1999: 20.7
Births per 1000 population from 2000 to 2009: 18.3
Births per 1000 population from 2010 to 2022: 12.9
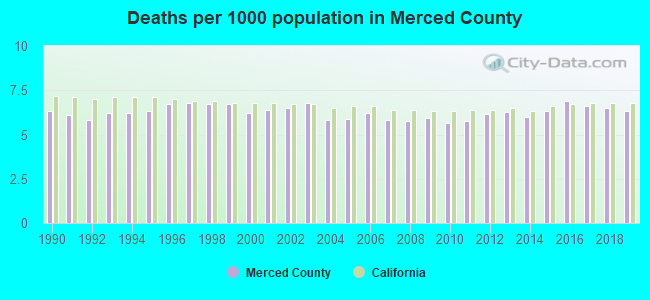
Deaths per 1000 population from 1990 to 1999: 6.4
Deaths per 1000 population from 2000 to 2009: 6.1
Deaths per 1000 population from 2010 to 2020: 6.4
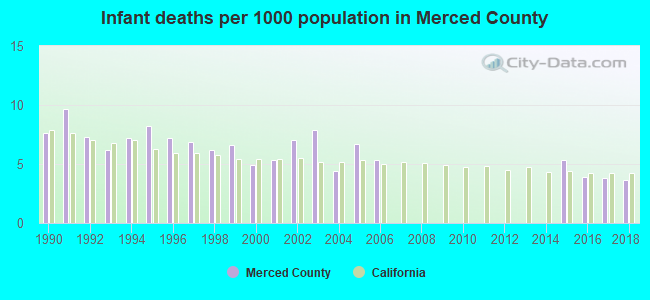
Infant deaths per 1000 live births from 1990 to 1999: 7.3
Infant deaths per 1000 live births from 2000 to 2009: 4.1
Infant deaths per 1000 live births from 2010 to 2021: 2.5
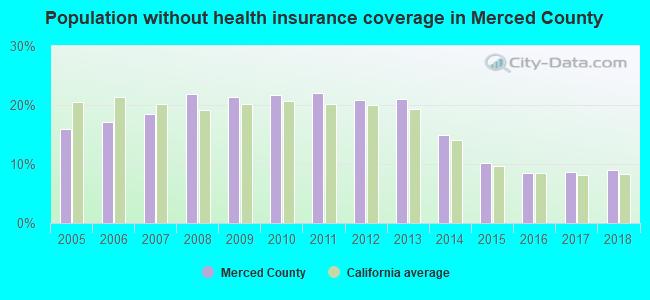
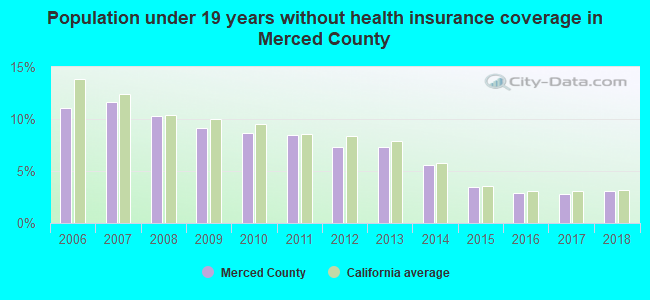
Persons under 19 years old without health insurance coverage in 2018: 3.1%
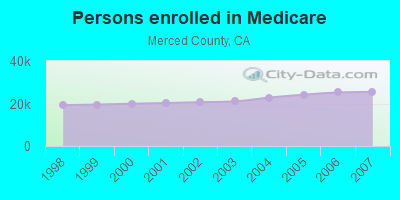
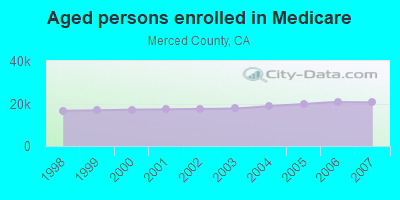
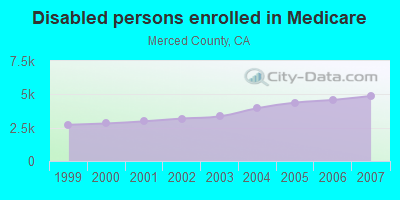
Persons enrolled in hospital insurance and/or supplemental medical insurance (Medicare) in July 1, 2007: 25,441 (20,560 aged, 4,881 disabled)
Children under 18 without health insurance coverage in 2007: 8,438 (11%)
Most common underlying causes of death in Merced County, California in 1999 - 2019:
- Atherosclerotic heart disease (2,500)
- Acute myocardial infarction, unspecified (2,176)
- Bronchus or lung, unspecified - Malignant neoplasms (1,647)
- Chronic obstructive pulmonary disease, unspecified (1,112)
- Stroke, not specified as haemorrhage or infarction (1,033)
- Alzheimer disease, unspecified (867)
- Atherosclerotic cardiovascular disease, so described (613)
- Unspecified dementia (613)
- Pneumonia, unspecified (532)
- Breast, unspecified - Malignant neoplasms (527)
Population without health insurance coverage in 2000: 24%
Children under 18 without health insurance coverage in 2000: 19%
Homicides per 1,000,000 population from 2000 to 2006: 70.3. This is less than state average.
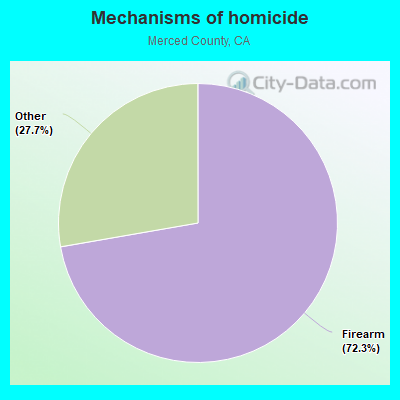
- Firearm - 50.8
- Other - 19.5
Suicides per 1,000,000 population from 2000 to 2006: 74.1. This is less than state average.
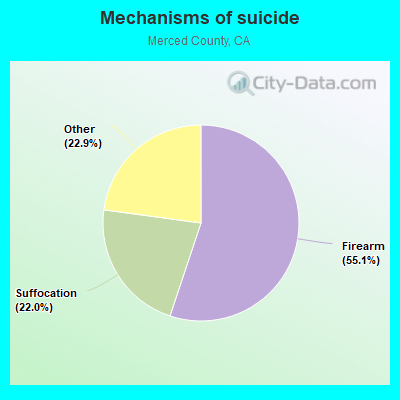
- Firearm - 40.8
- Suffocation - 16.3
- Other - 16.9
Household type by relationship:
Households: 290,014- Male householders: 46,244 (7,084 living alone), Female householders: 41,586 (9,858 living alone)
43,467 spouses (43,189 opposite-sex spouses), 8,313 unmarried partners, (8,018 opposite-sex unmarried partners), 108,720 children (102,245 natural, 1,659 adopted, 4,816 stepchildren), 10,320 grandchildren, 6,027 brothers or sisters, 7,799 parents, 515 foster children, 7,305 other relatives, 5,969 non-relatives
- In group quarters: 3,749
Size of family households: 21,077 2-persons, 14,786 3-persons, 11,569 4-persons, 11,561 5-persons, 4,322 6-persons, 3,695 7-or-more-persons.
Size of nonfamily households: 16,942 1-person, 3,320 2-persons, 486 3-persons, 72 5-persons.
42,505 married couples with children.
27,951 single-parent households (9,895 men, 18,056 women).
47.3% of residents of Merced speak English at home.
44.8% of residents speak Spanish at home (60% speak English very well, 14% speak English well, 11% speak English not well, 15% don't speak English at all).
4.1% of residents speak other Indo-European language at home (76% speak English very well, 12% speak English well, 7% speak English not well, 6% don't speak English at all).
3.7% of residents speak Asian or Pacific Island language at home (62% speak English very well, 20% speak English well, 12% speak English not well, 7% don't speak English at all).
0.1% of residents speak other language at home (100% speak English very well).
In fiscal year 2004:
Federal Government expenditure: $975,328,000 ($4,115 per capita)
Department of Defense expenditure: $56,869,000
Federal direct payments to individuals for retirement and disability: $399,425,000
Federal other direct payments to individuals: $198,446,000
Federal direct payments not to individuals: $26,494,000
Federal grants: $290,902,000
Federal procurement contracts: $16,063,000 ($4,890,000 Department of Defense)
Federal salaries and wages: $43,998,000 ($312,000 Department of Defense)
Federal Government direct loans: $8,528,000
Federal guaranteed/insured loans: $89,317,000
Federal Government insurance: $953,684,000
Population change from April 1, 2000 to July 1, 2005:
Births: 21,415| Here: | 89 per 1000 residents |
| State: | 77 per 1000 residents |
Deaths: 7,728
| Here: | 32 per 1000 residents |
| State: | 34 per 1000 residents |
Net international migration: +7,236
| Here: | +30 per 1000 residents |
| State: | +39 per 1000 residents |
Net internal migration: +10,472
| Here: | |
| State: |
Total withdrawal of fresh water for public supply: 47.58 millions of gallons per day (99% from ground, 1% from surface)
| Here: | 5.9 |
| State: | 6.0 |
| Here: | 4.8 |
| State: | 3.9 |
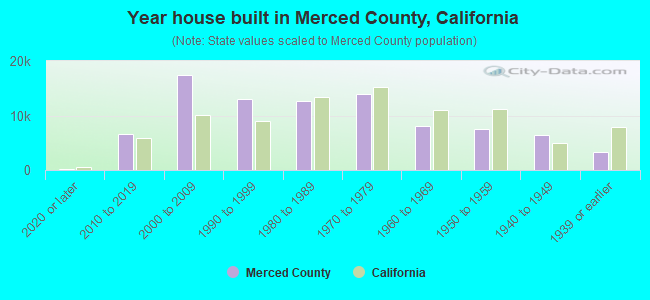
- Year house built in Merced County, California
- 2,6122020 or later
- 7,9282010 to 2019
- 18,5292000 to 2009
- 12,2701990 to 1999
- 11,5961980 to 1989
- 14,0231970 to 1979
- 7,7281960 to 1969
- 7,6801950 to 1959
- 4,0431940 to 1949
- 3,8991939 or earlier

- Rooms in owner-occupied houses in Merced County, California
- 3231 room
- 542 rooms
- 1,4223 rooms
- 3,8784 rooms
- 14,8885 rooms
- 12,1996 rooms
- 8,8497 rooms
- 5,3248 rooms
- 4,4329+ rooms
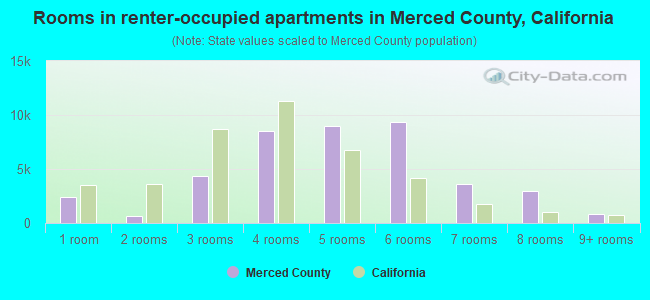
- Rooms in renter-occupied apartments in Merced County, California
- 1,9711 room
- 1,1342 rooms
- 3,3873 rooms
- 9,0834 rooms
- 9,3235 rooms
- 7,1066 rooms
- 1,6667 rooms
- 1,7858 rooms
- 1,0069+ rooms
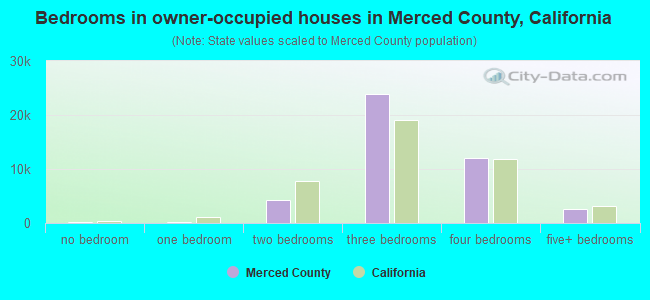
- Bedrooms in owner-occupied houses in Merced County, California
- 513no bedroom
- 7081 bedroom
- 4,7622 bedrooms
- 27,7403 bedrooms
- 14,9674 bedrooms
- 2,6795+ bedrooms
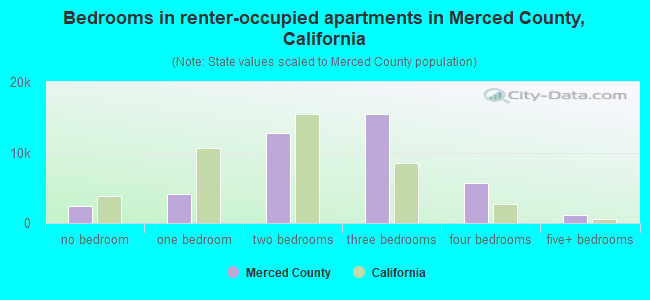
- Bedrooms in renter-occupied apartments in Merced County, California
- 2,082no bedroom
- 4,2661 bedroom
- 10,8392 bedrooms
- 14,2503 bedrooms
- 4,5724 bedrooms
- 4525+ bedrooms

- Cars and other vehicles available in Merced County in owner-occupied houses/condos
- 1,702no vehicle
- 8,8841 vehicle
- 19,4852 vehicles
- 12,3353 vehicles
- 5,9234 vehicles
- 3,0405+ vehicles
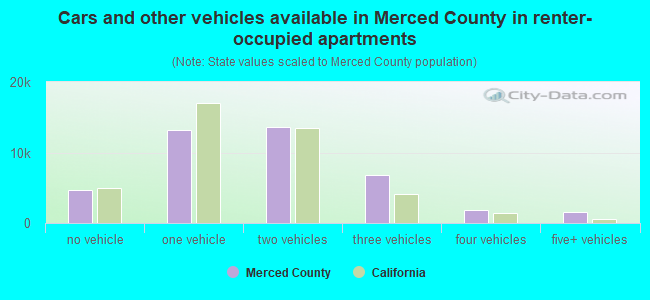
- Cars and other vehicles available in Merced County in renter-occupied apartments
- 3,597no vehicle
- 11,7711 vehicle
- 13,0222 vehicles
- 4,7743 vehicles
- 2,3324 vehicles
- 9655+ vehicles
88.9% of Merced County residents lived in the same house 1 years ago.
Out of people who lived in different houses, 40% lived in this county.
Out of people who lived in different counties, 82% lived in California.
| Merced County: | 88.9% |
| State average: | 88.9% |
Place of birth for U.S.-born residents:
- This state: 196,503
- Other state: 20,471
- Northeast: 1,940
- Midwest: 5,635
- South: 7,266
- West: 5,630
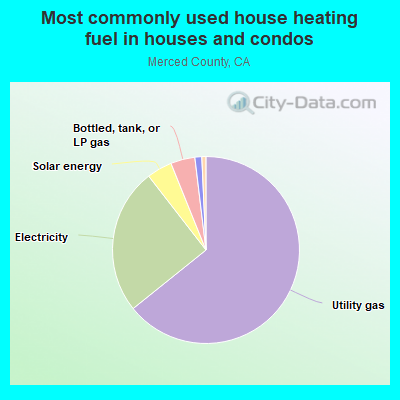
- 66.2%Utility gas
- 23.6%Electricity
- 3.6%Solar energy
- 3.3%Bottled, tank, or LP gas
- 1.5%Wood
- 1.2%Other fuel
- 0.6%No fuel used
- 0.2%Fuel oil, kerosene, etc.
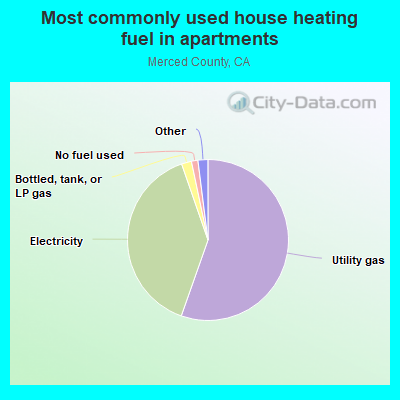
- 61.1%Utility gas
- 33.3%Electricity
- 2.9%Bottled, tank, or LP gas
- 0.9%No fuel used
- 0.8%Wood
- 0.7%Other fuel
- 0.3%Solar energy
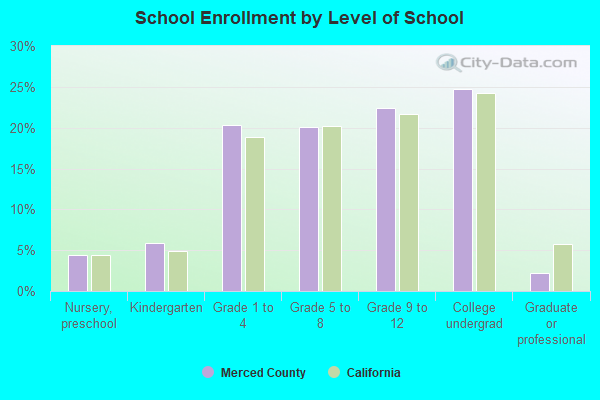
Private vs. public school enrollment:
| Here: | 5.0% |
| California: | 10.5% |
| Here: | 3.7% |
| California: | 8.5% |
| Here: | 9.3% |
| California: | 15.9% |
Merced County government finances - Expenditure in 2020:
- Assistance and Subsidies - Public Welfare, Cash Assistance Programs - Other: $81,698,000
Public Welfare, Cash Assistance Programs - Other: $71,179,000
- Charges - Other: $38,866,000
Other: $31,947,000
Air Transportation: $2,981,000
Air Transportation: $2,391,000
Solid Waste Management: $1,706,000
Solid Waste Management: $1,668,000
Elementary and Secondary Education - Other: $1,454,000
Elementary and Secondary Education - Other: $1,305,000
Natural Resources - Other: $669,000
Natural Resources - Other: $593,000
Parks and Recreation: $389,000
Regular Highways: $362,000
Parks and Recreation: $234,000
Regular Highways: $188,000
- Construction - Elementary and Secondary Education: $4,797,000
Elementary and Secondary Education: $3,098,000
- Current Operations - Elementary and Secondary Education: $102,944,000
Elementary and Secondary Education: $90,519,000
Public Welfare - Other: $79,641,000
Public Welfare - Other: $76,526,000
Health - Other: $75,171,000
Health - Other: $60,774,000
Police Protection: $28,206,000
Correctional Institutions: $27,665,000
Correctional Institutions: $26,868,000
Judicial and Legal Services: $25,347,000
Police Protection: $24,997,000
Judicial and Legal Services: $17,873,000
General - Other: $17,243,000
Local Fire Protection: $16,337,000
Corrections - Other: $16,115,000
General - Other: $15,337,000
Corrections - Other: $14,989,000
Regular Highways: $12,347,000
Central Staff Services: $10,667,000
Central Staff Services: $9,941,000
Financial Administration: $8,409,000
Regular Highways: $8,141,000
Financial Administration: $7,768,000
Natural Resources - Other: $3,491,000
Air Transportation: $3,037,000
Natural Resources - Other: $3,026,000
Libraries: $2,866,000
Libraries: $2,430,000
Parks and Recreation: $2,357,000
Parks and Recreation: $1,861,000
Protective Inspection and Regulation - Other: $1,588,000
Air Transportation: $1,388,000
Protective Inspection and Regulation - Other: $1,273,000
- Federal Intergovernmental - Other: $33,458,000
Other: $20,613,000
Education: $19,780,000
Education: $13,852,000
Air Transportation: $236,000
General Local Government Support: $161,000
General Local Government Support: $156,000
- General - Interest on Debt: $2,709,000
Interest on Debt: $2,627,000
- Intergovernmental to Local - Other - Elementary and Secondary Education: $24,165,000
Other - Elementary and Secondary Education: $23,530,000
Other - General - Other: $2,000
- Intergovernmental to State - Judicial and Legal Services: $219,000
Judicial and Legal Services: $215,000
- Local Intergovernmental - Education: $17,296,000
Education: $14,539,000
Other: $151,000
Other: $31,000
- Long Term Debt - Outstanding Unspecified Public Purpose: $64,655,000
Beginning Outstanding - Unspecified Public Purpose: $64,326,000
Outstanding Unspecified Public Purpose: $58,955,000
Beginning Outstanding - Unspecified Public Purpose: $34,984,000
Issue, Unspecified Public Purpose: $34,910,000
Retired Unspecified Public Purpose: $5,239,000
Retired Unspecified Public Purpose: $4,913,000
Issue, Unspecified Public Purpose: $-458,000
- Miscellaneous - General Revenue - Other: $13,045,000
General Revenue - Other: $7,844,000
Interest Earnings: $6,775,000
Fines and Forfeits: $4,454,000
Fines and Forfeits: $4,348,000
Special Assessments: $2,549,000
Interest Earnings: $2,465,000
Rents: $1,398,000
Rents: $785,000
Special Assessments: $697,000
Sale of Property: $71,000
Sale of Property: $24,000
- Other Capital Outlay - Regular Highways: $44,925,000
Regular Highways: $24,723,000
General - Other: $5,572,000
General - Other: $5,533,000
Correctional Institutions: $3,181,000
Police Protection: $2,818,000
Air Transportation: $1,347,000
Financial Administration: $1,272,000
Air Transportation: $1,231,000
Public Welfare - Other: $927,000
Judicial and Legal Services: $756,000
Local Fire Protection: $687,000
Parks and Recreation: $648,000
Central Staff Services: $460,000
Elementary and Secondary Education: $436,000
Health - Other: $394,000
Health - Other: $369,000
Police Protection: $231,000
Natural Resources - Other: $216,000
Corrections - Other: $155,000
Local Fire Protection: $123,000
Public Welfare - Other: $61,000
Protective Inspection and Regulation - Other: $43,000
Libraries: $15,000
- Other Funds - Cash and Securities: $79,608,000
Cash and Securities: $69,925,000
- State Intergovernmental - Public Welfare: $185,290,000
Public Welfare: $173,508,000
Education: $91,985,000
Education: $83,309,000
Other: $69,769,000
Health and Hospitals: $57,585,000
Health and Hospitals: $42,346,000
Other: $41,859,000
Highways: $19,062,000
Highways: $10,423,000
General Local Government Support: $530,000
General Local Government Support: $516,000
- Tax - Property: $108,213,000
Property: $100,688,000
General Sales and Gross Receipts: $18,562,000
General Sales and Gross Receipts: $15,570,000
Public Utilities Sales: $2,898,000
Public Utilities Sales: $2,674,000
Occupation and Business License - Other: $2,172,000
Occupation and Business License - Other: $1,621,000
Other Selective Sales: $1,422,000
Documentary and Stock Transfer: $1,321,000
Documentary and Stock Transfer: $1,141,000
Other Selective Sales: $969,000
Other: $708,000
Other License: $524,000
Other License: $368,000
- Total Salaries and Wages: $49,524,000
: $42,703,000
Merced County government finances - Revenue in 2020:
- Assistance and Subsidies - Public Welfare, Cash Assistance Programs - Other: $81,698,000
Public Welfare, Cash Assistance Programs - Other: $71,179,000
- Charges - Other: $38,866,000
Other: $31,947,000
Air Transportation: $2,981,000
Air Transportation: $2,391,000
Solid Waste Management: $1,706,000
Solid Waste Management: $1,668,000
Elementary and Secondary Education - Other: $1,454,000
Elementary and Secondary Education - Other: $1,305,000
Natural Resources - Other: $669,000
Natural Resources - Other: $593,000
Parks and Recreation: $389,000
Regular Highways: $362,000
Parks and Recreation: $234,000
Regular Highways: $188,000
- Construction - Elementary and Secondary Education: $4,797,000
Elementary and Secondary Education: $3,098,000
- Current Operations - Elementary and Secondary Education: $102,944,000
Elementary and Secondary Education: $90,519,000
Public Welfare - Other: $79,641,000
Public Welfare - Other: $76,526,000
Health - Other: $75,171,000
Health - Other: $60,774,000
Police Protection: $28,206,000
Correctional Institutions: $27,665,000
Correctional Institutions: $26,868,000
Judicial and Legal Services: $25,347,000
Police Protection: $24,997,000
Judicial and Legal Services: $17,873,000
General - Other: $17,243,000
Local Fire Protection: $16,337,000
Corrections - Other: $16,115,000
General - Other: $15,337,000
Corrections - Other: $14,989,000
Regular Highways: $12,347,000
Central Staff Services: $10,667,000
Central Staff Services: $9,941,000
Financial Administration: $8,409,000
Regular Highways: $8,141,000
Financial Administration: $7,768,000
Natural Resources - Other: $3,491,000
Air Transportation: $3,037,000
Natural Resources - Other: $3,026,000
Libraries: $2,866,000
Libraries: $2,430,000
Parks and Recreation: $2,357,000
Parks and Recreation: $1,861,000
Protective Inspection and Regulation - Other: $1,588,000
Air Transportation: $1,388,000
Protective Inspection and Regulation - Other: $1,273,000
- Federal Intergovernmental - Other: $33,458,000
Other: $20,613,000
Education: $19,780,000
Education: $13,852,000
Air Transportation: $236,000
General Local Government Support: $161,000
General Local Government Support: $156,000
- General - Interest on Debt: $2,709,000
Interest on Debt: $2,627,000
- Intergovernmental to Local - Other - Elementary and Secondary Education: $24,165,000
Other - Elementary and Secondary Education: $23,530,000
Other - General - Other: $2,000
- Intergovernmental to State - Judicial and Legal Services: $219,000
Judicial and Legal Services: $215,000
- Local Intergovernmental - Education: $17,296,000
Education: $14,539,000
Other: $151,000
Other: $31,000
- Long Term Debt - Outstanding Unspecified Public Purpose: $64,655,000
Beginning Outstanding - Unspecified Public Purpose: $64,326,000
Outstanding Unspecified Public Purpose: $58,955,000
Beginning Outstanding - Unspecified Public Purpose: $34,984,000
Issue, Unspecified Public Purpose: $34,910,000
Retired Unspecified Public Purpose: $5,239,000
Retired Unspecified Public Purpose: $4,913,000
Issue, Unspecified Public Purpose: $-458,000
- Miscellaneous - General Revenue - Other: $13,045,000
General Revenue - Other: $7,844,000
Interest Earnings: $6,775,000
Fines and Forfeits: $4,454,000
Fines and Forfeits: $4,348,000
Special Assessments: $2,549,000
Interest Earnings: $2,465,000
Rents: $1,398,000
Rents: $785,000
Special Assessments: $697,000
Sale of Property: $71,000
Sale of Property: $24,000
- Other Capital Outlay - Regular Highways: $44,925,000
Regular Highways: $24,723,000
General - Other: $5,572,000
General - Other: $5,533,000
Correctional Institutions: $3,181,000
Police Protection: $2,818,000
Air Transportation: $1,347,000
Financial Administration: $1,272,000
Air Transportation: $1,231,000
Public Welfare - Other: $927,000
Judicial and Legal Services: $756,000
Local Fire Protection: $687,000
Parks and Recreation: $648,000
Central Staff Services: $460,000
Elementary and Secondary Education: $436,000
Health - Other: $394,000
Health - Other: $369,000
Police Protection: $231,000
Natural Resources - Other: $216,000
Corrections - Other: $155,000
Local Fire Protection: $123,000
Public Welfare - Other: $61,000
Protective Inspection and Regulation - Other: $43,000
Libraries: $15,000
- Other Funds - Cash and Securities: $79,608,000
Cash and Securities: $69,925,000
- State Intergovernmental - Public Welfare: $185,290,000
Public Welfare: $173,508,000
Education: $91,985,000
Education: $83,309,000
Other: $69,769,000
Health and Hospitals: $57,585,000
Health and Hospitals: $42,346,000
Other: $41,859,000
Highways: $19,062,000
Highways: $10,423,000
General Local Government Support: $530,000
General Local Government Support: $516,000
- Tax - Property: $108,213,000
Property: $100,688,000
General Sales and Gross Receipts: $18,562,000
General Sales and Gross Receipts: $15,570,000
Public Utilities Sales: $2,898,000
Public Utilities Sales: $2,674,000
Occupation and Business License - Other: $2,172,000
Occupation and Business License - Other: $1,621,000
Other Selective Sales: $1,422,000
Documentary and Stock Transfer: $1,321,000
Documentary and Stock Transfer: $1,141,000
Other Selective Sales: $969,000
Other: $708,000
Other License: $524,000
Other License: $368,000
- Total Salaries and Wages: $49,524,000
: $42,703,000
Merced County government finances - Debt in 2020:
- Assistance and Subsidies - Public Welfare, Cash Assistance Programs - Other: $81,698,000
Public Welfare, Cash Assistance Programs - Other: $71,179,000
- Charges - Other: $38,866,000
Other: $31,947,000
Air Transportation: $2,981,000
Air Transportation: $2,391,000
Solid Waste Management: $1,706,000
Solid Waste Management: $1,668,000
Elementary and Secondary Education - Other: $1,454,000
Elementary and Secondary Education - Other: $1,305,000
Natural Resources - Other: $669,000
Natural Resources - Other: $593,000
Parks and Recreation: $389,000
Regular Highways: $362,000
Parks and Recreation: $234,000
Regular Highways: $188,000
- Construction - Elementary and Secondary Education: $4,797,000
Elementary and Secondary Education: $3,098,000
- Current Operations - Elementary and Secondary Education: $102,944,000
Elementary and Secondary Education: $90,519,000
Public Welfare - Other: $79,641,000
Public Welfare - Other: $76,526,000
Health - Other: $75,171,000
Health - Other: $60,774,000
Police Protection: $28,206,000
Correctional Institutions: $27,665,000
Correctional Institutions: $26,868,000
Judicial and Legal Services: $25,347,000
Police Protection: $24,997,000
Judicial and Legal Services: $17,873,000
General - Other: $17,243,000
Local Fire Protection: $16,337,000
Corrections - Other: $16,115,000
General - Other: $15,337,000
Corrections - Other: $14,989,000
Regular Highways: $12,347,000
Central Staff Services: $10,667,000
Central Staff Services: $9,941,000
Financial Administration: $8,409,000
Regular Highways: $8,141,000
Financial Administration: $7,768,000
Natural Resources - Other: $3,491,000
Air Transportation: $3,037,000
Natural Resources - Other: $3,026,000
Libraries: $2,866,000
Libraries: $2,430,000
Parks and Recreation: $2,357,000
Parks and Recreation: $1,861,000
Protective Inspection and Regulation - Other: $1,588,000
Air Transportation: $1,388,000
Protective Inspection and Regulation - Other: $1,273,000
- Federal Intergovernmental - Other: $33,458,000
Other: $20,613,000
Education: $19,780,000
Education: $13,852,000
Air Transportation: $236,000
General Local Government Support: $161,000
General Local Government Support: $156,000
- General - Interest on Debt: $2,709,000
Interest on Debt: $2,627,000
- Intergovernmental to Local - Other - Elementary and Secondary Education: $24,165,000
Other - Elementary and Secondary Education: $23,530,000
Other - General - Other: $2,000
- Intergovernmental to State - Judicial and Legal Services: $219,000
Judicial and Legal Services: $215,000
- Local Intergovernmental - Education: $17,296,000
Education: $14,539,000
Other: $151,000
Other: $31,000
- Long Term Debt - Outstanding Unspecified Public Purpose: $64,655,000
Beginning Outstanding - Unspecified Public Purpose: $64,326,000
Outstanding Unspecified Public Purpose: $58,955,000
Beginning Outstanding - Unspecified Public Purpose: $34,984,000
Issue, Unspecified Public Purpose: $34,910,000
Retired Unspecified Public Purpose: $5,239,000
Retired Unspecified Public Purpose: $4,913,000
Issue, Unspecified Public Purpose: $-458,000
- Miscellaneous - General Revenue - Other: $13,045,000
General Revenue - Other: $7,844,000
Interest Earnings: $6,775,000
Fines and Forfeits: $4,454,000
Fines and Forfeits: $4,348,000
Special Assessments: $2,549,000
Interest Earnings: $2,465,000
Rents: $1,398,000
Rents: $785,000
Special Assessments: $697,000
Sale of Property: $71,000
Sale of Property: $24,000
- Other Capital Outlay - Regular Highways: $44,925,000
Regular Highways: $24,723,000
General - Other: $5,572,000
General - Other: $5,533,000
Correctional Institutions: $3,181,000
Police Protection: $2,818,000
Air Transportation: $1,347,000
Financial Administration: $1,272,000
Air Transportation: $1,231,000
Public Welfare - Other: $927,000
Judicial and Legal Services: $756,000
Local Fire Protection: $687,000
Parks and Recreation: $648,000
Central Staff Services: $460,000
Elementary and Secondary Education: $436,000
Health - Other: $394,000
Health - Other: $369,000
Police Protection: $231,000
Natural Resources - Other: $216,000
Corrections - Other: $155,000
Local Fire Protection: $123,000
Public Welfare - Other: $61,000
Protective Inspection and Regulation - Other: $43,000
Libraries: $15,000
- Other Funds - Cash and Securities: $79,608,000
Cash and Securities: $69,925,000
- State Intergovernmental - Public Welfare: $185,290,000
Public Welfare: $173,508,000
Education: $91,985,000
Education: $83,309,000
Other: $69,769,000
Health and Hospitals: $57,585,000
Health and Hospitals: $42,346,000
Other: $41,859,000
Highways: $19,062,000
Highways: $10,423,000
General Local Government Support: $530,000
General Local Government Support: $516,000
- Tax - Property: $108,213,000
Property: $100,688,000
General Sales and Gross Receipts: $18,562,000
General Sales and Gross Receipts: $15,570,000
Public Utilities Sales: $2,898,000
Public Utilities Sales: $2,674,000
Occupation and Business License - Other: $2,172,000
Occupation and Business License - Other: $1,621,000
Other Selective Sales: $1,422,000
Documentary and Stock Transfer: $1,321,000
Documentary and Stock Transfer: $1,141,000
Other Selective Sales: $969,000
Other: $708,000
Other License: $524,000
Other License: $368,000
- Total Salaries and Wages: $49,524,000
: $42,703,000
Merced County government finances - Cash and Securities in 2020:
- Assistance and Subsidies - Public Welfare, Cash Assistance Programs - Other: $81,698,000
Public Welfare, Cash Assistance Programs - Other: $71,179,000
- Charges - Other: $38,866,000
Other: $31,947,000
Air Transportation: $2,981,000
Air Transportation: $2,391,000
Solid Waste Management: $1,706,000
Solid Waste Management: $1,668,000
Elementary and Secondary Education - Other: $1,454,000
Elementary and Secondary Education - Other: $1,305,000
Natural Resources - Other: $669,000
Natural Resources - Other: $593,000
Parks and Recreation: $389,000
Regular Highways: $362,000
Parks and Recreation: $234,000
Regular Highways: $188,000
- Construction - Elementary and Secondary Education: $4,797,000
Elementary and Secondary Education: $3,098,000
- Current Operations - Elementary and Secondary Education: $102,944,000
Elementary and Secondary Education: $90,519,000
Public Welfare - Other: $79,641,000
Public Welfare - Other: $76,526,000
Health - Other: $75,171,000
Health - Other: $60,774,000
Police Protection: $28,206,000
Correctional Institutions: $27,665,000
Correctional Institutions: $26,868,000
Judicial and Legal Services: $25,347,000
Police Protection: $24,997,000
Judicial and Legal Services: $17,873,000
General - Other: $17,243,000
Local Fire Protection: $16,337,000
Corrections - Other: $16,115,000
General - Other: $15,337,000
Corrections - Other: $14,989,000
Regular Highways: $12,347,000
Central Staff Services: $10,667,000
Central Staff Services: $9,941,000
Financial Administration: $8,409,000
Regular Highways: $8,141,000
Financial Administration: $7,768,000
Natural Resources - Other: $3,491,000
Air Transportation: $3,037,000
Natural Resources - Other: $3,026,000
Libraries: $2,866,000
Libraries: $2,430,000
Parks and Recreation: $2,357,000
Parks and Recreation: $1,861,000
Protective Inspection and Regulation - Other: $1,588,000
Air Transportation: $1,388,000
Protective Inspection and Regulation - Other: $1,273,000
- Federal Intergovernmental - Other: $33,458,000
Other: $20,613,000
Education: $19,780,000
Education: $13,852,000
Air Transportation: $236,000
General Local Government Support: $161,000
General Local Government Support: $156,000
- General - Interest on Debt: $2,709,000
Interest on Debt: $2,627,000
- Intergovernmental to Local - Other - Elementary and Secondary Education: $24,165,000
Other - Elementary and Secondary Education: $23,530,000
Other - General - Other: $2,000
- Intergovernmental to State - Judicial and Legal Services: $219,000
Judicial and Legal Services: $215,000
- Local Intergovernmental - Education: $17,296,000
Education: $14,539,000
Other: $151,000
Other: $31,000
- Long Term Debt - Outstanding Unspecified Public Purpose: $64,655,000
Beginning Outstanding - Unspecified Public Purpose: $64,326,000
Outstanding Unspecified Public Purpose: $58,955,000
Beginning Outstanding - Unspecified Public Purpose: $34,984,000
Issue, Unspecified Public Purpose: $34,910,000
Retired Unspecified Public Purpose: $5,239,000
Retired Unspecified Public Purpose: $4,913,000
Issue, Unspecified Public Purpose: $-458,000
- Miscellaneous - General Revenue - Other: $13,045,000
General Revenue - Other: $7,844,000
Interest Earnings: $6,775,000
Fines and Forfeits: $4,454,000
Fines and Forfeits: $4,348,000
Special Assessments: $2,549,000
Interest Earnings: $2,465,000
Rents: $1,398,000
Rents: $785,000
Special Assessments: $697,000
Sale of Property: $71,000
Sale of Property: $24,000
- Other Capital Outlay - Regular Highways: $44,925,000
Regular Highways: $24,723,000
General - Other: $5,572,000
General - Other: $5,533,000
Correctional Institutions: $3,181,000
Police Protection: $2,818,000
Air Transportation: $1,347,000
Financial Administration: $1,272,000
Air Transportation: $1,231,000
Public Welfare - Other: $927,000
Judicial and Legal Services: $756,000
Local Fire Protection: $687,000
Parks and Recreation: $648,000
Central Staff Services: $460,000
Elementary and Secondary Education: $436,000
Health - Other: $394,000
Health - Other: $369,000
Police Protection: $231,000
Natural Resources - Other: $216,000
Corrections - Other: $155,000
Local Fire Protection: $123,000
Public Welfare - Other: $61,000
Protective Inspection and Regulation - Other: $43,000
Libraries: $15,000
- Other Funds - Cash and Securities: $79,608,000
Cash and Securities: $69,925,000
- State Intergovernmental - Public Welfare: $185,290,000
Public Welfare: $173,508,000
Education: $91,985,000
Education: $83,309,000
Other: $69,769,000
Health and Hospitals: $57,585,000
Health and Hospitals: $42,346,000
Other: $41,859,000
Highways: $19,062,000
Highways: $10,423,000
General Local Government Support: $530,000
General Local Government Support: $516,000
- Tax - Property: $108,213,000
Property: $100,688,000
General Sales and Gross Receipts: $18,562,000
General Sales and Gross Receipts: $15,570,000
Public Utilities Sales: $2,898,000
Public Utilities Sales: $2,674,000
Occupation and Business License - Other: $2,172,000
Occupation and Business License - Other: $1,621,000
Other Selective Sales: $1,422,000
Documentary and Stock Transfer: $1,321,000
Documentary and Stock Transfer: $1,141,000
Other Selective Sales: $969,000
Other: $708,000
Other License: $524,000
Other License: $368,000
- Total Salaries and Wages: $49,524,000
: $42,703,000
Supplemental Security Income (SSI) in 2006:
- Total number of recipients: 10,677
- Number of aged recipients: 2,246
- Number of blind and disabled recipients: 8,431
- Number of recipients under 18: 1,270
- Number of recipients between 18 and 64: 5,715
- Number of recipients older than 64: 3,692
- Number of recipients also receiving OASDI: 4,760
- Amount of payments (thousands of dollars): 6,076
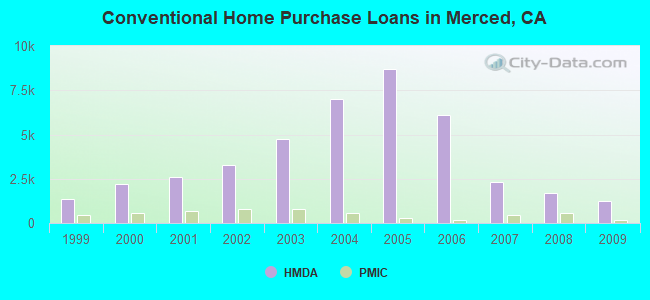
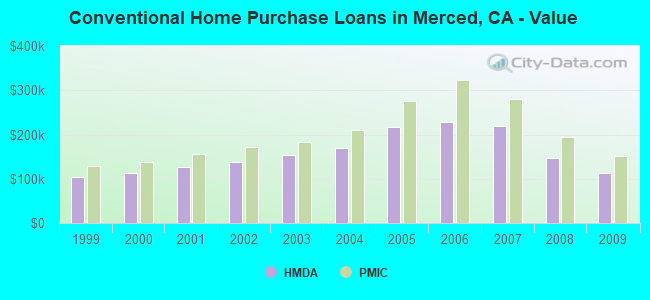
| Home Mortgage Disclosure Act Aggregated Statistics For Year 2009 (Based on 47 full tracts) | ||||||||||||||
| A) FHA, FSA/RHS & VA Home Purchase Loans | B) Conventional Home Purchase Loans | C) Refinancings | D) Home Improvement Loans | E) Loans on Dwellings For 5+ Families | F) Non-occupant Loans on < 5 Family Dwellings (A B C & D) | G) Loans On Manufactured Home Dwelling (A B C & D) | ||||||||
|---|---|---|---|---|---|---|---|---|---|---|---|---|---|---|
| Number | Average Value | Number | Average Value | Number | Average Value | Number | Average Value | Number | Average Value | Number | Average Value | Number | Average Value | |
| LOANS ORIGINATED | 2,220 | $130,075 | 1,254 | $114,102 | 1,125 | $180,135 | 77 | $72,260 | 6 | $1,186,333 | 613 | $93,923 | 11 | $158,455 |
| APPLICATIONS APPROVED, NOT ACCEPTED | 161 | $134,509 | 159 | $123,428 | 192 | $179,438 | 11 | $42,727 | 1 | $260,000 | 91 | $107,681 | 4 | $106,000 |
| APPLICATIONS DENIED | 406 | $138,091 | 344 | $117,078 | 1,064 | $183,736 | 108 | $61,435 | 2 | $223,500 | 284 | $97,317 | 36 | $133,833 |
| APPLICATIONS WITHDRAWN | 295 | $133,336 | 198 | $111,308 | 453 | $198,068 | 43 | $80,651 | 1 | $88,000 | 137 | $102,978 | 8 | $206,250 |
| FILES CLOSED FOR INCOMPLETENESS | 65 | $135,846 | 58 | $116,034 | 156 | $180,615 | 6 | $119,333 | 0 | $0 | 30 | $100,933 | 1 | $386,000 |
| Private Mortgage Insurance Companies Aggregated Statistics For Year 2009 (Based on 39 full tracts) | ||||||
| A) Conventional Home Purchase Loans | B) Refinancings | C) Non-occupant Loans on < 5 Family Dwellings (A & B) | ||||
|---|---|---|---|---|---|---|
| Number | Average Value | Number | Average Value | Number | Average Value | |
| LOANS ORIGINATED | 156 | $151,603 | 12 | $187,333 | 6 | $175,000 |
| APPLICATIONS APPROVED, NOT ACCEPTED | 69 | $159,290 | 13 | $317,462 | 5 | $145,600 |
| APPLICATIONS DENIED | 31 | $138,065 | 3 | $88,000 | 2 | $104,000 |
| APPLICATIONS WITHDRAWN | 8 | $125,500 | 4 | $268,250 | 0 | $0 |
| FILES CLOSED FOR INCOMPLETENESS | 11 | $201,455 | 1 | $297,000 | 2 | $211,000 |
| Most common first names in Merced County, CA among deceased individuals | ||
| Name | Count | Lived (average) |
|---|---|---|
| John | 798 | 74.6 years |
| Mary | 779 | 79.6 years |
| William | 586 | 74.4 years |
| James | 501 | 71.8 years |
| Robert | 494 | 70.4 years |
| Frank | 404 | 75.3 years |
| George | 352 | 75.7 years |
| Maria | 336 | 76.5 years |
| Joe | 326 | 75.5 years |
| Charles | 307 | 73.4 years |
| Most common last names in Merced County, CA among deceased individuals | ||
| Last name | Count | Lived (average) |
|---|---|---|
| Smith | 243 | 75.7 years |
| Jones | 187 | 72.3 years |
| Johnson | 184 | 75.0 years |
| Garcia | 184 | 71.0 years |
| Williams | 178 | 75.2 years |
| Brown | 174 | 75.3 years |
| Silva | 147 | 77.6 years |
| Martinez | 138 | 71.2 years |
| Miller | 119 | 73.3 years |
| Davis | 117 | 71.5 years |
| Businesses in Merced County, CA | ||||
| Name | Count | Name | Count | |
|---|---|---|---|---|
| 7-Eleven | 4 | Kmart | 2 | |
| 99 Cents Only Stores | 1 | Kroger | 1 | |
| AT&T | 3 | La-Z-Boy | 1 | |
| Ace Hardware | 2 | Little Caesars Pizza | 5 | |
| AutoZone | 3 | Long John Silver's | 1 | |
| Baskin-Robbins | 2 | Lowe's | 1 | |
| Best Western | 3 | Marriott | 1 | |
| Big O Tires | 2 | Marshalls | 1 | |
| Blockbuster | 1 | Mazda | 1 | |
| Budget Car Rental | 1 | McDonald's | 12 | |
| Burger King | 4 | Motel 6 | 3 | |
| CVS | 2 | New Balance | 1 | |
| Carl\s Jr. | 6 | Nike | 5 | |
| Chevrolet | 1 | Nissan | 1 | |
| Circle K | 6 | Panda Express | 3 | |
| Cold Stone Creamery | 1 | Payless | 2 | |
| Comfort Inn | 1 | Penske | 2 | |
| Costco | 1 | Pizza Hut | 2 | |
| Cricket Wireless | 11 | Popeyes | 1 | |
| Curves | 1 | Qdoba Mexican Grill | 1 | |
| DHL | 3 | Quality | 1 | |
| Dairy Queen | 1 | Quiznos | 4 | |
| Days Inn | 2 | RadioShack | 2 | |
| Dennys | 4 | Ramada | 1 | |
| Domino's Pizza | 3 | Rite Aid | 5 | |
| DressBarn | 1 | Rue21 | 2 | |
| Dressbarn | 1 | SAS Shoes | 1 | |
| Famous Footwear | 2 | SONIC Drive-In | 2 | |
| Fashion Bug | 2 | Sears | 1 | |
| FedEx | 19 | Sprint Nextel | 2 | |
| Ford | 2 | Starbucks | 10 | |
| GNC | 4 | T-Mobile | 5 | |
| GameStop | 2 | Taco Bell | 6 | |
| H&R Block | 6 | Target | 2 | |
| Hilton | 1 | Toyota | 1 | |
| Holiday Inn | 2 | Travelodge | 1 | |
| Home Depot | 2 | True Value | 2 | |
| Honda | 1 | U-Haul | 10 | |
| Hot Topic | 1 | UPS | 16 | |
| JCPenney | 1 | Vans | 2 | |
| Jack In The Box | 3 | Volkswagen | 1 | |
| Jamba Juice | 2 | Walgreens | 4 | |
| Jones New York | 4 | Walmart | 1 | |
| KFC | 3 | Wendy's | 2 | |
Merced County on our top lists:
- #28 on the list of "Top 101 counties with the lowest surface withdrawal of fresh water for public supply (pop. 50,000+)"
- #30 on the list of "Top 101 counties with the highest number of births per 1000 residents 2007-2013"
- #30 on the list of "Top 101 counties with the highest number of births per 1000 residents 2007-2013 (pop 50,000+)"
- #49 on the list of "Top 101 counties with the highest ground withdrawal of fresh water for public supply"
- #49 on the list of "Top 101 counties with the highest ground withdrawal of fresh water for public supply (pop. 50,000+)"
- #82 on the list of "Top 101 counties with the lowest number of deaths per 1000 residents 2007-2013 (pop. 50,000+)"
- #85 on the list of "Top 101 counties with the highest Particulate Matter (PM2.5) Annual air pollution readings in 2012 (µg/m3)"