Los Banos, California Submit your own pictures of this city and show them to the world
OSM Map
General Map
Google Map
MSN Map
OSM Map
General Map
Google Map
MSN Map
OSM Map
General Map
Google Map
MSN Map
OSM Map
General Map
Google Map
MSN Map
Please wait while loading the map...
Population in 2022: 47,044 (99% urban, 1% rural). Population change since 2000: +81.9%Males: 24,020 Females: 23,024
March 2022 cost of living index in Los Banos: 95.1 (less than average, U.S. average is 100) Percentage of residents living in poverty in 2022: 15.0%for White Non-Hispanic residents , 12.7% for Black residents , 14.5% for Hispanic or Latino residents , 40.3% for American Indian residents , 15.1% for other race residents , 23.0% for two or more races residents )
Profiles of local businesses
Business Search - 14 Million verified businesses
Data:
Median household income ($)
Median household income (% change since 2000)
Household income diversity
Ratio of average income to average house value (%)
Ratio of average income to average rent
Median household income ($) - White
Median household income ($) - Black or African American
Median household income ($) - Asian
Median household income ($) - Hispanic or Latino
Median household income ($) - American Indian and Alaska Native
Median household income ($) - Multirace
Median household income ($) - Other Race
Median household income for houses/condos with a mortgage ($)
Median household income for apartments without a mortgage ($)
Races - White alone (%)
Races - White alone (% change since 2000)
Races - Black alone (%)
Races - Black alone (% change since 2000)
Races - American Indian alone (%)
Races - American Indian alone (% change since 2000)
Races - Asian alone (%)
Races - Asian alone (% change since 2000)
Races - Hispanic (%)
Races - Hispanic (% change since 2000)
Races - Native Hawaiian and Other Pacific Islander alone (%)
Races - Native Hawaiian and Other Pacific Islander alone (% change since 2000)
Races - Two or more races (%)
Races - Two or more races (% change since 2000)
Races - Other race alone (%)
Races - Other race alone (% change since 2000)
Racial diversity
Unemployment (%)
Unemployment (% change since 2000)
Unemployment (%) - White
Unemployment (%) - Black or African American
Unemployment (%) - Asian
Unemployment (%) - Hispanic or Latino
Unemployment (%) - American Indian and Alaska Native
Unemployment (%) - Multirace
Unemployment (%) - Other Race
Population density (people per square mile)
Population - Males (%)
Population - Females (%)
Population - Males (%) - White
Population - Males (%) - Black or African American
Population - Males (%) - Asian
Population - Males (%) - Hispanic or Latino
Population - Males (%) - American Indian and Alaska Native
Population - Males (%) - Multirace
Population - Males (%) - Other Race
Population - Females (%) - White
Population - Females (%) - Black or African American
Population - Females (%) - Asian
Population - Females (%) - Hispanic or Latino
Population - Females (%) - American Indian and Alaska Native
Population - Females (%) - Multirace
Population - Females (%) - Other Race
Coronavirus confirmed cases (Apr 28, 2024)
Deaths caused by coronavirus (Apr 28, 2024)
Coronavirus confirmed cases (per 100k population) (Apr 28, 2024)
Deaths caused by coronavirus (per 100k population) (Apr 28, 2024)
Daily increase in number of cases (Apr 28, 2024)
Weekly increase in number of cases (Apr 28, 2024)
Cases doubled (in days) (Apr 28, 2024)
Hospitalized patients (Apr 18, 2022)
Negative test results (Apr 18, 2022)
Total test results (Apr 18, 2022)
COVID Vaccine doses distributed (per 100k population) (Sep 19, 2023)
COVID Vaccine doses administered (per 100k population) (Sep 19, 2023)
COVID Vaccine doses distributed (Sep 19, 2023)
COVID Vaccine doses administered (Sep 19, 2023)
Likely homosexual households (%)
Likely homosexual households (% change since 2000)
Likely homosexual households - Lesbian couples (%)
Likely homosexual households - Lesbian couples (% change since 2000)
Likely homosexual households - Gay men (%)
Likely homosexual households - Gay men (% change since 2000)
Cost of living index
Median gross rent ($)
Median contract rent ($)
Median monthly housing costs ($)
Median house or condo value ($)
Median house or condo value ($ change since 2000)
Mean house or condo value by units in structure - 1, detached ($)
Mean house or condo value by units in structure - 1, attached ($)
Mean house or condo value by units in structure - 2 ($)
Mean house or condo value by units in structure by units in structure - 3 or 4 ($)
Mean house or condo value by units in structure - 5 or more ($)
Mean house or condo value by units in structure - Boat, RV, van, etc. ($)
Mean house or condo value by units in structure - Mobile home ($)
Median house or condo value ($) - White
Median house or condo value ($) - Black or African American
Median house or condo value ($) - Asian
Median house or condo value ($) - Hispanic or Latino
Median house or condo value ($) - American Indian and Alaska Native
Median house or condo value ($) - Multirace
Median house or condo value ($) - Other Race
Median resident age
Resident age diversity
Median resident age - Males
Median resident age - Females
Median resident age - White
Median resident age - Black or African American
Median resident age - Asian
Median resident age - Hispanic or Latino
Median resident age - American Indian and Alaska Native
Median resident age - Multirace
Median resident age - Other Race
Median resident age - Males - White
Median resident age - Males - Black or African American
Median resident age - Males - Asian
Median resident age - Males - Hispanic or Latino
Median resident age - Males - American Indian and Alaska Native
Median resident age - Males - Multirace
Median resident age - Males - Other Race
Median resident age - Females - White
Median resident age - Females - Black or African American
Median resident age - Females - Asian
Median resident age - Females - Hispanic or Latino
Median resident age - Females - American Indian and Alaska Native
Median resident age - Females - Multirace
Median resident age - Females - Other Race
Commute - mean travel time to work (minutes)
Travel time to work - Less than 5 minutes (%)
Travel time to work - Less than 5 minutes (% change since 2000)
Travel time to work - 5 to 9 minutes (%)
Travel time to work - 5 to 9 minutes (% change since 2000)
Travel time to work - 10 to 19 minutes (%)
Travel time to work - 10 to 19 minutes (% change since 2000)
Travel time to work - 20 to 29 minutes (%)
Travel time to work - 20 to 29 minutes (% change since 2000)
Travel time to work - 30 to 39 minutes (%)
Travel time to work - 30 to 39 minutes (% change since 2000)
Travel time to work - 40 to 59 minutes (%)
Travel time to work - 40 to 59 minutes (% change since 2000)
Travel time to work - 60 to 89 minutes (%)
Travel time to work - 60 to 89 minutes (% change since 2000)
Travel time to work - 90 or more minutes (%)
Travel time to work - 90 or more minutes (% change since 2000)
Marital status - Never married (%)
Marital status - Now married (%)
Marital status - Separated (%)
Marital status - Widowed (%)
Marital status - Divorced (%)
Median family income ($)
Median family income (% change since 2000)
Median non-family income ($)
Median non-family income (% change since 2000)
Median per capita income ($)
Median per capita income (% change since 2000)
Median family income ($) - White
Median family income ($) - Black or African American
Median family income ($) - Asian
Median family income ($) - Hispanic or Latino
Median family income ($) - American Indian and Alaska Native
Median family income ($) - Multirace
Median family income ($) - Other Race
Median year house/condo built
Median year apartment built
Year house built - Built 2005 or later (%)
Year house built - Built 2000 to 2004 (%)
Year house built - Built 1990 to 1999 (%)
Year house built - Built 1980 to 1989 (%)
Year house built - Built 1970 to 1979 (%)
Year house built - Built 1960 to 1969 (%)
Year house built - Built 1950 to 1959 (%)
Year house built - Built 1940 to 1949 (%)
Year house built - Built 1939 or earlier (%)
Average household size
Household density (households per square mile)
Average household size - White
Average household size - Black or African American
Average household size - Asian
Average household size - Hispanic or Latino
Average household size - American Indian and Alaska Native
Average household size - Multirace
Average household size - Other Race
Occupied housing units (%)
Vacant housing units (%)
Owner occupied housing units (%)
Renter occupied housing units (%)
Vacancy status - For rent (%)
Vacancy status - For sale only (%)
Vacancy status - Rented or sold, not occupied (%)
Vacancy status - For seasonal, recreational, or occasional use (%)
Vacancy status - For migrant workers (%)
Vacancy status - Other vacant (%)
Residents with income below the poverty level (%)
Residents with income below 50% of the poverty level (%)
Children below poverty level (%)
Poor families by family type - Married-couple family (%)
Poor families by family type - Male, no wife present (%)
Poor families by family type - Female, no husband present (%)
Poverty status for native-born residents (%)
Poverty status for foreign-born residents (%)
Poverty among high school graduates not in families (%)
Poverty among people who did not graduate high school not in families (%)
Residents with income below the poverty level (%) - White
Residents with income below the poverty level (%) - Black or African American
Residents with income below the poverty level (%) - Asian
Residents with income below the poverty level (%) - Hispanic or Latino
Residents with income below the poverty level (%) - American Indian and Alaska Native
Residents with income below the poverty level (%) - Multirace
Residents with income below the poverty level (%) - Other Race
Air pollution - Air Quality Index (AQI)
Air pollution - CO
Air pollution - NO2
Air pollution - SO2
Air pollution - Ozone
Air pollution - PM10
Air pollution - PM25
Air pollution - Pb
Crime - Murders per 100,000 population
Crime - Rapes per 100,000 population
Crime - Robberies per 100,000 population
Crime - Assaults per 100,000 population
Crime - Burglaries per 100,000 population
Crime - Thefts per 100,000 population
Crime - Auto thefts per 100,000 population
Crime - Arson per 100,000 population
Crime - City-data.com crime index
Crime - Violent crime index
Crime - Property crime index
Crime - Murders per 100,000 population (5 year average)
Crime - Rapes per 100,000 population (5 year average)
Crime - Robberies per 100,000 population (5 year average)
Crime - Assaults per 100,000 population (5 year average)
Crime - Burglaries per 100,000 population (5 year average)
Crime - Thefts per 100,000 population (5 year average)
Crime - Auto thefts per 100,000 population (5 year average)
Crime - Arson per 100,000 population (5 year average)
Crime - City-data.com crime index (5 year average)
Crime - Violent crime index (5 year average)
Crime - Property crime index (5 year average)
1996 Presidential Elections Results (%) - Democratic Party (Clinton)
1996 Presidential Elections Results (%) - Republican Party (Dole)
1996 Presidential Elections Results (%) - Other
2000 Presidential Elections Results (%) - Democratic Party (Gore)
2000 Presidential Elections Results (%) - Republican Party (Bush)
2000 Presidential Elections Results (%) - Other
2004 Presidential Elections Results (%) - Democratic Party (Kerry)
2004 Presidential Elections Results (%) - Republican Party (Bush)
2004 Presidential Elections Results (%) - Other
2008 Presidential Elections Results (%) - Democratic Party (Obama)
2008 Presidential Elections Results (%) - Republican Party (McCain)
2008 Presidential Elections Results (%) - Other
2012 Presidential Elections Results (%) - Democratic Party (Obama)
2012 Presidential Elections Results (%) - Republican Party (Romney)
2012 Presidential Elections Results (%) - Other
2016 Presidential Elections Results (%) - Democratic Party (Clinton)
2016 Presidential Elections Results (%) - Republican Party (Trump)
2016 Presidential Elections Results (%) - Other
2020 Presidential Elections Results (%) - Democratic Party (Biden)
2020 Presidential Elections Results (%) - Republican Party (Trump)
2020 Presidential Elections Results (%) - Other
Ancestries Reported - Arab (%)
Ancestries Reported - Czech (%)
Ancestries Reported - Danish (%)
Ancestries Reported - Dutch (%)
Ancestries Reported - English (%)
Ancestries Reported - French (%)
Ancestries Reported - French Canadian (%)
Ancestries Reported - German (%)
Ancestries Reported - Greek (%)
Ancestries Reported - Hungarian (%)
Ancestries Reported - Irish (%)
Ancestries Reported - Italian (%)
Ancestries Reported - Lithuanian (%)
Ancestries Reported - Norwegian (%)
Ancestries Reported - Polish (%)
Ancestries Reported - Portuguese (%)
Ancestries Reported - Russian (%)
Ancestries Reported - Scotch-Irish (%)
Ancestries Reported - Scottish (%)
Ancestries Reported - Slovak (%)
Ancestries Reported - Subsaharan African (%)
Ancestries Reported - Swedish (%)
Ancestries Reported - Swiss (%)
Ancestries Reported - Ukrainian (%)
Ancestries Reported - United States (%)
Ancestries Reported - Welsh (%)
Ancestries Reported - West Indian (%)
Ancestries Reported - Other (%)
Educational Attainment - No schooling completed (%)
Educational Attainment - Less than high school (%)
Educational Attainment - High school or equivalent (%)
Educational Attainment - Less than 1 year of college (%)
Educational Attainment - 1 or more years of college (%)
Educational Attainment - Associate degree (%)
Educational Attainment - Bachelor's degree (%)
Educational Attainment - Master's degree (%)
Educational Attainment - Professional school degree (%)
Educational Attainment - Doctorate degree (%)
School Enrollment - Nursery, preschool (%)
School Enrollment - Kindergarten (%)
School Enrollment - Grade 1 to 4 (%)
School Enrollment - Grade 5 to 8 (%)
School Enrollment - Grade 9 to 12 (%)
School Enrollment - College undergrad (%)
School Enrollment - Graduate or professional (%)
School Enrollment - Not enrolled in school (%)
School enrollment - Public schools (%)
School enrollment - Private schools (%)
School enrollment - Not enrolled (%)
Median number of rooms in houses and condos
Median number of rooms in apartments
Housing units lacking complete plumbing facilities (%)
Housing units lacking complete kitchen facilities (%)
Density of houses
Urban houses (%)
Rural houses (%)
Households with people 60 years and over (%)
Households with people 65 years and over (%)
Households with people 75 years and over (%)
Households with one or more nonrelatives (%)
Households with no nonrelatives (%)
Population in households (%)
Family households (%)
Nonfamily households (%)
Population in families (%)
Family households with own children (%)
Median number of bedrooms in owner occupied houses
Mean number of bedrooms in owner occupied houses
Median number of bedrooms in renter occupied houses
Mean number of bedrooms in renter occupied houses
Median number of vehichles in owner occupied houses
Mean number of vehichles in owner occupied houses
Median number of vehichles in renter occupied houses
Mean number of vehichles in renter occupied houses
Mortgage status - with mortgage (%)
Mortgage status - with second mortgage (%)
Mortgage status - with home equity loan (%)
Mortgage status - with both second mortgage and home equity loan (%)
Mortgage status - without a mortgage (%)
Average family size
Average family size - White
Average family size - Black or African American
Average family size - Asian
Average family size - Hispanic or Latino
Average family size - American Indian and Alaska Native
Average family size - Multirace
Average family size - Other Race
Geographical mobility - Same house 1 year ago (%)
Geographical mobility - Moved within same county (%)
Geographical mobility - Moved from different county within same state (%)
Geographical mobility - Moved from different state (%)
Geographical mobility - Moved from abroad (%)
Place of birth - Born in state of residence (%)
Place of birth - Born in other state (%)
Place of birth - Native, outside of US (%)
Place of birth - Foreign born (%)
Housing units in structures - 1, detached (%)
Housing units in structures - 1, attached (%)
Housing units in structures - 2 (%)
Housing units in structures - 3 or 4 (%)
Housing units in structures - 5 to 9 (%)
Housing units in structures - 10 to 19 (%)
Housing units in structures - 20 to 49 (%)
Housing units in structures - 50 or more (%)
Housing units in structures - Mobile home (%)
Housing units in structures - Boat, RV, van, etc. (%)
House/condo owner moved in on average (years ago)
Renter moved in on average (years ago)
Year householder moved into unit - Moved in 1999 to March 2000 (%)
Year householder moved into unit - Moved in 1995 to 1998 (%)
Year householder moved into unit - Moved in 1990 to 1994 (%)
Year householder moved into unit - Moved in 1980 to 1989 (%)
Year householder moved into unit - Moved in 1970 to 1979 (%)
Year householder moved into unit - Moved in 1969 or earlier (%)
Means of transportation to work - Drove car alone (%)
Means of transportation to work - Carpooled (%)
Means of transportation to work - Public transportation (%)
Means of transportation to work - Bus or trolley bus (%)
Means of transportation to work - Streetcar or trolley car (%)
Means of transportation to work - Subway or elevated (%)
Means of transportation to work - Railroad (%)
Means of transportation to work - Ferryboat (%)
Means of transportation to work - Taxicab (%)
Means of transportation to work - Motorcycle (%)
Means of transportation to work - Bicycle (%)
Means of transportation to work - Walked (%)
Means of transportation to work - Other means (%)
Working at home (%)
Industry diversity
Most Common Industries - Agriculture, forestry, fishing and hunting, and mining (%)
Most Common Industries - Agriculture, forestry, fishing and hunting (%)
Most Common Industries - Mining, quarrying, and oil and gas extraction (%)
Most Common Industries - Construction (%)
Most Common Industries - Manufacturing (%)
Most Common Industries - Wholesale trade (%)
Most Common Industries - Retail trade (%)
Most Common Industries - Transportation and warehousing, and utilities (%)
Most Common Industries - Transportation and warehousing (%)
Most Common Industries - Utilities (%)
Most Common Industries - Information (%)
Most Common Industries - Finance and insurance, and real estate and rental and leasing (%)
Most Common Industries - Finance and insurance (%)
Most Common Industries - Real estate and rental and leasing (%)
Most Common Industries - Professional, scientific, and management, and administrative and waste management services (%)
Most Common Industries - Professional, scientific, and technical services (%)
Most Common Industries - Management of companies and enterprises (%)
Most Common Industries - Administrative and support and waste management services (%)
Most Common Industries - Educational services, and health care and social assistance (%)
Most Common Industries - Educational services (%)
Most Common Industries - Health care and social assistance (%)
Most Common Industries - Arts, entertainment, and recreation, and accommodation and food services (%)
Most Common Industries - Arts, entertainment, and recreation (%)
Most Common Industries - Accommodation and food services (%)
Most Common Industries - Other services, except public administration (%)
Most Common Industries - Public administration (%)
Occupation diversity
Most Common Occupations - Management, business, science, and arts occupations (%)
Most Common Occupations - Management, business, and financial occupations (%)
Most Common Occupations - Management occupations (%)
Most Common Occupations - Business and financial operations occupations (%)
Most Common Occupations - Computer, engineering, and science occupations (%)
Most Common Occupations - Computer and mathematical occupations (%)
Most Common Occupations - Architecture and engineering occupations (%)
Most Common Occupations - Life, physical, and social science occupations (%)
Most Common Occupations - Education, legal, community service, arts, and media occupations (%)
Most Common Occupations - Community and social service occupations (%)
Most Common Occupations - Legal occupations (%)
Most Common Occupations - Education, training, and library occupations (%)
Most Common Occupations - Arts, design, entertainment, sports, and media occupations (%)
Most Common Occupations - Healthcare practitioners and technical occupations (%)
Most Common Occupations - Health diagnosing and treating practitioners and other technical occupations (%)
Most Common Occupations - Health technologists and technicians (%)
Most Common Occupations - Service occupations (%)
Most Common Occupations - Healthcare support occupations (%)
Most Common Occupations - Protective service occupations (%)
Most Common Occupations - Fire fighting and prevention, and other protective service workers including supervisors (%)
Most Common Occupations - Law enforcement workers including supervisors (%)
Most Common Occupations - Food preparation and serving related occupations (%)
Most Common Occupations - Building and grounds cleaning and maintenance occupations (%)
Most Common Occupations - Personal care and service occupations (%)
Most Common Occupations - Sales and office occupations (%)
Most Common Occupations - Sales and related occupations (%)
Most Common Occupations - Office and administrative support occupations (%)
Most Common Occupations - Natural resources, construction, and maintenance occupations (%)
Most Common Occupations - Farming, fishing, and forestry occupations (%)
Most Common Occupations - Construction and extraction occupations (%)
Most Common Occupations - Installation, maintenance, and repair occupations (%)
Most Common Occupations - Production, transportation, and material moving occupations (%)
Most Common Occupations - Production occupations (%)
Most Common Occupations - Transportation occupations (%)
Most Common Occupations - Material moving occupations (%)
People in Group quarters - Institutionalized population (%)
People in Group quarters - Correctional institutions (%)
People in Group quarters - Federal prisons and detention centers (%)
People in Group quarters - Halfway houses (%)
People in Group quarters - Local jails and other confinement facilities (including police lockups) (%)
People in Group quarters - Military disciplinary barracks (%)
People in Group quarters - State prisons (%)
People in Group quarters - Other types of correctional institutions (%)
People in Group quarters - Nursing homes (%)
People in Group quarters - Hospitals/wards, hospices, and schools for the handicapped (%)
People in Group quarters - Hospitals/wards and hospices for chronically ill (%)
People in Group quarters - Hospices or homes for chronically ill (%)
People in Group quarters - Military hospitals or wards for chronically ill (%)
People in Group quarters - Other hospitals or wards for chronically ill (%)
People in Group quarters - Hospitals or wards for drug/alcohol abuse (%)
People in Group quarters - Mental (Psychiatric) hospitals or wards (%)
People in Group quarters - Schools, hospitals, or wards for the mentally retarded (%)
People in Group quarters - Schools, hospitals, or wards for the physically handicapped (%)
People in Group quarters - Institutions for the deaf (%)
People in Group quarters - Institutions for the blind (%)
People in Group quarters - Orthopedic wards and institutions for the physically handicapped (%)
People in Group quarters - Wards in general hospitals for patients who have no usual home elsewhere (%)
People in Group quarters - Wards in military hospitals for patients who have no usual home elsewhere (%)
People in Group quarters - Juvenile institutions (%)
People in Group quarters - Long-term care (%)
People in Group quarters - Homes for abused, dependent, and neglected children (%)
People in Group quarters - Residential treatment centers for emotionally disturbed children (%)
People in Group quarters - Training schools for juvenile delinquents (%)
People in Group quarters - Short-term care, detention or diagnostic centers for delinquent children (%)
People in Group quarters - Type of juvenile institution unknown (%)
People in Group quarters - Noninstitutionalized population (%)
People in Group quarters - College dormitories (includes college quarters off campus) (%)
People in Group quarters - Military quarters (%)
People in Group quarters - On base (%)
People in Group quarters - Barracks, unaccompanied personnel housing (UPH), (Enlisted/Officer), ;and similar group living quarters for military personnel (%)
People in Group quarters - Transient quarters for temporary residents (%)
People in Group quarters - Military ships (%)
People in Group quarters - Group homes (%)
People in Group quarters - Homes or halfway houses for drug/alcohol abuse (%)
People in Group quarters - Homes for the mentally ill (%)
People in Group quarters - Homes for the mentally retarded (%)
People in Group quarters - Homes for the physically handicapped (%)
People in Group quarters - Other group homes (%)
People in Group quarters - Religious group quarters (%)
People in Group quarters - Dormitories (%)
People in Group quarters - Agriculture workers' dormitories on farms (%)
People in Group quarters - Job Corps and vocational training facilities (%)
People in Group quarters - Other workers' dormitories (%)
People in Group quarters - Crews of maritime vessels (%)
People in Group quarters - Other nonhousehold living situations (%)
People in Group quarters - Other noninstitutional group quarters (%)
Residents speaking English at home (%)
Residents speaking English at home - Born in the United States (%)
Residents speaking English at home - Native, born elsewhere (%)
Residents speaking English at home - Foreign born (%)
Residents speaking Spanish at home (%)
Residents speaking Spanish at home - Born in the United States (%)
Residents speaking Spanish at home - Native, born elsewhere (%)
Residents speaking Spanish at home - Foreign born (%)
Residents speaking other language at home (%)
Residents speaking other language at home - Born in the United States (%)
Residents speaking other language at home - Native, born elsewhere (%)
Residents speaking other language at home - Foreign born (%)
Class of Workers - Employee of private company (%)
Class of Workers - Self-employed in own incorporated business (%)
Class of Workers - Private not-for-profit wage and salary workers (%)
Class of Workers - Local government workers (%)
Class of Workers - State government workers (%)
Class of Workers - Federal government workers (%)
Class of Workers - Self-employed workers in own not incorporated business and Unpaid family workers (%)
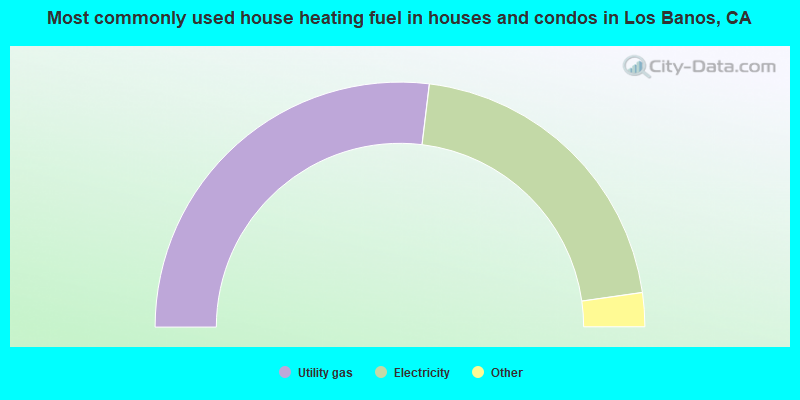
House heating fuel used in houses and condos - Utility gas (%)
House heating fuel used in houses and condos - Bottled, tank, or LP gas (%)
House heating fuel used in houses and condos - Electricity (%)
House heating fuel used in houses and condos - Fuel oil, kerosene, etc. (%)
House heating fuel used in houses and condos - Coal or coke (%)
House heating fuel used in houses and condos - Wood (%)
House heating fuel used in houses and condos - Solar energy (%)
House heating fuel used in houses and condos - Other fuel (%)
House heating fuel used in houses and condos - No fuel used (%)
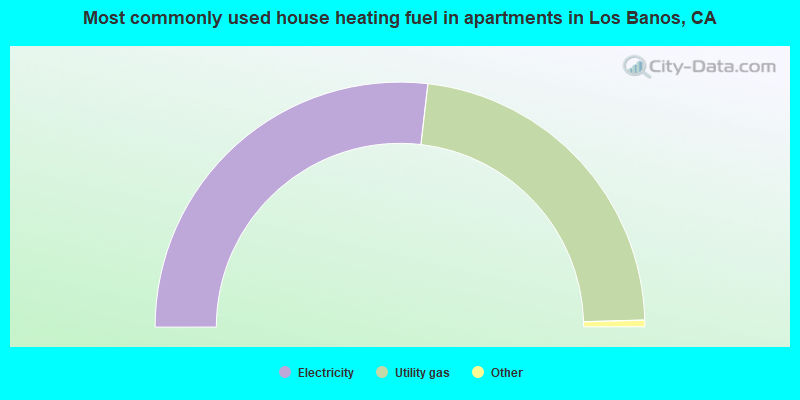
House heating fuel used in apartments - Utility gas (%)
House heating fuel used in apartments - Bottled, tank, or LP gas (%)
House heating fuel used in apartments - Electricity (%)
House heating fuel used in apartments - Fuel oil, kerosene, etc. (%)
House heating fuel used in apartments - Coal or coke (%)
House heating fuel used in apartments - Wood (%)
House heating fuel used in apartments - Solar energy (%)
House heating fuel used in apartments - Other fuel (%)
House heating fuel used in apartments - No fuel used (%)
Armed forces status - In Armed Forces (%)
Armed forces status - Civilian (%)
Armed forces status - Civilian - Veteran (%)
Armed forces status - Civilian - Nonveteran (%)
Fatal accidents locations in years 2005-2021
Fatal accidents locations in 2005
Fatal accidents locations in 2006
Fatal accidents locations in 2007
Fatal accidents locations in 2008
Fatal accidents locations in 2009
Fatal accidents locations in 2010
Fatal accidents locations in 2011
Fatal accidents locations in 2012
Fatal accidents locations in 2013
Fatal accidents locations in 2014
Fatal accidents locations in 2015
Fatal accidents locations in 2016
Fatal accidents locations in 2017
Fatal accidents locations in 2018
Fatal accidents locations in 2019
Fatal accidents locations in 2020
Fatal accidents locations in 2021
Alcohol use - People drinking some alcohol every month (%)
Alcohol use - People not drinking at all (%)
Alcohol use - Average days/month drinking alcohol
Alcohol use - Average drinks/week
Alcohol use - Average days/year people drink much
Audiometry - Average condition of hearing (%)
Audiometry - People that can hear a whisper from across a quiet room (%)
Audiometry - People that can hear normal voice from across a quiet room (%)
Audiometry - Ears ringing, roaring, buzzing (%)
Audiometry - Had a job exposure to loud noise (%)
Audiometry - Had off-work exposure to loud noise (%)
Blood Pressure & Cholesterol - Has high blood pressure (%)
Blood Pressure & Cholesterol - Checking blood pressure at home (%)
Blood Pressure & Cholesterol - Frequently checking blood cholesterol (%)
Blood Pressure & Cholesterol - Has high cholesterol level (%)
Consumer Behavior - Money monthly spent on food at supermarket/grocery store
Consumer Behavior - Money monthly spent on food at other stores
Consumer Behavior - Money monthly spent on eating out
Consumer Behavior - Money monthly spent on carryout/delivered foods
Consumer Behavior - Income spent on food at supermarket/grocery store (%)
Consumer Behavior - Income spent on food at other stores (%)
Consumer Behavior - Income spent on eating out (%)
Consumer Behavior - Income spent on carryout/delivered foods (%)
Current Health Status - General health condition (%)
Current Health Status - Blood donors (%)
Current Health Status - Has blood ever tested for HIV virus (%)
Current Health Status - Left-handed people (%)
Dermatology - People using sunscreen (%)
Diabetes - Diabetics (%)
Diabetes - Had a blood test for high blood sugar (%)
Diabetes - People taking insulin (%)
Diet Behavior & Nutrition - Diet health (%)
Diet Behavior & Nutrition - Milk product consumption (# of products/month)
Diet Behavior & Nutrition - Meals not home prepared (#/week)
Diet Behavior & Nutrition - Meals from fast food or pizza place (#/week)
Diet Behavior & Nutrition - Ready-to-eat foods (#/month)
Diet Behavior & Nutrition - Frozen meals/pizza (#/month)
Drug Use - People that ever used marijuana or hashish (%)
Drug Use - Ever used hard drugs (%)
Drug Use - Ever used any form of cocaine (%)
Drug Use - Ever used heroin (%)
Drug Use - Ever used methamphetamine (%)
Health Insurance - People covered by health insurance (%)
Kidney Conditions-Urology - Avg. # of times urinating at night
Medical Conditions - People with asthma (%)
Medical Conditions - People with anemia (%)
Medical Conditions - People with psoriasis (%)
Medical Conditions - People with overweight (%)
Medical Conditions - Elderly people having difficulties in thinking or remembering (%)
Medical Conditions - People who ever received blood transfusion (%)
Medical Conditions - People having trouble seeing even with glass/contacts (%)
Medical Conditions - People with arthritis (%)
Medical Conditions - People with gout (%)
Medical Conditions - People with congestive heart failure (%)
Medical Conditions - People with coronary heart disease (%)
Medical Conditions - People with angina pectoris (%)
Medical Conditions - People who ever had heart attack (%)
Medical Conditions - People who ever had stroke (%)
Medical Conditions - People with emphysema (%)
Medical Conditions - People with thyroid problem (%)
Medical Conditions - People with chronic bronchitis (%)
Medical Conditions - People with any liver condition (%)
Medical Conditions - People who ever had cancer or malignancy (%)
Mental Health - People who have little interest in doing things (%)
Mental Health - People feeling down, depressed, or hopeless (%)
Mental Health - People who have trouble sleeping or sleeping too much (%)
Mental Health - People feeling tired or having little energy (%)
Mental Health - People with poor appetite or overeating (%)
Mental Health - People feeling bad about themself (%)
Mental Health - People who have trouble concentrating on things (%)
Mental Health - People moving or speaking slowly or too fast (%)
Mental Health - People having thoughts they would be better off dead (%)
Oral Health - Average years since last visit a dentist
Oral Health - People embarrassed because of mouth (%)
Oral Health - People with gum disease (%)
Oral Health - General health of teeth and gums (%)
Oral Health - Average days a week using dental floss/device
Oral Health - Average days a week using mouthwash for dental problem
Oral Health - Average number of teeth
Pesticide Use - Households using pesticides to control insects (%)
Pesticide Use - Households using pesticides to kill weeds (%)
Physical Activity - People doing vigorous-intensity work activities (%)
Physical Activity - People doing moderate-intensity work activities (%)
Physical Activity - People walking or bicycling (%)
Physical Activity - People doing vigorous-intensity recreational activities (%)
Physical Activity - People doing moderate-intensity recreational activities (%)
Physical Activity - Average hours a day doing sedentary activities
Physical Activity - Average hours a day watching TV or videos
Physical Activity - Average hours a day using computer
Physical Functioning - People having limitations keeping them from working (%)
Physical Functioning - People limited in amount of work they can do (%)
Physical Functioning - People that need special equipment to walk (%)
Physical Functioning - People experiencing confusion/memory problems (%)
Physical Functioning - People requiring special healthcare equipment (%)
Prescription Medications - Average number of prescription medicines taking
Preventive Aspirin Use - Adults 40+ taking low-dose aspirin (%)
Reproductive Health - Vaginal deliveries (%)
Reproductive Health - Cesarean deliveries (%)
Reproductive Health - Deliveries resulted in a live birth (%)
Reproductive Health - Pregnancies resulted in a delivery (%)
Reproductive Health - Women breastfeeding newborns (%)
Reproductive Health - Women that had a hysterectomy (%)
Reproductive Health - Women that had both ovaries removed (%)
Reproductive Health - Women that have ever taken birth control pills (%)
Reproductive Health - Women taking birth control pills (%)
Reproductive Health - Women that have ever used Depo-Provera or injectables (%)
Reproductive Health - Women that have ever used female hormones (%)
Sexual Behavior - People 18+ that ever had sex (vaginal, anal, or oral) (%)
Sexual Behavior - Males 18+ that ever had vaginal sex with a woman (%)
Sexual Behavior - Males 18+ that ever performed oral sex on a woman (%)
Sexual Behavior - Males 18+ that ever had anal sex with a woman (%)
Sexual Behavior - Males 18+ that ever had any sex with a man (%)
Sexual Behavior - Females 18+ that ever had vaginal sex with a man (%)
Sexual Behavior - Females 18+ that ever performed oral sex on a man (%)
Sexual Behavior - Females 18+ that ever had anal sex with a man (%)
Sexual Behavior - Females 18+ that ever had any kind of sex with a woman (%)
Sexual Behavior - Average age people first had sex
Sexual Behavior - Average number of female sex partners in lifetime (males 18+)
Sexual Behavior - Average number of female vaginal sex partners in lifetime (males 18+)
Sexual Behavior - Average age people first performed oral sex on a woman (18+)
Sexual Behavior - Average number of woman performed oral sex on in lifetime (18+)
Sexual Behavior - Average number of male sex partners in lifetime (males 18+)
Sexual Behavior - Average number of male anal sex partners in lifetime (males 18+)
Sexual Behavior - Average age people first performed oral sex on a man (18+)
Sexual Behavior - Average number of male oral sex partners in lifetime (18+)
Sexual Behavior - People using protection when performing oral sex (%)
Sexual Behavior - Average number of times people have vaginal or anal sex a year
Sexual Behavior - People having sex without condom (%)
Sexual Behavior - Average number of male sex partners in lifetime (females 18+)
Sexual Behavior - Average number of male vaginal sex partners in lifetime (females 18+)
Sexual Behavior - Average number of female sex partners in lifetime (females 18+)
Sexual Behavior - Circumcised males 18+ (%)
Sleep Disorders - Average hours sleeping at night
Sleep Disorders - People that has trouble sleeping (%)
Smoking-Cigarette Use - People smoking cigarettes (%)
Taste & Smell - People 40+ having problems with smell (%)
Taste & Smell - People 40+ having problems with taste (%)
Taste & Smell - People 40+ that ever had wisdom teeth removed (%)
Taste & Smell - People 40+ that ever had tonsils teeth removed (%)
Taste & Smell - People 40+ that ever had a loss of consciousness because of a head injury (%)
Taste & Smell - People 40+ that ever had a broken nose or other serious injury to face or skull (%)
Taste & Smell - People 40+ that ever had two or more sinus infections (%)
Weight - Average height (inches)
Weight - Average weight (pounds)
Weight - Average BMI
Weight - People that are obese (%)
Weight - People that ever were obese (%)
Weight - People trying to lose weight (%)
34,820 74.4% Hispanic 8,753 18.7% White alone 1,304 2.8% Two or more races 986 2.1% Black alone 942 2.0% Asian alone 167 0.4% Native Hawaiian and Other 117 0.2% American Indian alone 45 0.10% Other race alone
Officers per 1,000 residents here:
1.07California average:
2.30
Latest news from Los Banos, CA collected exclusively by city-data.com from local newspapers, TV, and radio stations
Ancestries: Portuguese (2.7%), American (2.2%), German (1.4%), Irish (1.1%).
Current Local Time:
Land area: 8.04 square miles.
Population density: 5,853 people per square mile (average).
12,209 residents are foreign born (23.7% Latin America ).
This city:
26.1%California:
26.5%
Median real estate property taxes paid for housing units with mortgages in 2022: $3,844 (0.9%)Median real estate property taxes paid for housing units with no mortgage in 2022: $1,901 (0.5%)
Nearest city with pop. 50,000+: Merced, CA
Nearest city with pop. 200,000+: San Jose, CA
Nearest city with pop. 1,000,000+: Los Angeles, CA
Nearest cities:
Latitude: 37.06 N, Longitude: 120.84 W
Daytime population change due to commuting: -9,386 (-20.1%)Workers who live and work in this city: 5,885 (33.8%)
Single-family new house construction building permits:
2022: 94 buildings , average cost: $310,4002021: 114 buildings , average cost: $498,5002020: 104 buildings , average cost: $498,5002019: 95 buildings , average cost: $498,5002018: 284 buildings , average cost: $219,3002017: 270 buildings , average cost: $219,3002016: 329 buildings , average cost: $144,1002015: 39 buildings , average cost: $198,1002014: 32 buildings , average cost: $198,1002013: 17 buildings , average cost: $298,9002010: 5 buildings , average cost: $214,4002009: 14 buildings , average cost: $208,9002008: 99 buildings , average cost: $214,4002007: 119 buildings , average cost: $232,0002006: 367 buildings , average cost: $172,3002005: 690 buildings , average cost: $158,6002004: 667 buildings , average cost: $169,7002003: 509 buildings , average cost: $146,0002002: 349 buildings , average cost: $147,3002001: 234 buildings , average cost: $162,6002000: 537 buildings , average cost: $138,9001999: 410 buildings , average cost: $125,4001998: 369 buildings , average cost: $115,0001997: 281 buildings , average cost: $124,800Unemployment in December 2023: Here:
13.0%California:
5.1%
Population change in the 1990s: +10,948 (+73.4%).
Most common occupations in Los Banos, CA (%)
Both Males Females
Agricultural workers, including supervisors (5.4%)
Driver/sales workers and truck drivers (4.6%)
Electrical equipment mechanics and other installation, maintenance, and repair workers, including supervisors (4.1%)
Other management occupations, except farmers and farm managers (4.0%)
Building and grounds cleaning and maintenance occupations (4.0%)
Other production occupations, including supervisors (3.6%)
Other sales and related occupations, including supervisors (3.6%)
Agricultural workers, including supervisors (8.1%)
Driver/sales workers and truck drivers (7.5%)
Electrical equipment mechanics and other installation, maintenance, and repair workers, including supervisors (6.0%)
Building and grounds cleaning and maintenance occupations (4.5%)
Other production occupations, including supervisors (4.0%)
Vehicle and mobile equipment mechanics, installers, and repairers (3.9%)
Other sales and related occupations, including supervisors (3.8%)
Secretaries and administrative assistants (6.2%)
Other office and administrative support workers, including supervisors (5.2%)
Preschool, kindergarten, elementary, and middle school teachers (4.7%)
Other management occupations, except farmers and farm managers (4.5%)
Cooks and food preparation workers (3.7%)
Bookkeeping, accounting, and auditing clerks (3.7%)
Retail sales workers, except cashiers (3.6%)
Earthquake activity:
Los Banos-area historical earthquake activity is significantly above California state average. It is 8224% greater than the overall U.S. average. On 4/18/1906 at 13:12:21, a magnitude 7.9 (7.9 UK, Class: Major, Intensity: VIII - XII) earthquake occurred 134.9 miles away from the city center, causing $524,000,000 total damage On 7/21/1952 at 11:52:14, a magnitude 7.7 (7.7 UK) earthquake occurred 176.0 miles away from Los Banos center, causing $50,000,000 total damage On 11/4/1927 at 13:51:53, a magnitude 7.5 (7.5 UK) earthquake occurred 148.9 miles away from Los Banos center On 10/18/1989 at 00:04:15, a magnitude 7.1 (6.5 MB, 7.1 MS, 6.9 MW, 7.0 ML) earthquake occurred 51.2 miles away from Los Banos center, causing 62 deaths ( 62 shaking deaths) and 3757 injuries, causing $1,305,032,704 total damage On 12/21/1932 at 06:10:09, a magnitude 7.2 (7.2 UK) earthquake occurred 181.1 miles away from Los Banos center On 5/2/1983 at 23:42:37, a magnitude 6.7 (6.2 MB, 6.5 MS, 6.5 MW, 6.7 ML, Class: Strong, Intensity: VII - IX) earthquake occurred 65.6 miles away from the city center, causing $31,000,000 total damage Magnitude types: body-wave magnitude (MB), local magnitude (ML), surface-wave magnitude (MS), moment magnitude (MW) Natural disasters: The number of natural disasters in Merced County (13) is near the US average (15).Major Disasters (Presidential) Declared: 8Emergencies Declared: 2Floods: 8, Storms: 4, Winter Storms: 4, Mudslides: 3, Freezes: 2, Landslides: 2, Drought: 1, Hurricane: 1, Tornado: 1, Other: 1 (Note: some incidents may be assigned to more than one category). Hospitals and medical centers in Los Banos: MEMORIAL HOSPITAL LOS BANOS (Voluntary non-profit - Private, 520 WEST I ST) LOS BANOS NURSING AND REHABILITA (931 IDAHO AVE.)
NEW BETHANY SKILLED NURSING (1441 BERKELEY DR)
LOS BANOS DIALYSIS CENTER (60 G STREET, BUILDING D)
Airports located in Los Banos: Colleges/universities with over 2000 students nearest to Los Banos:
Merced College (about 28 miles; Merced, CA ; Full-time enrollment: 6,973)
University of California-Merced (about 32 miles; Merced, CA ; FT enrollment: 5,981)
California State University-Stanislaus (about 33 miles; Turlock, CA ; FT enrollment: 7,054)
Gavilan College (about 41 miles; Gilroy, CA ; FT enrollment: 3,327)
Modesto Junior College (about 42 miles; Modesto, CA ; FT enrollment: 10,635)
Hartnell College (about 53 miles; Salinas, CA ; FT enrollment: 5,506)
Evergreen Valley College (about 54 miles; San Jose, CA ; FT enrollment: 5,539)
Public high schools in Los Banos: LOS BANOS HIGH Students: 1,601, Location: 1966 11TH ST., Grades: 9-12)SAN LUIS HIGH (CONTINUATION) Students: 48, Location: 125 SEVENTH ST., Grades: 9-12)CROSSROADS ALTERNATIVE EDUCATION CENTER Students: 37, Location: 265 MERCY SPRINGS RD., STE. C, Grades: KG-12)PACHECO HIGH Location: 200 N. WARD RD., Grades: 9-12)VALLEY LOS BANOS COMMUNITY Location: 715 W. H ST., Grades: 6-12)
Biggest public elementary/middle schools in Los Banos: LOS BANOS JUNIOR HIGH Students: 1,267, Location: 1750 SAN LUIS ST., Grades: 7-8)LOS BANOS ELEMENTARY Students: 641, Location: 1260 SEVENTH ST., Grades: KG-6)R. M. MIANO ELEMENTARY Students: 589, Location: 1129 B ST., Grades: KG-6)HENRY MILLER ELEMENTARY Students: 568, Location: 545 W. L ST., Grades: KG-6)LORENA FALASCO ELEMENTARY Students: 554, Location: 310 OVERLAND AVE., Grades: KG-6)WESTSIDE UNION ELEMENTARY Students: 332, Location: 659 K ST., Grades: KG-6)CHARLESTON ELEMENTARY Students: 290, Location: 18463 W. CHARLESTON RD., Grades: KG-6)VOLTA ELEMENTARY Students: 220, Location: 24307 W. INGOMAR GRADE, Grades: KG-6)MERCEY SPRINGS ELEMENTARY Students: 55, Location: 1900 S. MERCEY SPRINGS RD, Grades: KG-6)GREEN VALLEY CHARTER Location: 1149 E. B ST., Grades: KG-8, Charter school )
Private elementary/middle schools in Los Banos: OUR LADY OF FATIMA SCHOOL Students: 195, Location: 1625 CENTER AVE, Grades: PK-8)
LOS BANOS ADVENTIST SCHOOL Students: 33, Location: 404 OVERLAND RD, Grades: KG-8)
See full list of schools located in Los Banos
Notable locations in Los Banos: (A) , Milken Museum (B) , Los Banos City Hall (C) , Los Banos Branch Merced County Library (D) , Merced County Fire Department Station 71 Los Banos (E) , Los Banos Fire Department Station 2 (F) , Los Banos Fire Department Station 1 (G) . Display/hide their locations on the map
Shopping Centers: (1) , National Shopping Center (2) , Canal Farm Shopping Center (3) . Display/hide their locations on the map
Parks in Los Banos include: (1) , Canal Farm State Historic Landmark (2) , Los Banos Fairgrounds Park (3) , Page Park (4) . Display/hide their locations on the map
Tourist attraction:
Hotels:
Court:
Birthplace of: Tony Coelho - Politician, Lance Mitchell - 2005 NFL player (Arizona Cardinals, born : Oct 9, 1981).
Merced County has a predicted average indoor radon screening level less than 2 pCi/L (pico curies per liter) - Low Potential Average household size: This city:
3.5 peopleCalifornia:
2.9 people
Percentage of family households: This city:
81.2%Whole state:
68.7%
Percentage of households with unmarried partners: This city:
8.5%Whole state:
7.2%
Likely homosexual households (counted as self-reported same-sex unmarried-partner households)
Lesbian couples: 0.4% of all households Gay men: 0.3% of all households
People in group quarters in Los Banos in 2010:
78 people in nursing facilities/skilled-nursing facilities
68 people in other noninstitutional facilities
23 people in residential treatment centers for adults
12 people in workers' group living quarters and job corps centers
People in group quarters in Los Banos in 2000:
149 people in nursing homes
16 people in agriculture workers' dormitories on farms
10 people in other noninstitutional group quarters
Banks with branches in Los Banos (2011 data):
Bank of America, National Association: Los Banos Branch at 556 I Street, branch established on 1921/07/05. Info updated 2009/11/18: Bank assets: $1,451,969.3 mil, Deposits: $1,077,176.8 mil, headquarters in Charlotte, NC, positive income , 5782 total offices , Holding Company: Bank Of America Corporation
JPMorgan Chase Bank, National Association: Los Banos Branch at 550 K Street, branch established on 1963/05/01. Info updated 2011/11/10: Bank assets: $1,811,678.0 mil, Deposits: $1,190,738.0 mil, headquarters in Columbus, OH, positive income , International Specialization, 5577 total offices , Holding Company: Jpmorgan Chase & Co.
Westamerica Bank: Los Banos Branch at 953 West Pacheco Boulevard, branch established on 1994/11/28. Info updated 2011/06/21: Bank assets: $4,998.1 mil, Deposits: $4,253.2 mil, headquarters in San Rafael, CA, positive income , Commercial Lending Specialization, 98 total offices , Holding Company: Westamerica Bancorporation
Rabobank, National Association: Los Banos Branch at 1451 West Pacheco Blvd., Suite H, branch established on 2009/06/29. Info updated 2011/01/27: Bank assets: $11,745.0 mil, Deposits: $8,446.0 mil, headquarters in Roseville, CA, positive income , Agricultural Specialization, 124 total offices , Holding Company: Cooperatieve Centrale Raiffeisen-Boerenleenbank B.A., "rabobank Nederland
Wells Fargo Bank, National Association: Los Banos Branch at 461 J Street, branch established on 1921/05/04. Info updated 2011/04/05: Bank assets: $1,161,490.0 mil, Deposits: $905,653.0 mil, headquarters in Sioux Falls, SD, positive income , 6395 total offices , Holding Company: Wells Fargo & Company
For population 15 years and over in Los Banos:
Never married: 39.7%Now married: 49.8%Separated: 1.3%Widowed: 3.4%Divorced: 5.9% For population 25 years and over in Los Banos:
High school or higher: 71.5%Bachelor's degree or higher: 12.0%Graduate or professional degree: 2.9%Unemployed: 13.5%Mean travel time to work (commute): 43.7 minutes
Education Gini index (Inequality in education) Here:
16.6California average:
15.5
Religion statistics for Los Banos, CA (based on Merced County data)
Religion Adherents Congregations Catholic 102,005 18 Evangelical Protestant 26,640 124 Other 5,884 23 Mainline Protestant 3,673 18 Black Protestant 1,087 8 Orthodox 64 1 None 116,440 -
Source: Clifford Grammich, Kirk Hadaway, Richard Houseal, Dale E.Jones, Alexei Krindatch, Richie Stanley and Richard H.Taylor. 2012. 2010 U.S.Religion Census: Religious Congregations & Membership Study. Association of Statisticians of American Religious Bodies. Jones, Dale E., et al. 2002. Congregations and Membership in the United States 2000. Nashville, TN: Glenmary Research Center. Graphs represent county-level data
Food Environment Statistics: Number of grocery stores : 58This county :
2.37 / 10,000 pop.California :
2.14 / 10,000 pop.
Number of supercenters and club stores : 1Here :
0.04 / 10,000 pop.California :
0.04 / 10,000 pop.
Number of convenience stores (no gas) : 26Here :
1.06 / 10,000 pop.California :
0.62 / 10,000 pop.
Number of convenience stores (with gas) : 53Here :
2.17 / 10,000 pop.California :
1.49 / 10,000 pop.
Number of full-service restaurants : 100Merced County :
4.09 / 10,000 pop.California :
7.42 / 10,000 pop.
Adult diabetes rate : Merced County :
6.9%California :
7.3%
Adult obesity rate : This county :
29.5%State :
21.3%
Low-income preschool obesity rate : This county :
17.8%California :
17.9%
Health and Nutrition: Healthy diet rate : Here:
46.7%California:
49.4%
Average overall health of teeth and gums : This city:
45.0%California:
48.0%
Average BMI : Los Banos:
28.7California:
28.1
People feeling badly about themselves : Los Banos:
22.8%State:
20.2%
People not drinking alcohol at all : Los Banos:
11.0%State:
11.2%
Average hours sleeping at night : Overweight people : This city:
32.6%California:
31.5%
General health condition : Los Banos:
53.7%California:
56.4%
Average condition of hearing : Los Banos:
80.3%California:
80.9%
More about Health and Nutrition of Los Banos, CA Residents
Local government employment and payroll (March 2022)
Function
Full-time employees
Monthly full-time payroll
Average yearly full-time wage
Part-time employees
Monthly part-time payroll
Police Protection - Officers
42 $340,470 $97,277 0 $0 Police - Other
22 $115,983 $63,263 8 $9,246 Firefighters
19 $163,195 $103,071 0 $0 Financial Administration
19 $128,761 $81,323 3 $3,845 Water Supply
14 $76,619 $65,673 2 $5,636 Streets and Highways
11 $54,245 $59,176 2 $4,973 Parks and Recreation
9 $52,517 $70,023 21 $24,233 Other and Unallocable
7 $71,678 $122,877 2 $2,759 Solid Waste Management
5 $25,971 $62,330 3 $6,842 Sewerage
4 $31,455 $94,365 0 $0 Fire - Other
3 $17,861 $71,444 0 $0 Housing and Community Development (Local)
2 $24,955 $149,730 0 $0 Airports
0 $0 1 $564
Totals for Government
157 $1,103,710 $84,360 42 $58,098
Los Banos government finances - Expenditure in 2017 (per resident):
Construction - Parks and Recreation: $2,049,000 ($43.55)
Regular Highways: $1,613,000 ($34.29)Housing and Community Development: $558,000 ($11.86)Police Protection: $212,000 ($4.51)Current Operations - Police Protection: $8,037,000 ($170.84)
Solid Waste Management: $6,206,000 ($131.92)Local Fire Protection: $3,890,000 ($82.69)Water Utilities: $3,347,000 ($71.15)Parks and Recreation: $3,343,000 ($71.06)Sewerage: $3,071,000 ($65.28)Regular Highways: $1,660,000 ($35.29)Central Staff Services: $1,601,000 ($34.03)Air Transportation: $236,000 ($5.02)Housing and Community Development: $97,000 ($2.06)Protective Inspection and Regulation - Other: $55,000 ($1.17)General - Other: $18,000 ($0.38)Health - Other: $9,000 ($0.19)General - Interest on Debt: $140,000 ($2.98)
Other Capital Outlay - Sewerage: $1,068,000 ($22.70)
Water Utilities: $975,000 ($20.73)General - Other: $162,000 ($3.44)Local Fire Protection: $132,000 ($2.81)General Public Building: $28,000 ($0.60)
Los Banos government finances - Revenue in 2017 (per resident):
Charges - Solid Waste Management: $7,374,000 ($156.75)
Sewerage: $6,920,000 ($147.10)Other: $3,707,000 ($78.80)Air Transportation: $296,000 ($6.29)Parks and Recreation: $189,000 ($4.02)Federal Intergovernmental - Other: $179,000 ($3.80)
Housing and Community Development: $108,000 ($2.30)Local Intergovernmental - Other: $3,000 ($0.06)
Miscellaneous - Rents: $1,025,000 ($21.79)
Interest Earnings: $861,000 ($18.30)General Revenue - Other: $710,000 ($15.09)Fines and Forfeits: $228,000 ($4.85)Sale of Property: $20,000 ($0.43)Donations From Private Sources: $5,000 ($0.11)Revenue - Water Utilities: $6,351,000 ($135.00)
State Intergovernmental - Other: $1,352,000 ($28.74)
Highways: $730,000 ($15.52)General Local Government Support: $29,000 ($0.62)Tax - Other: $6,760,000 ($143.70)
Property: $5,676,000 ($120.65)General Sales and Gross Receipts: $3,876,000 ($82.39)Other License: $1,071,000 ($22.77)Public Utilities Sales: $524,000 ($11.14)Other Selective Sales: $446,000 ($9.48)Documentary and Stock Transfer: $149,000 ($3.17)Occupation and Business License - Other: $134,000 ($2.85)
Los Banos government finances - Debt in 2017 (per resident):
Long Term Debt - Beginning Outstanding - Unspecified Public Purpose: $2,528,000 ($53.74)
Outstanding Unspecified Public Purpose: $2,024,000 ($43.02)Retired Unspecified Public Purpose: $504,000 ($10.71)
Los Banos government finances - Cash and Securities in 2017 (per resident):
Bond Funds - Cash and Securities: $146,000 ($3.10)
Other Funds - Cash and Securities: $77,261,000 ($1642.31)
Businesses in Los Banos, CA
Name Count Name Count
7-Eleven 1 KFC 1 AT&T 1 Kmart 1 AutoZone 1 Little Caesars Pizza 1 Baskin-Robbins 1 Lowe's 1 Best Western 1 McDonald's 3 Big O Tires 1 Nike 2 Burger King 1 Panda Express 1 Carl\s Jr. 2 Payless 1 Circle K 3 Penske 1 Cricket Wireless 2 Pizza Hut 1 Dairy Queen 1 Quiznos 1 Days Inn 1 RadioShack 1 Dennys 1 Rite Aid 1 Domino's Pizza 1 Rue21 1 Famous Footwear 1 Sprint Nextel 1 Fashion Bug 1 Starbucks 3 FedEx 3 T-Mobile 2 Ford 1 Taco Bell 2 GNC 2 Target 1 GameStop 1 True Value 1 H&R Block 1 U-Haul 2 Home Depot 1 UPS 2 JCPenney 1 Vans 3 Jamba Juice 1 Walgreens 1 Jones New York 2 Walmart 1
Strongest AM radio stations in Los Banos:
KLBS (1330 AM; 5 kW; LOS BANOS, CA; Owner: ETHNIC RADIO OF LOS BANOS, INC.)
KCBC (770 AM; 50 kW; RIVERBANK, CA; Owner: KIERTRON, INC.)
KTIQ (1660 AM; 10 kW; MERCED, CA; Owner: MAPLETON COMMUNICATIONS, LLC)
KLOK (1170 AM; 50 kW; SAN JOSE, CA; Owner: ENTRAVISION HOLDINGS, LLC)
KMJ (580 AM; 50 kW; FRESNO, CA; Owner: INFINITY RADIO OPERATIONS INC.)
KGO (810 AM; 50 kW; SAN FRANCISCO, CA; Owner: KGO-AM RADIO, INC.)
KNBR (680 AM; 50 kW; SAN FRANCISCO, CA; Owner: KNBR LICO, INC.)
KYAA (1200 AM; 25 kW; SOQUEL, CA; Owner: PEOPLE'S RADIO, INC.)
KVVY (1580 AM; 10 kW; MERCED, CA; Owner: MAPLETON COMMUNICATIONS, LLC)
KSRK (540 AM; 10 kW; CARMEL VALLEY, CA; Owner: PEOPLE'S RADIO, INC.)
KTCT (1050 AM; 50 kW; SAN MATEO, CA; Owner: SUSQUEHANNA RADIO CORP.)
KFAX (1100 AM; 50 kW; SAN FRANCISCO, CA; Owner: GOLDEN GATE BROADCASTING CO, INC.)
KTRB (860 AM; 50 kW; MODESTO, CA; Owner: PAPPAS RADIO OF CALIFORNIA, A CALIFORNIA LIMITED PARTNERSHIP)
Strongest FM radio stations in Los Banos:
KQLB (106.9 FM; LOS BANOS, CA; Owner: VLB BROADCASTING, INC.)
KSKD (95.9 FM; LIVINGSTON, CA; Owner: KSKD, INC)
KHTN (104.7 FM; LOS BANOS, CA; Owner: BUCKLEY COMMUNICATIONS, INC.)
K238AC (95.5 FM; SALIDA, CA; Owner: FAMILY STATIONS, INC.)
K211DG (90.1 FM; FIREBAUGH, CA; Owner: CALVARY CHAPEL OF TWIN FALLS, INC.)
KHRI (90.7 FM; HOLLISTER, CA; Owner: EDUCATIONAL MEDIA FOUNDATION)
KDON-FM (102.5 FM; SALINAS, CA; Owner: CLEAR CHANNEL BROADCASTING LICENSES, INC.)
K202DU (88.3 FM; SAN JUAN BAUTISTA, CA; Owner: CALVARY CHAPEL OF TWIN FALLS, INC.)
KBTU (93.5 FM; HOLLISTER, CA; Owner: MAPLETON COMMUNICATIONS, L.L.C.)
KLVM (89.7 FM; PRUNEDALE, CA; Owner: PRUNEDALE EDUCATIONAL ASSOCIATION)
KUOP (91.3 FM; STOCKTON, CA; Owner: UNIVERSITY OF THE PACIFIC)
K265DG (100.9 FM; HOLLISTER, CA; Owner: CLEAR CHANNEL BROADCASTING LICENSES, INC.)
KBAA (94.5 FM; GILROY, CA; Owner: INFINITY RADIO OPERATIONS INC.)
K206BQ (89.1 FM; HOLLISTER, CA; Owner: PATAPHYSICAL BROADCASTING FOUNDATION, INC.)
KDKL (88.3 FM; COALINGA, CA; Owner: EDUCATIONAL MEDIA FOUNDATION)
KSQL (99.1 FM; SANTA CRUZ, CA; Owner: TMS LICENSE CALIFORNIA, INC)
KAMB (101.5 FM; MERCED, CA; Owner: CENTRAL VALLEY BROADCASTING CO. INC.)
KKUP (91.5 FM; CUPERTINO, CA; Owner: ASSURANCE SCIENCES FOUNDATION)
KBRG (100.3 FM; SAN JOSE, CA; Owner: ENTRAVISION HOLDINGS, LLC)
K260AA (99.9 FM; CARMEL VALLEY, CA; Owner: ENTRAVISION HOLDINGS, LLC)
National Bridge Inventory (NBI) Statistics 39 Number of bridges384ft / 117m Total length $3,030,000 Total costs225,802 Total average daily traffic34,290 Total average daily truck traffic
New bridges - historical statistics
3 1920-1929 1 1940-1949 7 1950-1959 15 1960-1969 11 1970-1979 2 1980-1989
See full National Bridge Inventory statistics for Los Banos, CA
Home Mortgage Disclosure Act Aggregated Statistics For Year 2009(Based on 5 partial tracts) A) FHA, FSA/RHS & VA B) Conventional C) Refinancings D) Home Improvement Loans F) Non-occupant Loans on G) Loans On Manufactured Number Average Value Number Average Value Number Average Value Number Average Value Number Average Value Number Average Value
LOANS ORIGINATED 174 $129,596 123 $97,401 52 $167,681 3 $78,300 62 $84,423 0 $0 APPLICATIONS APPROVED, NOT ACCEPTED 14 $144,894 12 $115,088 9 $155,053 1 $37,360 8 $105,470 0 $0 APPLICATIONS DENIED 40 $131,718 30 $107,445 59 $174,412 11 $53,742 22 $89,073 1 $104,600 APPLICATIONS WITHDRAWN 25 $131,421 19 $107,191 23 $194,214 4 $67,472 9 $93,346 0 $0 FILES CLOSED FOR INCOMPLETENESS 6 $134,085 5 $106,282 8 $180,089 0 $0 3 $130,673 0 $0
Aggregated Statistics For Year 2008(Based on 5 partial tracts) A) FHA, FSA/RHS & VA B) Conventional C) Refinancings D) Home Improvement Loans E) Loans on Dwellings For 5+ Families F) Non-occupant Loans on G) Loans On Manufactured Number Average Value Number Average Value Number Average Value Number Average Value Number Average Value Number Average Value Number Average Value
LOANS ORIGINATED 133 $176,928 174 $144,342 45 $191,641 11 $52,411 0 $0 66 $107,184 0 $0 APPLICATIONS APPROVED, NOT ACCEPTED 8 $165,681 36 $192,938 29 $201,594 3 $26,380 0 $0 9 $171,869 0 $0 APPLICATIONS DENIED 36 $177,533 78 $183,103 124 $249,327 23 $84,652 1 $311,110 34 $146,534 1 $64,660 APPLICATIONS WITHDRAWN 20 $186,365 37 $160,212 43 $232,588 3 $131,023 0 $0 18 $154,714 0 $0 FILES CLOSED FOR INCOMPLETENESS 3 $162,220 13 $208,015 9 $182,514 1 $73,820 0 $0 3 $138,537 0 $0
Aggregated Statistics For Year 2007(Based on 5 partial tracts) A) FHA, FSA/RHS & VA B) Conventional C) Refinancings D) Home Improvement Loans E) Loans on Dwellings For 5+ Families F) Non-occupant Loans on G) Loans On Manufactured Number Average Value Number Average Value Number Average Value Number Average Value Number Average Value Number Average Value Number Average Value
LOANS ORIGINATED 7 $285,027 196 $233,129 327 $264,663 42 $152,240 3 $778,933 73 $231,975 1 $50,900 APPLICATIONS APPROVED, NOT ACCEPTED 0 $0 58 $227,900 115 $278,646 11 $194,696 0 $0 14 $224,595 0 $0 APPLICATIONS DENIED 5 $250,900 144 $245,970 379 $302,411 59 $163,919 0 $0 48 $278,459 1 $64,120 APPLICATIONS WITHDRAWN 2 $239,600 58 $252,449 127 $307,234 13 $115,024 0 $0 13 $267,325 0 $0 FILES CLOSED FOR INCOMPLETENESS 0 $0 11 $283,359 54 $292,965 4 $239,488 0 $0 6 $290,032 0 $0
Aggregated Statistics For Year 2006(Based on 5 partial tracts) B) Conventional C) Refinancings D) Home Improvement Loans E) Loans on Dwellings For 5+ Families F) Non-occupant Loans on G) Loans On Manufactured Number Average Value Number Average Value Number Average Value Number Average Value Number Average Value Number Average Value
LOANS ORIGINATED 543 $240,867 717 $284,259 113 $190,174 2 $743,210 149 $248,109 1 $37,160 APPLICATIONS APPROVED, NOT ACCEPTED 128 $246,992 183 $283,701 28 $137,041 0 $0 34 $269,956 1 $96,200 APPLICATIONS DENIED 252 $244,297 463 $305,702 75 $140,785 0 $0 76 $260,213 1 $544,270 APPLICATIONS WITHDRAWN 104 $240,528 249 $294,330 27 $241,822 0 $0 28 $256,318 0 $0 FILES CLOSED FOR INCOMPLETENESS 14 $264,336 62 $299,129 7 $161,374 0 $0 9 $278,488 0 $0
Aggregated Statistics For Year 2005(Based on 5 partial tracts) B) Conventional C) Refinancings D) Home Improvement Loans E) Loans on Dwellings For 5+ Families F) Non-occupant Loans on G) Loans On Manufactured Number Average Value Number Average Value Number Average Value Number Average Value Number Average Value Number Average Value
LOANS ORIGINATED 863 $237,934 887 $266,938 113 $202,042 1 $311,110 193 $251,688 2 $157,110 APPLICATIONS APPROVED, NOT ACCEPTED 196 $233,725 164 $261,245 15 $148,517 1 $143,030 25 $254,313 2 $90,735 APPLICATIONS DENIED 315 $244,449 392 $282,669 84 $126,240 0 $0 64 $266,384 4 $107,565 APPLICATIONS WITHDRAWN 156 $252,515 304 $264,673 37 $190,910 0 $0 34 $255,604 2 $146,265 FILES CLOSED FOR INCOMPLETENESS 50 $265,453 101 $267,139 3 $108,203 0 $0 20 $312,647 0 $0
Aggregated Statistics For Year 2004(Based on 5 partial tracts) A) FHA, FSA/RHS & VA B) Conventional C) Refinancings D) Home Improvement Loans E) Loans on Dwellings For 5+ Families F) Non-occupant Loans on G) Loans On Manufactured Number Average Value Number Average Value Number Average Value Number Average Value Number Average Value Number Average Value Number Average Value
LOANS ORIGINATED 1 $140,610 677 $195,598 699 $202,319 49 $135,080 4 $715,125 136 $180,451 1 $24,910 APPLICATIONS APPROVED, NOT ACCEPTED 0 $0 181 $188,586 162 $214,875 10 $102,971 0 $0 22 $206,420 1 $26,940 APPLICATIONS DENIED 1 $156,030 177 $191,892 423 $204,792 58 $103,948 1 $276,540 41 $192,990 4 $63,040 APPLICATIONS WITHDRAWN 1 $123,580 153 $233,745 275 $198,463 18 $112,699 0 $0 21 $175,096 1 $21,780 FILES CLOSED FOR INCOMPLETENESS 0 $0 25 $191,153 92 $196,819 7 $62,494 0 $0 13 $180,628 0 $0
Aggregated Statistics For Year 2003(Based on 5 partial tracts) A) FHA, FSA/RHS & VA B) Conventional C) Refinancings D) Home Improvement Loans E) Loans on Dwellings For 5+ Families F) Non-occupant Loans on Number Average Value Number Average Value Number Average Value Number Average Value Number Average Value Number Average Value
LOANS ORIGINATED 9 $191,056 436 $160,375 772 $154,899 35 $54,528 1 $299,880 124 $137,194 APPLICATIONS APPROVED, NOT ACCEPTED 0 $0 65 $166,354 169 $166,725 11 $64,133 1 $26,000 18 $167,129 APPLICATIONS DENIED 2 $166,130 110 $147,407 409 $171,875 29 $41,138 1 $1,123,460 41 $140,681 APPLICATIONS WITHDRAWN 4 $106,468 73 $170,016 248 $168,517 5 $121,412 0 $0 19 $138,983 FILES CLOSED FOR INCOMPLETENESS 0 $0 6 $192,255 44 $159,522 1 $49,190 0 $0 4 $130,145
Aggregated Statistics For Year 2002(Based on 3 partial tracts) A) FHA, FSA/RHS & VA B) Conventional C) Refinancings D) Home Improvement Loans F) Non-occupant Loans on Number Average Value Number Average Value Number Average Value Number Average Value Number Average Value
LOANS ORIGINATED 5 $219,710 132 $161,921 266 $161,648 14 $34,350 24 $137,408 APPLICATIONS APPROVED, NOT ACCEPTED 2 $181,025 18 $171,766 55 $176,602 11 $27,732 2 $163,370 APPLICATIONS DENIED 0 $0 25 $151,680 136 $171,789 12 $39,356 5 $151,326 APPLICATIONS WITHDRAWN 1 $166,300 27 $175,047 106 $180,098 2 $37,385 5 $124,090 FILES CLOSED FOR INCOMPLETENESS 0 $0 10 $169,048 31 $152,726 0 $0 2 $59,850
Aggregated Statistics For Year 2001(Based on 3 partial tracts) A) FHA, FSA/RHS & VA B) Conventional C) Refinancings D) Home Improvement Loans E) Loans on Dwellings For 5+ Families F) Non-occupant Loans on Number Average Value Number Average Value Number Average Value Number Average Value Number Average Value Number Average Value
LOANS ORIGINATED 7 $184,426 164 $161,924 301 $154,971 22 $39,108 1 $148,230 25 $127,624 APPLICATIONS APPROVED, NOT ACCEPTED 0 $0 18 $155,562 37 $144,910 7 $56,970 0 $0 5 $147,564 APPLICATIONS DENIED 2 $171,255 41 $156,776 141 $139,381 18 $25,391 0 $0 5 $145,338 APPLICATIONS WITHDRAWN 1 $143,540 32 $158,904 86 $153,335 7 $55,696 0 $0 2 $168,270 FILES CLOSED FOR INCOMPLETENESS 1 $104,540 8 $162,811 28 $153,779 2 $28,550 0 $0 0 $0
Aggregated Statistics For Year 2000(Based on 3 partial tracts) A) FHA, FSA/RHS & VA B) Conventional C) Refinancings D) Home Improvement Loans F) Non-occupant Loans on Number Average Value Number Average Value Number Average Value Number Average Value Number Average Value
LOANS ORIGINATED 19 $146,529 177 $139,585 72 $109,650 20 $29,746 16 $99,081 APPLICATIONS APPROVED, NOT ACCEPTED 2 $161,695 22 $122,599 19 $117,003 18 $28,741 3 $67,333 APPLICATIONS DENIED 3 $136,777 62 $126,233 75 $100,027 23 $31,294 6 $88,983 APPLICATIONS WITHDRAWN 5 $139,732 35 $131,913 46 $92,894 3 $49,740 4 $115,445 FILES CLOSED FOR INCOMPLETENESS 0 $0 10 $169,035 17 $121,010 0 $0 1 $52,010
Aggregated Statistics For Year 1999(Based on 4 partial tracts) A) FHA, FSA/RHS & VA B) Conventional C) Refinancings D) Home Improvement Loans E) Loans on Dwellings For 5+ Families F) Non-occupant Loans on Number Average Value Number Average Value Number Average Value Number Average Value Number Average Value Number Average Value
LOANS ORIGINATED 65 $126,711 160 $113,647 162 $91,295 37 $29,693 3 $592,153 24 $77,582 APPLICATIONS APPROVED, NOT ACCEPTED 1 $200,060 23 $110,288 47 $91,076 21 $26,342 0 $0 4 $90,572 APPLICATIONS DENIED 5 $120,046 51 $116,813 163 $76,877 48 $28,414 0 $0 13 $79,148 APPLICATIONS WITHDRAWN 11 $127,018 31 $131,944 97 $94,741 2 $22,115 1 $72,890 5 $92,830 FILES CLOSED FOR INCOMPLETENESS 0 $0 6 $115,647 26 $99,792 1 $46,000 0 $0 2 $63,240
Detailed HMDA statistics for the following Tracts:
0022.01
, 0022.02 , 0023.01 , 0023.02
Private Mortgage Insurance Companies Aggregated Statistics For Year 2009(Based on 5 partial tracts) A) Conventional B) Refinancings C) Non-occupant Loans on Number Average Value Number Average Value Number Average Value
LOANS ORIGINATED 15 $135,193 0 $0 0 $0 APPLICATIONS APPROVED, NOT ACCEPTED 5 $183,452 1 $185,640 0 $0 APPLICATIONS DENIED 5 $153,074 0 $0 0 $0 APPLICATIONS WITHDRAWN 0 $0 0 $0 0 $0 FILES CLOSED FOR INCOMPLETENESS 2 $168,095 0 $0 1 $155,080
Aggregated Statistics For Year 2008(Based on 5 partial tracts) A) Conventional B) Refinancings C) Non-occupant Loans on Number Average Value Number Average Value Number Average Value
LOANS ORIGINATED 65 $198,838 5 $313,108 6 $174,135 APPLICATIONS APPROVED, NOT ACCEPTED 37 $246,722 7 $334,267 4 $271,740 APPLICATIONS DENIED 14 $191,892 1 $354,050 4 $199,808 APPLICATIONS WITHDRAWN 8 $173,625 1 $389,990 0 $0 FILES CLOSED FOR INCOMPLETENESS 6 $242,155 0 $0 0 $0
Aggregated Statistics For Year 2007(Based on 5 partial tracts) A) Conventional B) Refinancings C) Non-occupant Loans on Number Average Value Number Average Value Number Average Value
LOANS ORIGINATED 33 $313,645 22 $353,921 3 $295,500 APPLICATIONS APPROVED, NOT ACCEPTED 4 $311,078 9 $371,710 0 $0 APPLICATIONS DENIED 2 $351,545 1 $383,910 0 $0 APPLICATIONS WITHDRAWN 5 $305,962 2 $287,870 1 $176,490 FILES CLOSED FOR INCOMPLETENESS 0 $0 1 $306,490 0 $0
Aggregated Statistics For Year 2006(Based on 5 partial tracts) A) Conventional B) Refinancings Number Average Value Number Average Value
LOANS ORIGINATED 6 $359,757 7 $414,126 APPLICATIONS APPROVED, NOT ACCEPTED 0 $0 2 $373,385 APPLICATIONS DENIED 1 $318,880 1 $241,880 APPLICATIONS WITHDRAWN 0 $0 1 $579,170 FILES CLOSED FOR INCOMPLETENESS 0 $0 0 $0
Aggregated Statistics For Year 2005(Based on 5 partial tracts) A) Conventional B) Refinancings C) Non-occupant Loans on Number Average Value Number Average Value Number Average Value
LOANS ORIGINATED 12 $350,843 16 $322,682 1 $160,170 APPLICATIONS APPROVED, NOT ACCEPTED 3 $345,103 3 $305,260 2 $171,975 APPLICATIONS DENIED 2 $242,590 0 $0 0 $0 APPLICATIONS WITHDRAWN 1 $204,920 2 $353,930 0 $0 FILES CLOSED FOR INCOMPLETENESS 0 $0 0 $0 0 $0
Aggregated Statistics For Year 2004(Based on 5 partial tracts) A) Conventional B) Refinancings C) Non-occupant Loans on Number Average Value Number Average Value Number Average Value
LOANS ORIGINATED 36 $262,073 32 $229,160 6 $224,920 APPLICATIONS APPROVED, NOT ACCEPTED 10 $259,151 13 $206,473 2 $175,170 APPLICATIONS DENIED 0 $0 2 $205,820 0 $0 APPLICATIONS WITHDRAWN 1 $254,070 2 $151,315 0 $0 FILES CLOSED FOR INCOMPLETENESS 3 $235,927 0 $0 0 $0
Aggregated Statistics For Year 2003(Based on 5 partial tracts) A) Conventional B) Refinancings C) Non-occupant Loans on Number Average Value Number Average Value Number Average Value
LOANS ORIGINATED 65 $212,234 47 $198,151 10 $176,046 APPLICATIONS APPROVED, NOT ACCEPTED 11 $221,241 15 $203,663 1 $102,300 APPLICATIONS DENIED 3 $188,293 3 $181,037 2 $172,975 APPLICATIONS WITHDRAWN 2 $215,180 3 $207,007 0 $0 FILES CLOSED FOR INCOMPLETENESS 0 $0 1 $212,660 0 $0
Aggregated Statistics For Year 2002(Based on 3 partial tracts) A) Conventional B) Refinancings C) Non-occupant Loans on Number Average Value Number Average Value Number Average Value
LOANS ORIGINATED 27 $206,735 18 $222,823 2 $158,770 APPLICATIONS APPROVED, NOT ACCEPTED 2 $258,220 6 $205,785 0 $0 APPLICATIONS DENIED 0 $0 0 $0 0 $0 APPLICATIONS WITHDRAWN 0 $0 1 $242,740 0 $0 FILES CLOSED FOR INCOMPLETENESS 0 $0 0 $0 0 $0
Aggregated Statistics For Year 2001(Based on 3 partial tracts) A) Conventional B) Refinancings C) Non-occupant Loans on Number Average Value Number Average Value Number Average Value
LOANS ORIGINATED 42 $214,515 16 $189,975 1 $287,520 APPLICATIONS APPROVED, NOT ACCEPTED 7 $205,043 5 $159,210 1 $207,370 APPLICATIONS DENIED 2 $211,280 1 $230,920 0 $0 APPLICATIONS WITHDRAWN 1 $124,820 2 $201,560 0 $0 FILES CLOSED FOR INCOMPLETENESS 0 $0 0 $0 0 $0
Aggregated Statistics For Year 2000(Based on 3 partial tracts) A) Conventional B) Refinancings C) Non-occupant Loans on Number Average Value Number Average Value Number Average Value
LOANS ORIGINATED 42 $171,161 6 $163,490 1 $78,710 APPLICATIONS APPROVED, NOT ACCEPTED 4 $156,330 1 $150,700 0 $0 APPLICATIONS DENIED 0 $0 0 $0 0 $0 APPLICATIONS WITHDRAWN 2 $96,395 0 $0 0 $0 FILES CLOSED FOR INCOMPLETENESS 0 $0 0 $0 0 $0
Aggregated Statistics For Year 1999(Based on 4 partial tracts) A) Conventional B) Refinancings C) Non-occupant Loans on Number Average Value Number Average Value Number Average Value
LOANS ORIGINATED 51 $139,050 26 $119,010 2 $88,640 APPLICATIONS APPROVED, NOT ACCEPTED 4 $138,562 5 $125,842 0 $0 APPLICATIONS DENIED 2 $115,555 3 $162,087 2 $76,175 APPLICATIONS WITHDRAWN 2 $137,420 3 $111,103 1 $112,400 FILES CLOSED FOR INCOMPLETENESS 0 $0 1 $103,060 0 $0
Detailed PMIC statistics for the following Tracts:
0022.01
, 0022.02 , 0023.01 , 0023.02 Fire-safe hotels and motels in Los Banos, California:
Red Roof Inn, 2169 E Pacheco Blvd, Los Banos, California 93635 Phone: (209) 826-9690, Fax: (209) 373-2970
Knights Inn, 1621 E Pacheco Blvd, Los Banos, California 93635 Phone: (209) 827-4600, Fax: (209) 827-3684
Vagabond Inn, Executive, 20 W Pacheco Blvd, Los Banos, California 93635 Phone: (209) 827-4677, Fax: (209) 827-9987
Americas Best Value Inn, 330 W Pacheco Blvd, Los Banos, California 93635 Phone: (209) 826-5002, Fax: (209) 826-4021
All 4 fire-safe hotels and motels in Los Banos, California
Most common first names in Los Banos, CA among deceased individuals Name Count Lived (average)
Mary 128 78.6 years John 119 75.6 years Joe 88 76.8 years Frank 79 72.3 years Maria 77 81.3 years William 71 72.9 years James 70 74.2 years Robert 56 67.2 years Charles 48 75.1 years Manuel 48 74.5 years
Most common last names in Los Banos, CA among deceased individuals Last name Count Lived (average)
Lewis 39 73.8 years Silva 39 78.6 years Souza 38 77.3 years Smith 32 73.3 years Garcia 28 72.2 years Toscano 28 80.5 years Brown 27 72.8 years Gomes 22 78.8 years Johnson 21 76.2 years Rocha 19 78.8 years
Los Banos compared to California state average:
Median house value below state average. Hispanic race population percentage significantly above state average. Foreign-born population percentage above state average. Length of stay since moving in above state average. House age below state average. Percentage of population with a bachelor's degree or higher below state average.
#19 on the list of "Top 100 cities with longest commuting times (pop. 5,000+)"
#79 on the list of "Top 101 cities with the most residents born in Portugal (population 500+)"
#88 on the list of "Top 101 cities with largest percentage of females in occupations: farming, fishing, and forestry occupations (population 5,000+)"
#69 (93635) on the list of "Top 101 zip codes with the largest percentage of Portuguese first ancestries"
#28 on the list of "Top 101 counties with the lowest surface withdrawal of fresh water for public supply (pop. 50,000+)"
#30 on the list of "Top 101 counties with the highest number of births per 1000 residents 2007-2013"
#49 on the list of "Top 101 counties with the highest ground withdrawal of fresh water for public supply"
#82 on the list of "Top 101 counties with the lowest number of deaths per 1000 residents 2007-2013 (pop. 50,000+)"
#85 on the list of "Top 101 counties with the highest Particulate Matter (PM2.5 ) Annual air pollution readings in 2012 (µg/m3 )"
Top Patent Applicants
Kent Riley Child (2)
Barry C. Bianculli (2)
John Moffitt (2)
Patricia G. Selinger (1)
David Pimental (1)
Barry Bianculli (1)
Felipe A. Herrador (1)
Peter M. Lomanto (1)
Monica A. Herrador (1)
Robert D. Force (1)
Total of 14 patent applications in 2008-2024.
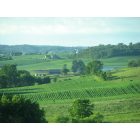
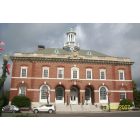


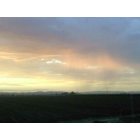


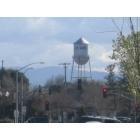
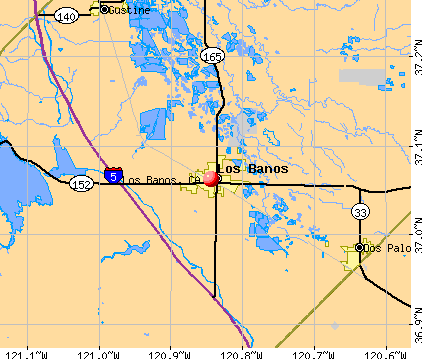


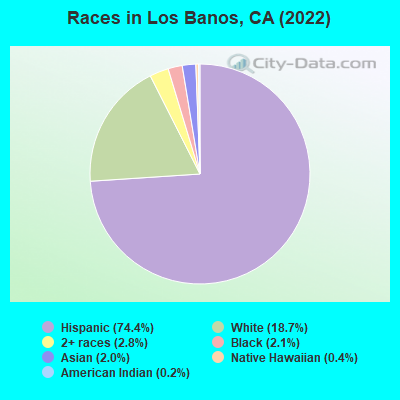
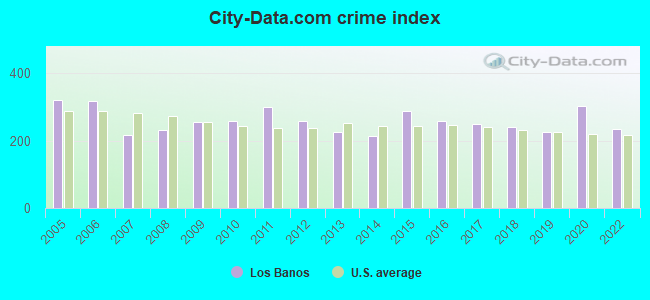
 Recent articles from our blog. Our writers, many of them Ph.D. graduates or candidates, create easy-to-read articles on a wide variety of topics.

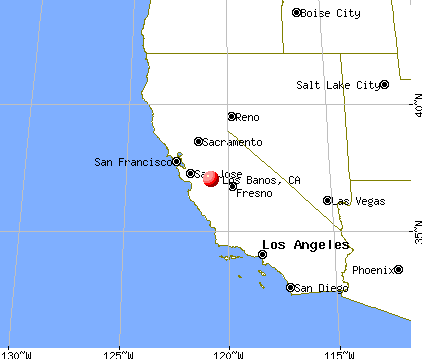
 (26.3 miles
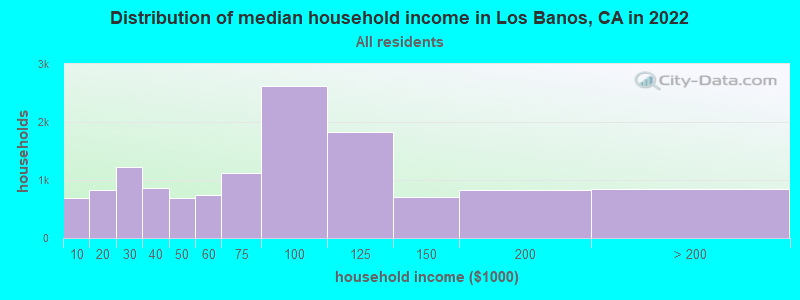
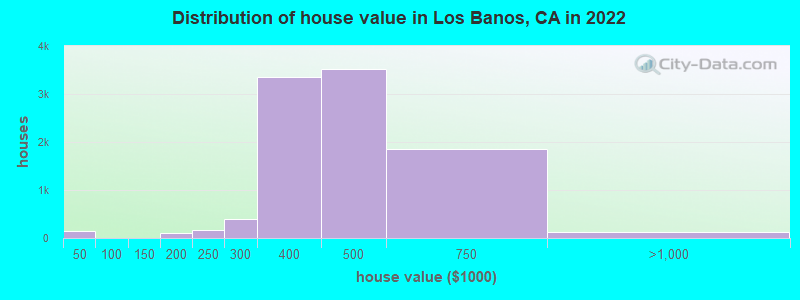
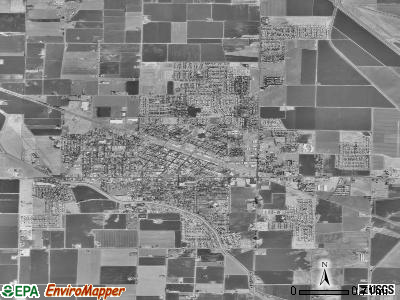
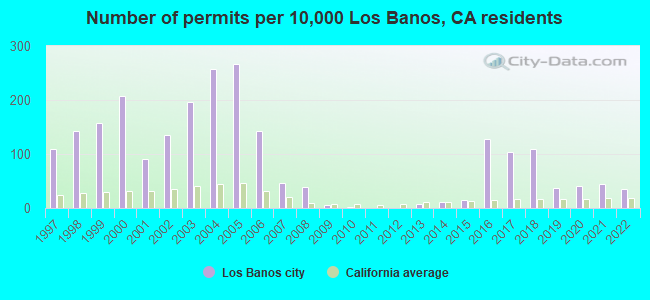
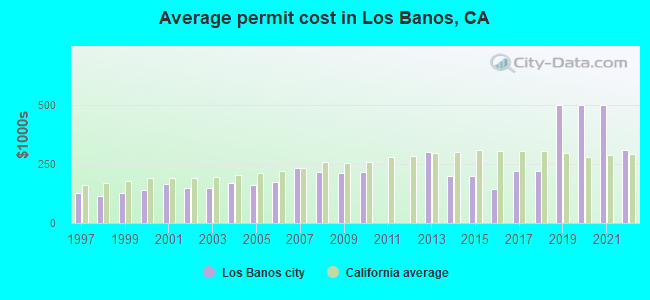
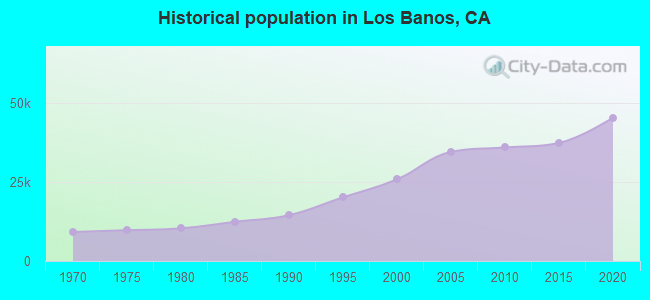
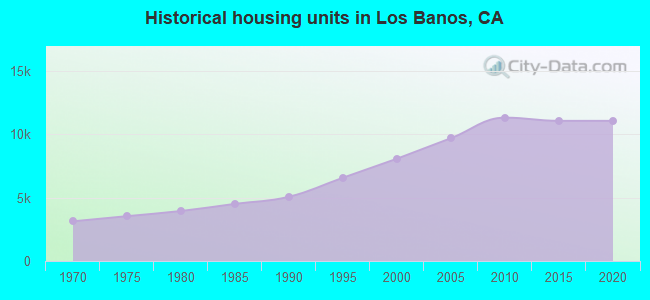
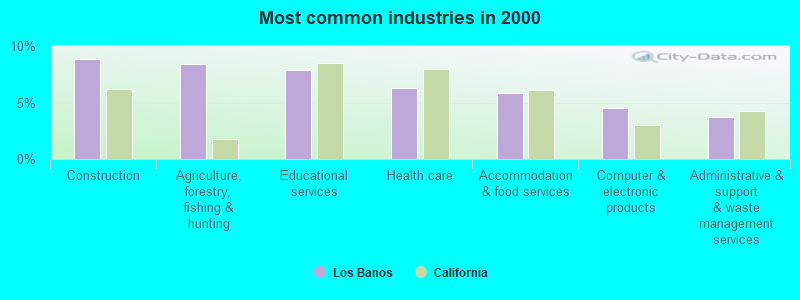
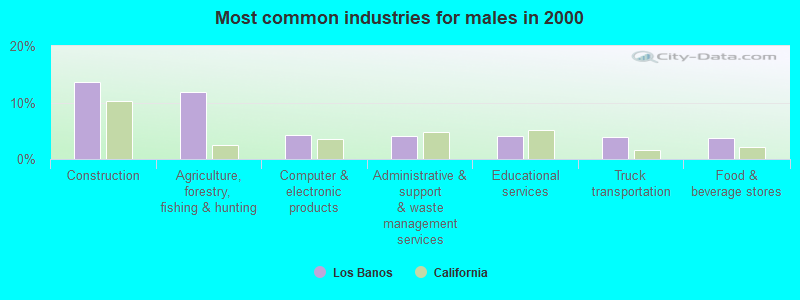
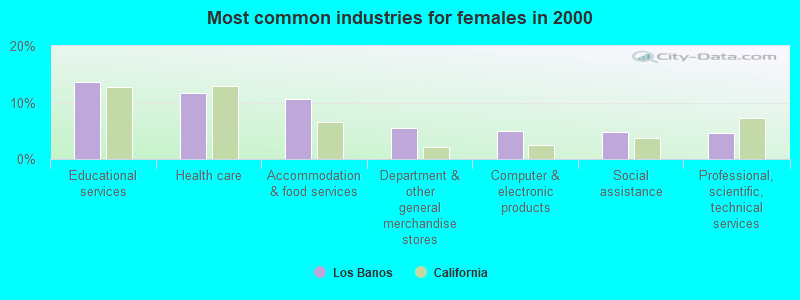
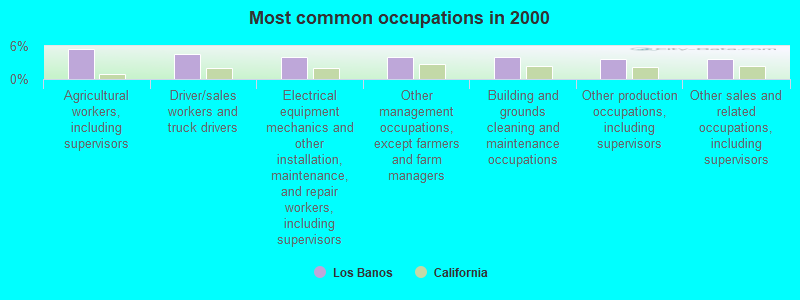
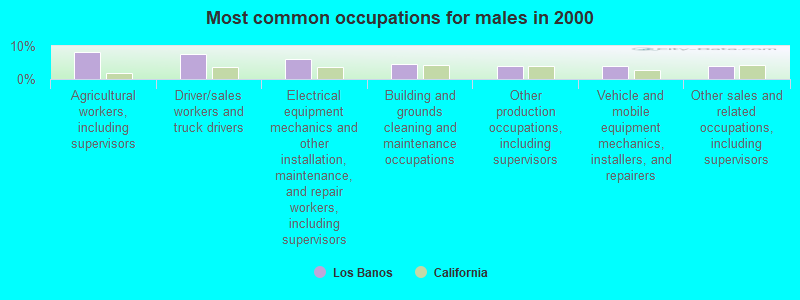
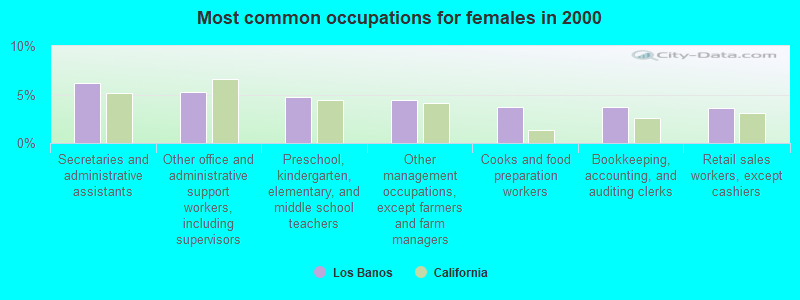
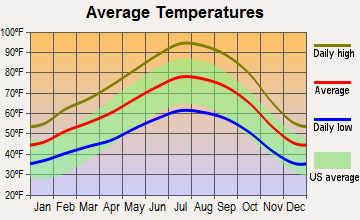
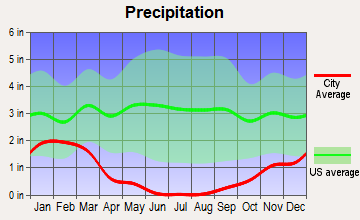
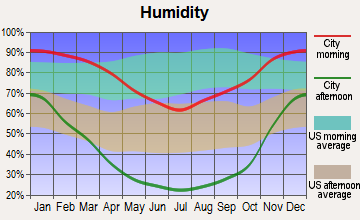
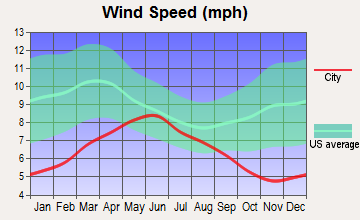
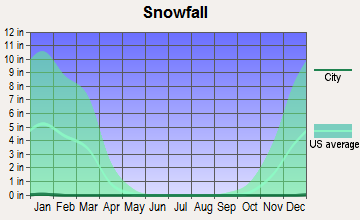
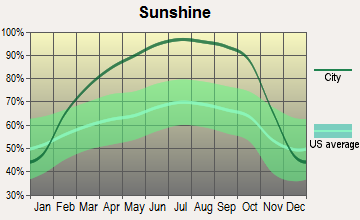
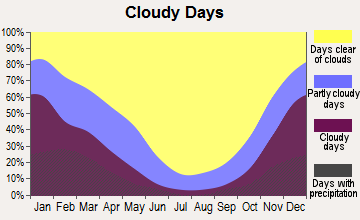
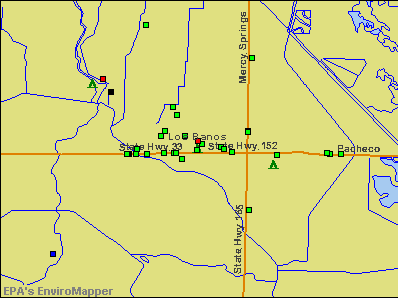

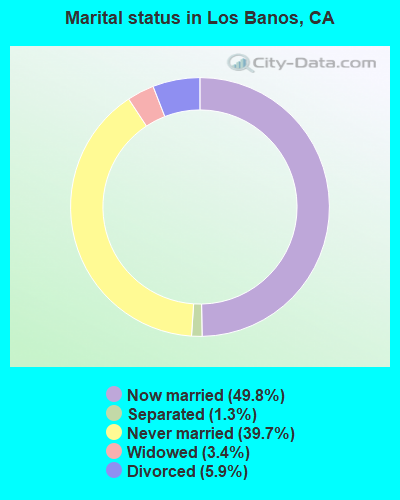
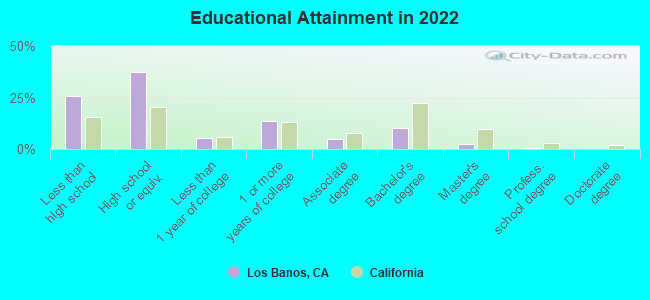
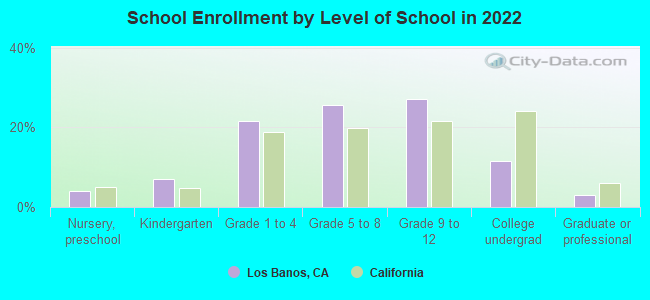
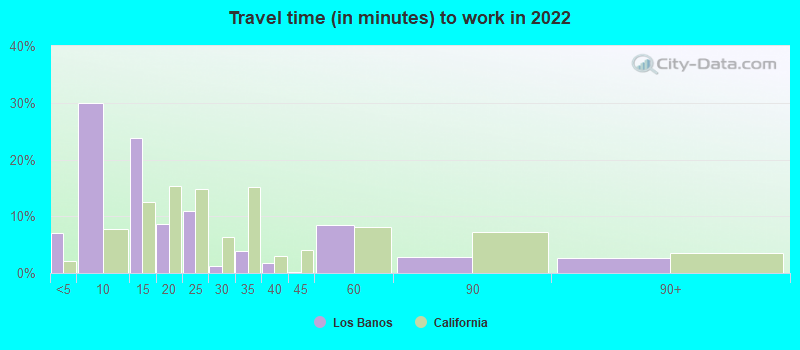
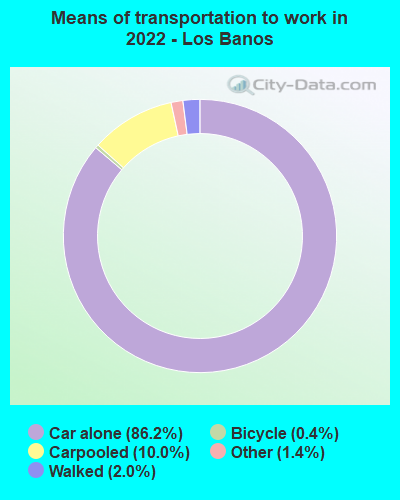
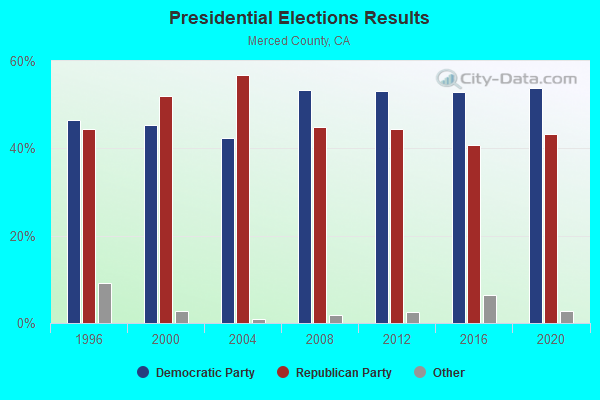
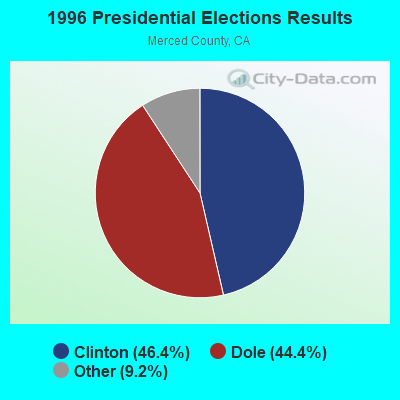
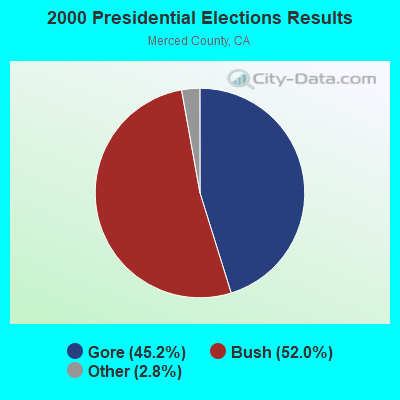
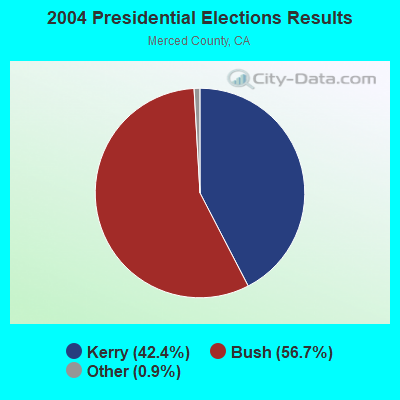
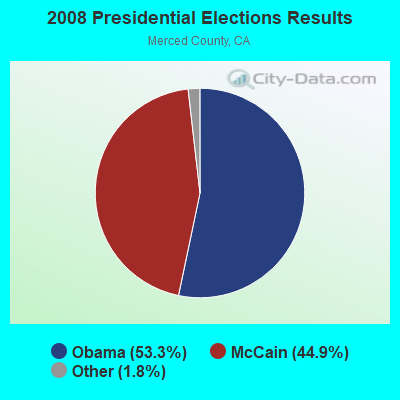
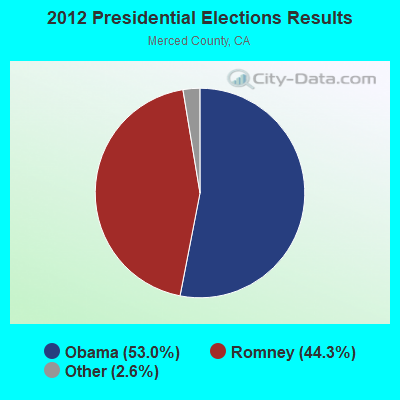
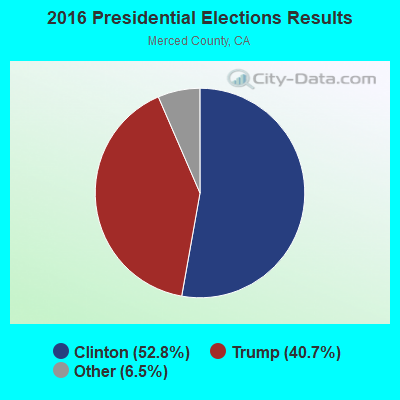

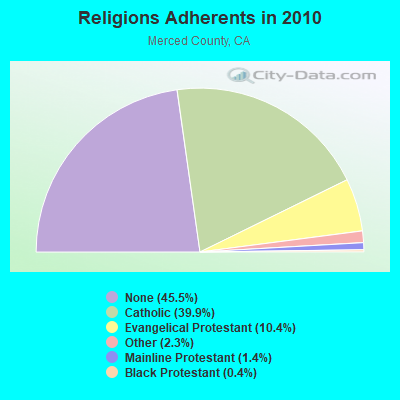
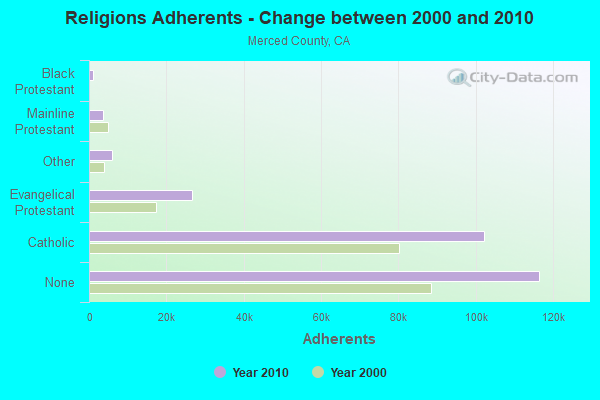
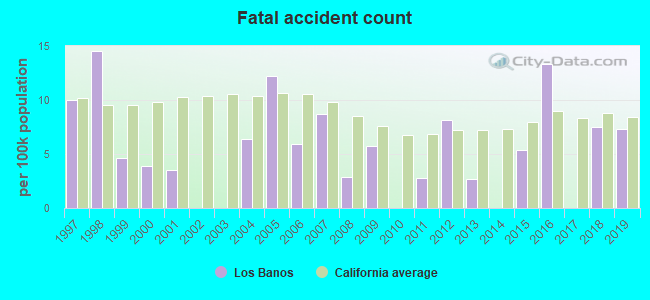
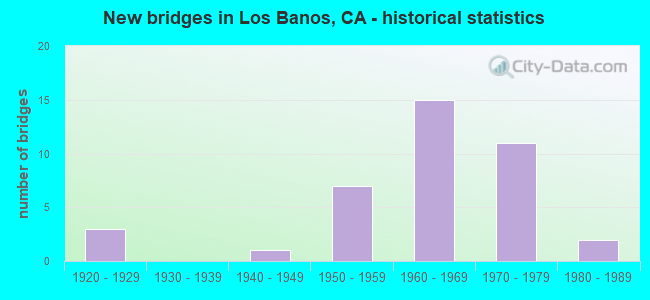
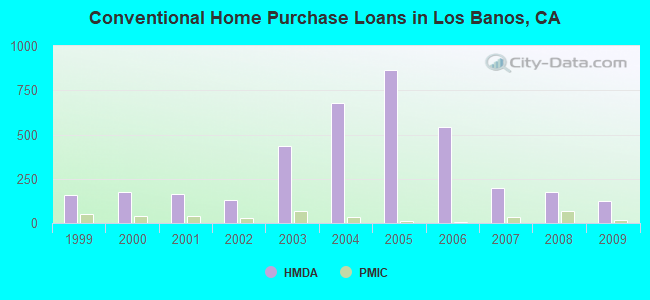
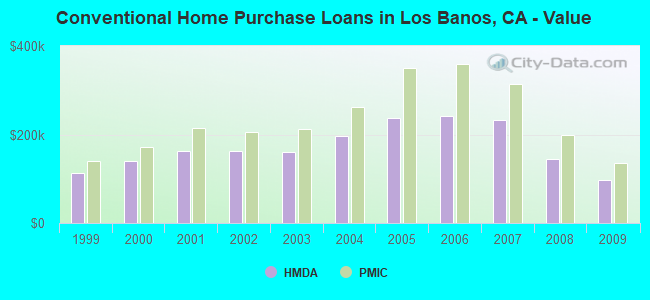
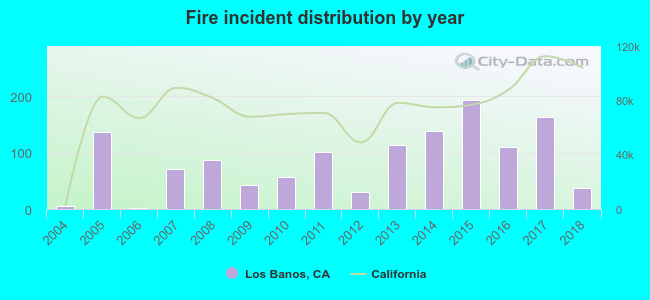 Based on the data from the years 2004 - 2018 the average number of fires per year is 86. The highest number of fire incidents - 193 took place in 2015, and the least - 1 in 2006. The data has an increasing trend.
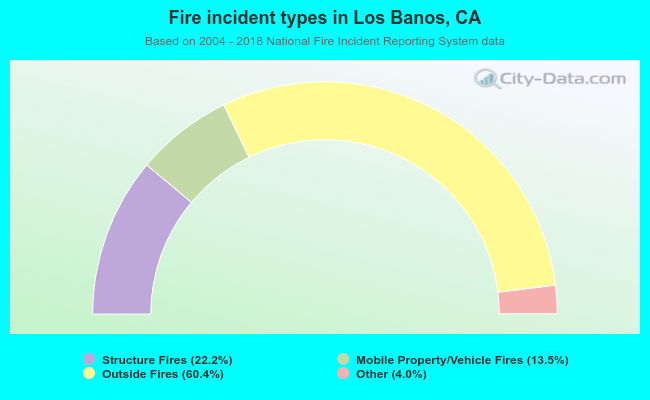 When looking into fire subcategories, the most incidents belonged to: Outside Fires (60.4%), and Structure Fires (22.2%).