Merced, California
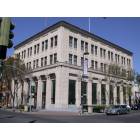
Merced: the Mondo Bank building
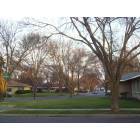
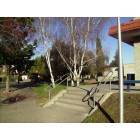
Merced: Sunset and Oakhurst
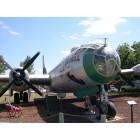
Merced: Castle Air Museum
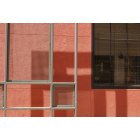
Merced: UC Merced satelite building on 19th
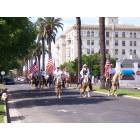
Merced: merced county sheriff posse
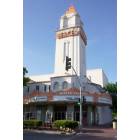
Merced: merced theater
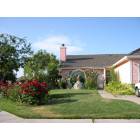
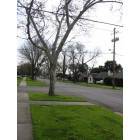
Merced: Residential
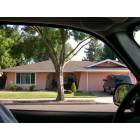
Merced: Residential
Merced: Merced near Amtrak station
Merced: Merced College
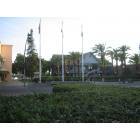
Merced: Downtown Merced
- see
14
more - add
your
Submit your own pictures of this city and show them to the world
- OSM Map
- General Map
- Google Map
- MSN Map
Population change since 2000: +43.3%
| Males: 44,652 | |
| Females: 46,911 |
| Median resident age: | 31.2 years |
| California median age: | 37.9 years |
Zip codes: 95340.
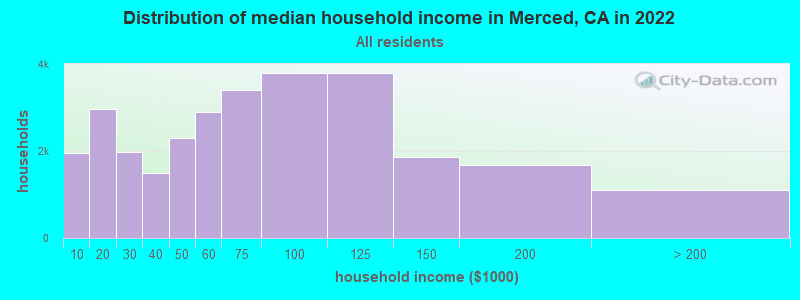
| Merced: | $64,160 |
| CA: | $91,551 |
Estimated per capita income in 2022: $27,313 (it was $13,115 in 2000)
Merced city income, earnings, and wages data
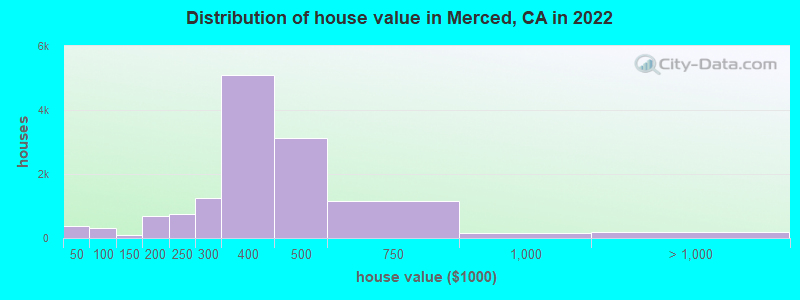
Estimated median house or condo value in 2022: $380,000 (it was $103,200 in 2000)
| Merced: | $380,000 |
| CA: | $715,900 |
Mean prices in 2022: all housing units: $351,275; detached houses: $354,656; townhouses or other attached units: $351,202; in 2-unit structures: $506,230; in 5-or-more-unit structures: $580,221; mobile homes: $60,491
Median gross rent in 2022: $1,305.
(17.8% for White Non-Hispanic residents, 44.7% for Black residents, 22.5% for Hispanic or Latino residents, 12.4% for American Indian residents, 24.3% for other race residents, 23.1% for two or more races residents)
Detailed information about poverty and poor residents in Merced, CA


Compare current foreclosures in Merced, CA:
| Photo | Address | Area | Beds / Baths | Price | Details |
|---|---|---|---|---|---|

|
#1
2841, 2843 N Oleander Ave
Merced, CA 95340
|
892 sq. feet
|
3 baths 2 beds |
show details | |

|
#2
Harp Ct
Merced, CA 95341
|
- sq. feet
|
2 baths 4 beds |
show details | |

|
#3
San Pablo Ave
Merced, CA 95348
|
1,901 sq. feet
|
2 baths 3 beds |
show details | |

|
#4
Oakhurst Ave
Merced, CA 95340
|
1,176 sq. feet
|
2 baths 3 beds |
show details | |

|
#5
W 21st St
Merced, CA 95340
|
1,537 sq. feet
|
1 baths 3 beds |
show details | |

|
#6
Cheyenne Dr
Merced, CA 95348
|
1,147 sq. feet
|
2 baths 3 beds |
show details | |

|
#7
Creekside Dr
Merced, CA 95348
|
1,290 sq. feet
|
2 baths 3 beds |
show details | |

|
#8
Wren Ct
Merced, CA 95340
|
1,621 sq. feet
|
2 baths 3 beds |
show details | |

|
#9
Green St
Merced, CA 95340
|
1,264 sq. feet
|
2 baths 3 beds |
show details | |

|
#10
Cowden Ave
Merced, CA 95348
|
1,436 sq. feet
|
2 baths 3 beds |
show details |
| Photo | Address | Area | Beds / Baths | Price | Details |
|---|---|---|---|---|---|

|
#11
La Jolla Dr
Merced, CA 95348
|
1,412 sq. feet
|
2 baths 3 beds |
show details | |

|
#12
Antioch Ct
Merced, CA 95348
|
1,603 sq. feet
|
1 baths 3 beds |
show details | |

|
#13
Bedford Dr
Merced, CA 95340
|
2,073 sq. feet
|
3 baths 4 beds |
show details | |

|
#14
El Portal Dr
Merced, CA 95340
|
2,410 sq. feet
|
3 baths 4 beds |
show details | |

|
#15
Swan Ct
Merced, CA 95340
|
1,434 sq. feet
|
2 baths 3 beds |
show details | |

|
#16
Azalea Ct
Merced, CA 95341
|
1,272 sq. feet
|
2 baths 3 beds |
show details | |

|
#17
R St
Merced, CA 95340
|
1,227 sq. feet
|
2 baths 3 beds |
show details | |

|
#18
Casual Ct
Merced, CA 95340
|
2,036 sq. feet
|
2 baths 4 beds |
show details | |

|
#19
Cherokee Ave
Merced, CA 95340
|
1,706 sq. feet
|
2 baths 4 beds |
show details | |

|
#20
Fairfax Ct
Merced, CA 95348
|
1,378 sq. feet
|
2 baths 3 beds |
show details |
| Photo | Address | Area | Beds / Baths | Price | Details |
|---|---|---|---|---|---|

|
#21
Vega Ct
Merced, CA 95341
|
1,187 sq. feet
|
2 baths 3 beds |
show details | |

|
#22
Swan Ct
Merced, CA 95340
|
1,823 sq. feet
|
2 baths 3 beds |
show details | |

|
#23
La Purisima St
Merced, CA 95341
|
1,277 sq. feet
|
2 baths 4 beds |
show details | |

|
#24
San Isidro Ave
Merced, CA 95348
|
2,170 sq. feet
|
2 baths 4 beds |
show details | |

|
#25
El Camino Real
Merced, CA 95340
|
1,757 sq. feet
|
2 baths 3 beds |
show details | |

|
#26
Occidental Ct
Merced, CA 95348
|
1,120 sq. feet
|
2 baths 3 beds |
show details | |

|
#27
Princeton Ct
Merced, CA 95348
|
1,577 sq. feet
|
2 baths 3 beds |
show details | |

|
#28
Mathias Way
Merced, CA 95348
|
1,663 sq. feet
|
2 baths 3 beds |
show details | |

|
#29
Merced Ave
Merced, CA 95341
|
1,141 sq. feet
|
1 baths 2 beds |
show details | |

|
#30
W 23rd St
Merced, CA 95340
|
996 sq. feet
|
1 baths 2 beds |
show details |
| Photo | Address | Area | Beds / Baths | Price | Details |
|---|---|---|---|---|---|

|
#31
Dinkey Creek Ave
Merced, CA 95341
|
1,595 sq. feet
|
2 baths 3 beds |
show details | |

|
#32
Constitution Ct
Merced, CA 95341
|
1,022 sq. feet
|
2 baths 3 beds |
show details | |

|
#33
Ellison Pl
Merced, CA 95348
|
2,411 sq. feet
|
2 baths 4 beds |
show details | |

|
#34
E 20th St
Merced, CA 95340
|
1,025 sq. feet
|
1 baths 2 beds |
show details | |

|
#35
E Childs Ave
Merced, CA 95341
|
1,429 sq. feet
|
1 baths 2 beds |
show details | |

|
#36
W 22nd St
Merced, CA 95340
|
955 sq. feet
|
1 baths 3 beds |
show details | |

|
#37
Gettysburg Ave
Merced, CA 95340
|
2,106 sq. feet
|
2 baths 4 beds |
show details | |

|
#38
Birchwood Ct
Merced, CA 95341
|
1,603 sq. feet
|
2 baths 3 beds |
show details | |

|
#39
Golden Oak Ln Spc 140
Merced, CA 95341
|
- sq. feet
|
- baths - beds |
show details | |

|
#40
W 8th St
Merced, CA 95341
|
- sq. feet
|
- baths - beds |
show details |
| Photo | Address | Area | Beds / Baths | Price | Details |
|---|---|---|---|---|---|

|
#41
Meadows Ave Apt 28
Merced, CA 95348
|
- sq. feet
|
- baths - beds |
show details | |

|
#42
Mono Lake Ave
Merced, CA 95341
|
- sq. feet
|
- baths - beds |
show details | |

|
#43
Shannon Ave
Merced, CA 95340
|
- sq. feet
|
- baths - beds |
show details | |

|
#44
S Canal St Apt A
Merced, CA 95341
|
- sq. feet
|
- baths - beds |
show details | |

|
#45
Pacheco Dr
Merced, CA 95340
|
- sq. feet
|
- baths - beds |
show details | |

|
#46
Stonybrook Ave
Merced, CA 95348
|
- sq. feet
|
- baths - beds |
show details | |

|
#47
E Alexander Ave
Merced, CA 95340
|
- sq. feet
|
- baths - beds |
show details | |

|
#48
Leigh High Drive
Merced, CA 95340
|
- sq. feet
|
- baths - beds |
show details | |

|
#49
I St
Merced, CA 95341
|
- sq. feet
|
- baths - beds |
show details | |

|
Check over 1 million property listings on Foreclosure.com!
|
browse all offers | |||


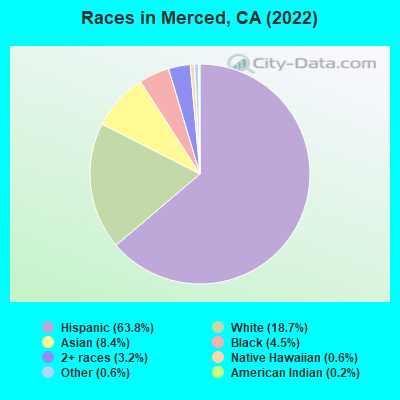
- 58,41363.8%Hispanic
- 17,09218.7%White alone
- 7,6688.4%Asian alone
- 4,1514.5%Black alone
- 2,9263.2%Two or more races
- 5910.6%Native Hawaiian and Other
Pacific Islander alone - 5290.6%Other race alone
- 2020.2%American Indian alone
According to our research of California and other state lists, there were 267 registered sex offenders living in Merced, California as of April 27, 2024.
The ratio of all residents to sex offenders in Merced is 309 to 1.
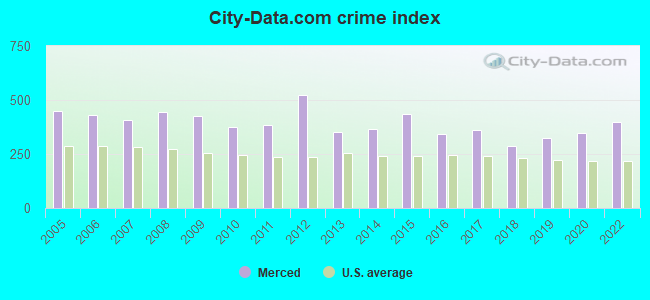
The City-Data.com crime index weighs serious crimes and violent crimes more heavily. Higher means more crime, U.S. average is 246.1. It adjusts for the number of visitors and daily workers commuting into cities.
- means the value is about the same as the state average.- means the value is bigger than the state average.
- means the value is much bigger than the state average.
Crime rate in Merced detailed stats: murders, rapes, robberies, assaults, burglaries, thefts, arson
Full-time law enforcement employees in 2021, including police officers: 132 (96 officers - 83 male; 13 female).
| Officers per 1,000 residents here: | 1.08 |
| California average: | 2.30 |
 Recent articles from our blog. Our writers, many of them Ph.D. graduates or candidates, create easy-to-read articles on a wide variety of topics.


Latest news from Merced, CA collected exclusively by city-data.com from local newspapers, TV, and radio stations
Ancestries: American (1.9%), German (1.3%), Irish (1.2%).
Current Local Time: PST time zone
Elevation: 171 feet
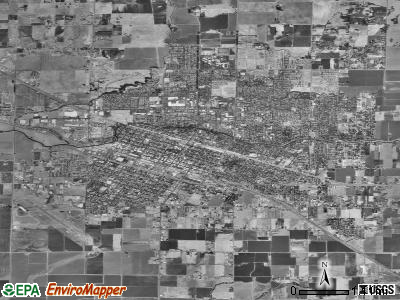
Land area: 19.9 square miles.
Population density: 4,610 people per square mile (average).
20,297 residents are foreign born (17.0% Latin America, 5.2% Asia).
| This city: | 22.5% |
| California: | 26.5% |
Median real estate property taxes paid for housing units with mortgages in 2022: $2,675 (0.7%)
Median real estate property taxes paid for housing units with no mortgage in 2022: $1,808 (0.5%)
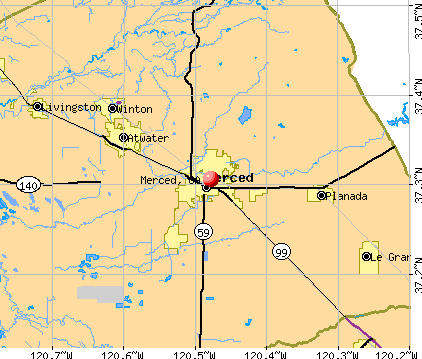
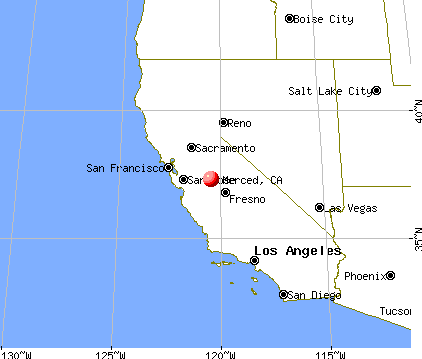
Nearest city with pop. 200,000+: Fresno, CA  (52.4 miles , pop. 427,652).
Nearest city with pop. 1,000,000+: Los Angeles, CA (252.0 miles , pop. 3,694,820).
Nearest cities:
), ), ), )Latitude: 37.31 N, Longitude: 120.48 W
Daytime population change due to commuting: -1,593 (-1.7%)
Workers who live and work in this city: 21,607 (58.6%)
Area code: 209
Merced tourist attractions:
Merced, California accommodation & food services, waste management - Economy and Business Data
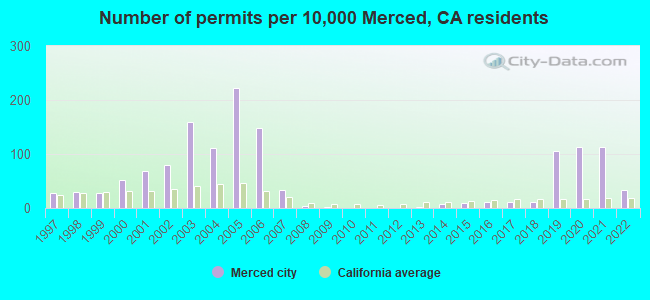
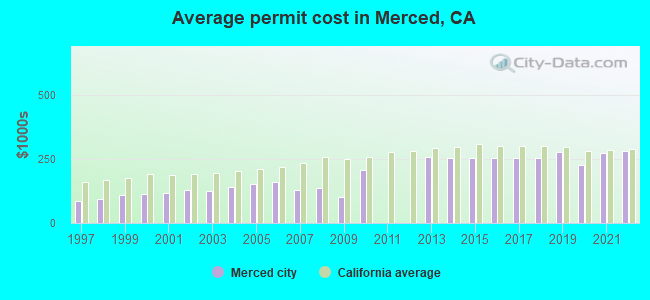
Single-family new house construction building permits:
- 2022: 214 buildings, average cost: $283,100
- 2021: 723 buildings, average cost: $274,200
- 2020: 723 buildings, average cost: $227,700
- 2019: 668 buildings, average cost: $277,900
- 2018: 77 buildings, average cost: $253,900
- 2017: 74 buildings, average cost: $253,900
- 2016: 70 buildings, average cost: $253,900
- 2015: 56 buildings, average cost: $253,900
- 2014: 46 buildings, average cost: $253,900
- 2013: 9 buildings, average cost: $257,000
- 2010: 2 buildings, average cost: $209,100
- 2009: 5 buildings, average cost: $102,400
- 2008: 21 buildings, average cost: $135,600
- 2007: 208 buildings, average cost: $130,600
- 2006: 953 buildings, average cost: $160,100
- 2005: 1428 buildings, average cost: $153,800
- 2004: 715 buildings, average cost: $141,100
- 2003: 1014 buildings, average cost: $125,100
- 2002: 514 buildings, average cost: $128,700
- 2001: 434 buildings, average cost: $118,200
- 2000: 331 buildings, average cost: $114,800
- 1999: 172 buildings, average cost: $110,300
- 1998: 190 buildings, average cost: $92,700
- 1997: 172 buildings, average cost: $88,400
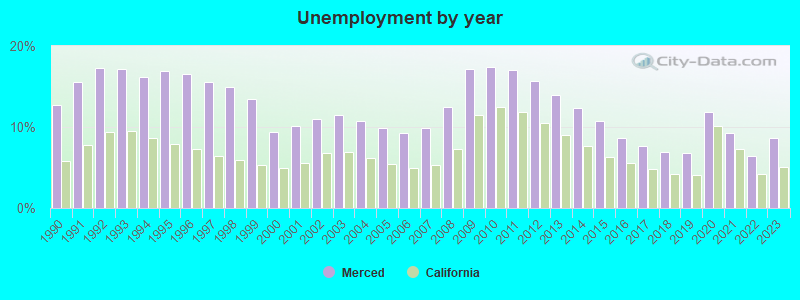
| Here: | 8.6% |
| California: | 5.1% |
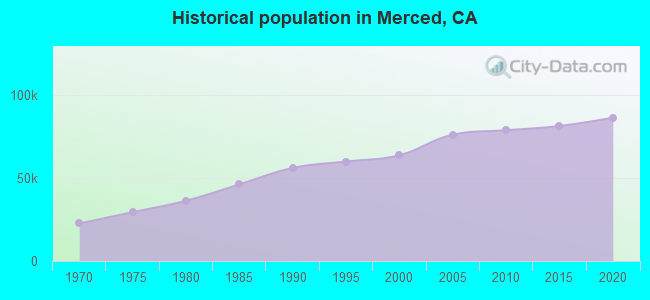
Population change in the 1990s: +6,774 (+11.9%).
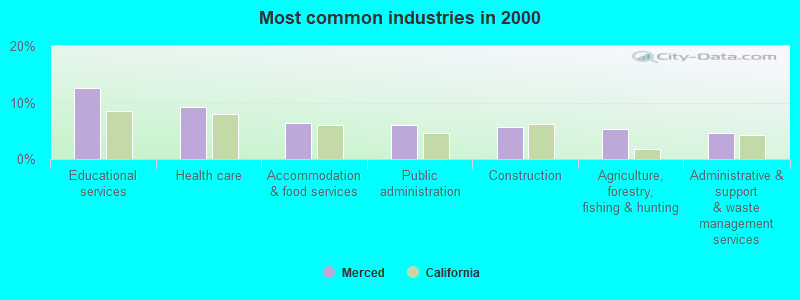
- Educational services (12.6%)
- Health care (9.2%)
- Accommodation & food services (6.4%)
- Public administration (5.9%)
- Construction (5.7%)
- Agriculture, forestry, fishing & hunting (5.3%)
- Administrative & support & waste management services (4.7%)
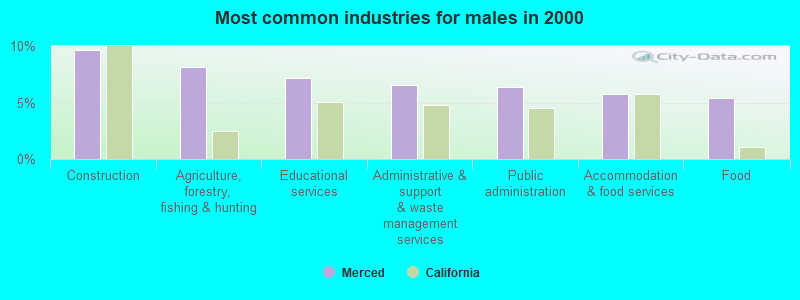
- Construction (9.7%)
- Agriculture, forestry, fishing & hunting (8.2%)
- Educational services (7.2%)
- Administrative & support & waste management services (6.5%)
- Public administration (6.4%)
- Accommodation & food services (5.8%)
- Food (5.4%)
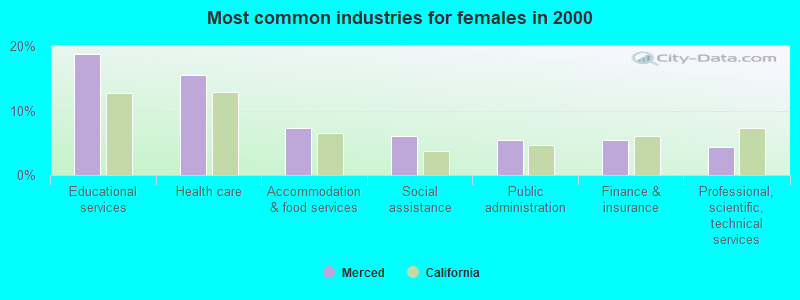
- Educational services (18.8%)
- Health care (15.5%)
- Accommodation & food services (7.3%)
- Social assistance (6.0%)
- Public administration (5.5%)
- Finance & insurance (5.4%)
- Professional, scientific, technical services (4.3%)
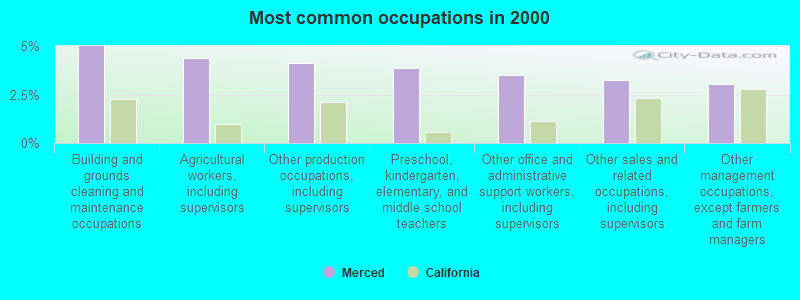
- Building and grounds cleaning and maintenance occupations (5.0%)
- Agricultural workers, including supervisors (4.4%)
- Other production occupations, including supervisors (4.1%)
- Preschool, kindergarten, elementary, and middle school teachers (3.9%)
- Other office and administrative support workers, including supervisors (3.5%)
- Other sales and related occupations, including supervisors (3.3%)
- Other management occupations, except farmers and farm managers (3.1%)
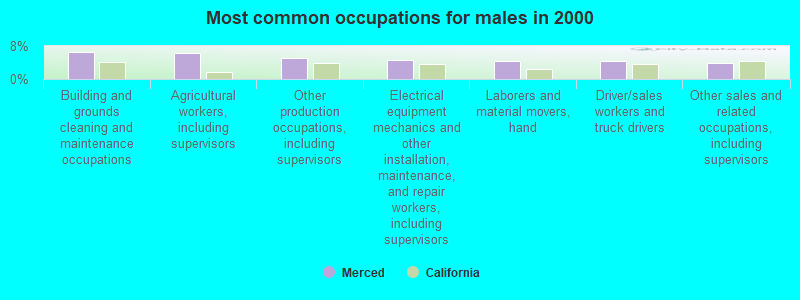
- Building and grounds cleaning and maintenance occupations (6.6%)
- Agricultural workers, including supervisors (6.3%)
- Other production occupations, including supervisors (5.0%)
- Electrical equipment mechanics and other installation, maintenance, and repair workers, including supervisors (4.6%)
- Laborers and material movers, hand (4.4%)
- Driver/sales workers and truck drivers (4.3%)
- Other sales and related occupations, including supervisors (4.0%)
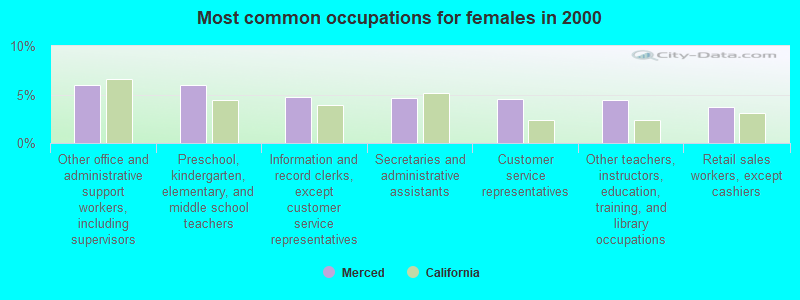
- Other office and administrative support workers, including supervisors (6.0%)
- Preschool, kindergarten, elementary, and middle school teachers (5.9%)
- Information and record clerks, except customer service representatives (4.7%)
- Secretaries and administrative assistants (4.6%)
- Customer service representatives (4.5%)
- Other teachers, instructors, education, training, and library occupations (4.4%)
- Retail sales workers, except cashiers (3.7%)
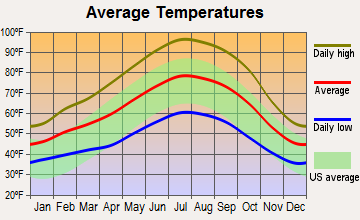
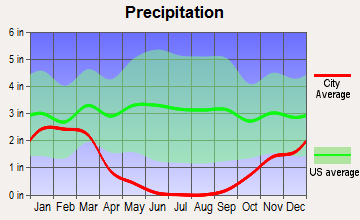
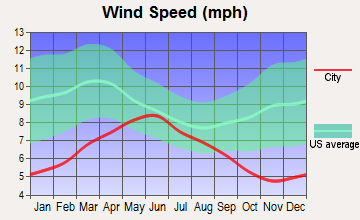
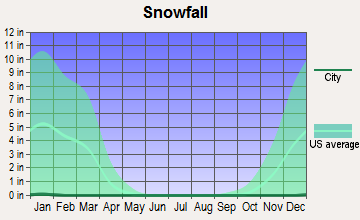
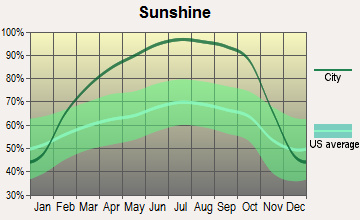
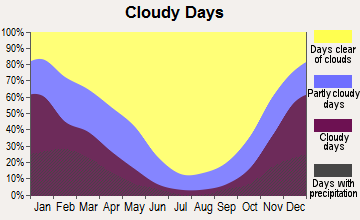
Average climate in Merced, California
Based on data reported by over 4,000 weather stations
|
|

(lower is better)
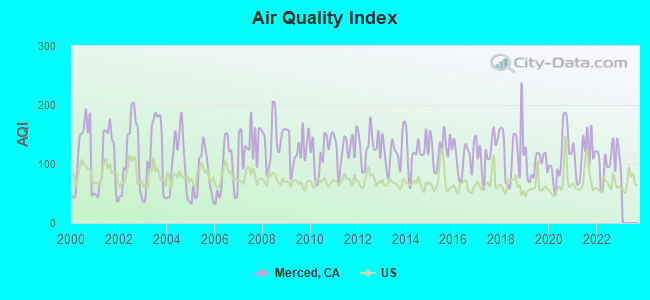
Air Quality Index (AQI) level in 2022 was 105. This is significantly worse than average.
| City: | 105 |
| U.S.: | 73 |
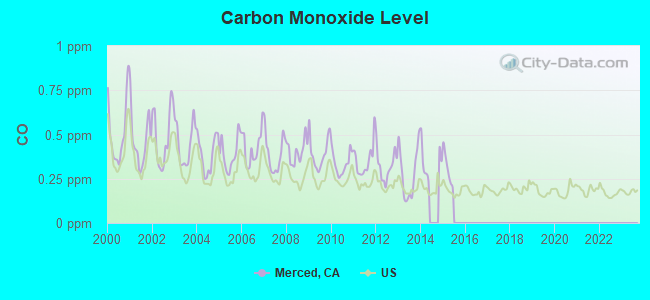
Carbon Monoxide (CO) [ppm] level in 2014 was 0.350. This is worse than average. Closest monitor was 0.3 miles away from the city center.
| City: | 0.350 |
| U.S.: | 0.251 |
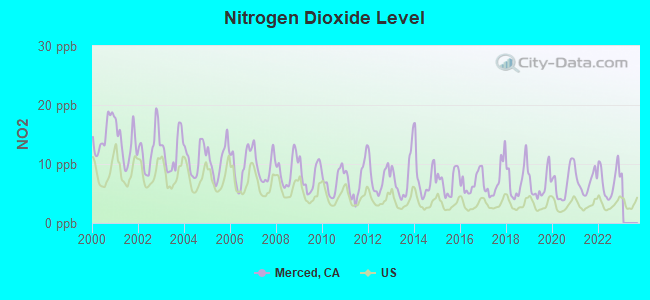
Nitrogen Dioxide (NO2) [ppb] level in 2022 was 7.10. This is worse than average. Closest monitor was 0.8 miles away from the city center.
| City: | 7.10 |
| U.S.: | 5.11 |
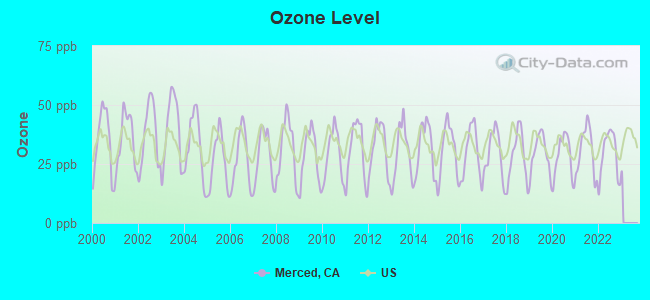
Ozone [ppb] level in 2022 was 29.2. This is about average. Closest monitor was 0.8 miles away from the city center.
| City: | 29.2 |
| U.S.: | 33.3 |
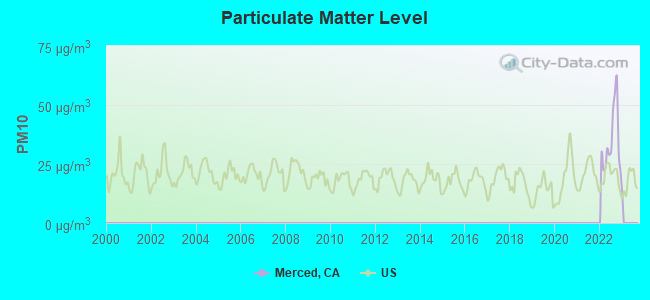
Particulate Matter (PM10) [µg/m3] level in 2022 was 34.9. This is significantly worse than average. Closest monitor was 0.2 miles away from the city center.
| City: | 34.9 |
| U.S.: | 19.2 |
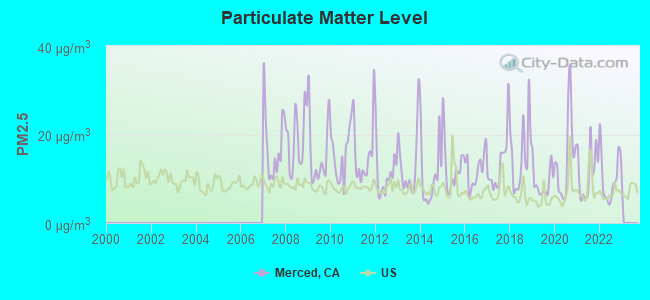
Particulate Matter (PM2.5) [µg/m3] level in 2022 was 10.4. This is worse than average. Closest monitor was 0.2 miles away from the city center.
| City: | 10.4 |
| U.S.: | 8.1 |
Earthquake activity:
Merced-area historical earthquake activity is significantly above California state average. It is 8337% greater than the overall U.S. average.On 4/18/1906 at 13:12:21, a magnitude 7.9 (7.9 UK, Class: Major, Intensity: VIII - XII) earthquake occurred 146.2 miles away from Merced center, causing $524,000,000 total damage
On 7/21/1952 at 11:52:14, a magnitude 7.7 (7.7 UK) earthquake occurred 179.6 miles away from Merced center, causing $50,000,000 total damage
On 11/4/1927 at 13:51:53, a magnitude 7.5 (7.5 UK) earthquake occurred 168.2 miles away from Merced center
On 10/18/1989 at 00:04:15, a magnitude 7.1 (6.5 MB, 7.1 MS, 6.9 MW, 7.0 ML) earthquake occurred 72.5 miles away from Merced center, causing 62 deaths (62 shaking deaths) and 3757 injuries, causing $1,305,032,704 total damage
On 12/21/1932 at 06:10:09, a magnitude 7.2 (7.2 UK) earthquake occurred 154.9 miles away from Merced center
On 10/3/1915 at 06:52:48, a magnitude 7.6 (7.6 UK) earthquake occurred 272.9 miles away from the city center
Magnitude types: body-wave magnitude (MB), local magnitude (ML), surface-wave magnitude (MS), moment magnitude (MW)
Natural disasters:
The number of natural disasters in Merced County (13) is near the US average (15).Major Disasters (Presidential) Declared: 8
Emergencies Declared: 2
Causes of natural disasters: Floods: 8, Storms: 4, Winter Storms: 4, Mudslides: 3, Freezes: 2, Landslides: 2, Drought: 1, Hurricane: 1, Tornado: 1, Other: 1 (Note: some incidents may be assigned to more than one category).
Main business address for: CAPITAL CORP OF THE WEST (STATE COMMERCIAL BANKS).
Hospitals in Merced:
- 22ND STREET (260 WEST 22ND STREET)
- BRISTOL HOSPICE-CALIFORNIA, LLC (1170 WEST OLIVE AVENUE, SUITE B)
- DAVIDSON ADULT HOME SUN VALLEY (48 SUN VALLEY COURT)
- HOSPICE OF MERCED (1450 EAST 27TH STREET)
- MERCY MEDICAL CENTER (Voluntary non-profit - Private, 333 MERCY AVENUE)
Nursing Homes in Merced:
- COUNTRY VILLA LA SIERRA CARE CENTER (2424 M STREET)
- COUNTRY VILLA MERCED BEHAVIORAL HEALTHCARE CENTER (1255 B STREET)
- COUNTRY VILLA MERCED NURSING AND REHABILITATION CTR (510 WEST 26TH STREET)
- FRANCISCAN CONVALESCENT HOSPITAL (3169 M STREET)
- HY-LOND HEALTH CARE CENTER-MERCED (3170 M STREET)
- MERCY MEDICAL CENTER MERCED (301 EAST 13TH STREET)
Dialysis Facilities in Merced:
- NORTH MERCED DIALYSIS CENTER (3150 G STREET SUITE A)
- SATELLITE DIALYSIS MERCED (3376 NORTH HIGHWAY 59 SUITE I)
- YOSEMITE DIALYSIS CENTER (464 EAST YOSEMITE AVENUE STE B)
Home Health Centers in Merced:
Airports and heliports located in Merced:
- Merced Regional/Macready Field Airport (MCE) (Runways: 1, Commercial Ops: 8,760, Air Taxi Ops: 250, Itinerant Ops: 32,620, Local Ops: 21,670, Military Ops: 500)
- 59 Ranch Airport (35CL) (Runways: 1)
- Hunt Farms Airport (15CL) (Runways: 1)
- Mercy Medical Center Merced Heliport (86CN)
Amtrak station:
MERCED (324 W. 24TH ST.) . Services: ticket office, fully wheelchair accessible, enclosed waiting area, public restrooms, public payphones, vending machines, free short-term parking, free long-term parking, call for car rental service, call for taxi service, public transit connection.Colleges/Universities in Merced:
- Merced College (Full-time enrollment: 6,973; Location: 3600 M St; Public; Website: www.mccd.edu)
- University of California-Merced (Full-time enrollment: 5,981; Location: 5200 North Lake Road; Public; Website: www.ucmerced.edu; Offers Doctor's degree)
- Sierra College of Beauty (Full-time enrollment: 98; Location: 1340 W 18th St; Private, for-profit; Website: sierrabeautycollege.net)
- Milan Institute-Merced (Full-time enrollment: 34; Location: 780 Loughborough Drive; Private, for-profit; Website: www.milaninstitute.edu)
Other colleges/universities with over 2000 students near Merced:
- California State University-Stanislaus (about 26 miles; Turlock, CA; Full-time enrollment: 7,054)
- Modesto Junior College (about 38 miles; Modesto, CA; FT enrollment: 10,635)
- University of Phoenix-Central Valley Campus (about 49 miles; Fresno, CA; FT enrollment: 2,109)
- Heald College-Fresno (about 51 miles; Fresno, CA; FT enrollment: 2,199)
- California State University-Fresno (about 53 miles; Fresno, CA; FT enrollment: 18,993)
- Institute of Technology Inc (about 53 miles; Clovis, CA; FT enrollment: 2,483)
- Fresno City College (about 53 miles; Fresno, CA; FT enrollment: 12,994)
Biggest public high schools in Merced:
- MERCED HIGH (Students: 1,791, Location: 205 W. OLIVE AVE., Grades: 9-12)
- GOLDEN VALLEY HIGH (Students: 1,617, Location: 2121 E. CHILDS AVE., Grades: 9-12)
- VALLEY MERCED COMMUNITY (Students: 266, Location: 1850 WARDROBE AVE., Grades: KG-12)
- MERCED COUNTY SPECIAL EDUCATION (Students: 246, Location: 632 W. 13TH ST., Grades: KG-12)
- INDEPENDENCE HIGH (ALTERNATIVE) (Students: 156, Location: 1900 G ST., Grades: 9-12)
- YOSEMITE HIGH (CONTINUATION) (Students: 126, Location: 1900 G ST., Grades: 9-12)
- MERCED SCHOLARS CHARTER (Students: 63, Location: 1850 WARDROBE AVE., BLDG. H, Grades: 6-12, Charter school)
- MERCED COUNTY JUVENILE HALL/COMMUNITY (Students: 48, Location: 2840 W. SANDY MUSH RD., Grades: KG-12)
- SEQUOIA HIGH (Location: 1900 G ST., Grades: 9-12)
- EL CAPITAN HIGH (Location: 100 W. FARMLAND, Grades: 9-12)
Private high schools in Merced:
Biggest public elementary/middle schools in Merced:
- HERBERT H. CRUICKSHANK MIDDLE (Students: 862, Location: 601 MERCY AVE., Grades: 6-8)
- RUDOLPH RIVERA MIDDLE (Students: 858, Location: 945 BUENA VISTA DR., Grades: 6-8)
- WEAVER MIDDLE (Students: 702, Location: 3076 E. CHILDS AVE., Grades: 6-8)
- HERBERT HOOVER MIDDLE (Students: 678, Location: 800 E. 26TH ST., Grades: 6-8)
- MCSWAIN ELEMENTARY (Students: 595, Location: 922 SCOTT RD., Grades: KG-8)
- ALLAN PETERSON ELEMENTARY (Students: 479, Location: 848 E. DONNA DR., Grades: KG-5)
- JOE STEFANI (Students: 446, Location: 2768 RANCHERO LN., Grades: 3-5)
- DONN B. CHENOWETH ELEMENTARY (Students: 420, Location: 3200 PARSONS AVE., Grades: KG-5)
- ALICIA REYES ELEMENTARY (Students: 381, Location: 123 S. N ST., Grades: KG-5)
- JOHN C. FREMONT ELEMENTARY (Students: 341, Location: 1120 W. 22ND ST., Grades: KG-5)
Private elementary/middle schools in Merced:
- OUR LADY OF MERCY SCHOOL (Students: 380, Location: 1400 E 27TH ST, Grades: PK-8)
- MERCED CHRISTIAN SCHOOL (Students: 201, Location: 3312 G ST, Grades: PK-8)
- ST PAUL LUTHERAN (Students: 139, Location: 2916 MCKEE RD, Grades: PK-5)
- ST LUKES ANGLICAN SCHOOL (Students: 60, Location: 350 W YOSEMITE AVE, Grades: PK-4)
User-submitted facts and corrections:
- Ray Allen of the Seattle Sonics and Gary Payton of the Miami Heat are both born in Merced. The dates of their birth are unknown to me.
- Merced, CA is the birthplace of the late actress, Janet Leigh. Janet Leigh is also the mother of current actress Jamie Lee Curtis
- Colleges/Universities in Merced: add University of California at Merced (http://www.ucmerced.edu/)
- merced is also home of the central valley blues festival held every October in courthouse park, web site is www.centralvalleybluesfestival.com
- Colleges & Universities in addition to Merced Community College and Sierra Beauty College is the University of California Merced
- Sutter Merced is now Mercy Community campus 301 e 13th st
- University of California, Merced Campus opened in 2005
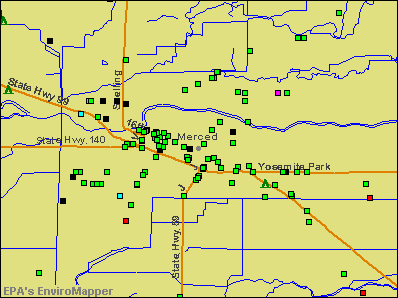
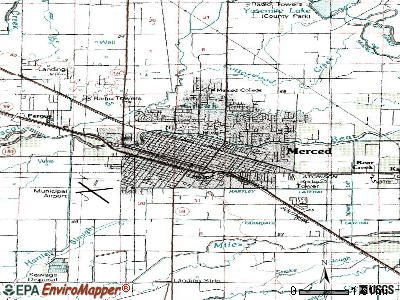
Points of interest:
Notable locations in Merced: Creegan (A), Bellevue Ranch (B), Applegate Park Zoo (C), Airport Industrial Park (D), Wilson Substation (E), Merced Sewage Disposal (F), Merced Museum (G), Merced County Law Library (H), Yosemite Wildlife Museum (I), Lesher Library (J), Veterans Memorial Hall (K), Merced Womans Club (L), Merced County Library (M), Merced County Jail (N), Merced County Courthouse (O), Merced City Hall (P), Merced County Fire Department Station 81 Merced Headquarters (Q), Merced County Human Services Agency (R), Riggs Ambulance Service (S), Air Methods Medical Transport (T). Display/hide their locations on the map
Shopping Centers: Yosemite North Shopping Center (1), Merced Mall Shopping Center (2), College Green Shopping Center (3), Bear Creek Village Shopping Center (4), Bear Creek Shopping Center (5). Display/hide their locations on the map
Main business address in Merced: CAPITAL CORP OF THE WEST (A). Display/hide its location on the map
Churches in Merced include: Church of Christ (A), Friendship Baptist Church (B), Bethesda Apostolic Faith Church (C), Calvary Baptist Church (D), Central Presbyterian Church (E), The Church of Jesus Christ of Latter Day Saints (F), Church of the Nazarene (G), Cornerstone Worship Center Pentecostal Church (H), First Assembly of God Church (I). Display/hide their locations on the map
Cemetery: Evergreen Cemetery (1). Display/hide its location on the map
Creeks: Cottonwood Creek (A), Miles Creek (B), Fahrens Creek (C). Display/hide their locations on the map
Parks in Merced include: Applegate Park (1), Leonard Park (2), McNamara Park (3), Macready Park (4), Ada Givens Park (5), Black Rascal Creek Park (6), Burbank Park (7), Fahrens Park (8), Joe Herb Park (9). Display/hide their locations on the map
Tourist attraction: Boardman Mitchell Partners (3144 North) (1). Display/hide its approximate location on the map
Hotels: Best Western Inn (1033 Motel Drive) (1), Best Western Sequoia Inn (1213 V St) (2). Display/hide their approximate locations on the map
Birthplace of: Charles Ogletree - Legal scholar, Ray Allen - Basketball guard, Janet Leigh - Actress, Cory Williams - Internet personality, Diana Serra Cary - Actress, Doug Fister - Professional baseball player, Marvin Eastman - Martial artist, Steven Stayner - Child who became famous after he was kidnapped, Brian Fuentes - 2005 Major League Baseball player (Colorado Rockies, born: Aug 9, 1975), Bruce Bowen - NBA player (San Antonio Spurs, born: Jun 14, 1971).
Drinking water stations with addresses in Merced and their reported violations in the past:
LAKE YOSEMITE COUNTY PARK (Population served: 1,105, Groundwater):Past health violations:MID - BARRETT COVE (Population served: 892, Groundwater):Past monitoring violations:
- MCL, Monthly (TCR) - In AUG-2011, Contaminant: Coliform. Follow-up actions: St AO (w/o penalty) issued (AUG-27-2012)
- One routine major monitoring violation
Past monitoring violations:HAGAMAN COUNTY PARK (Population served: 360, Groundwater):
- One minor monitoring violation
- One regular monitoring violation
Past health violations:MID - MC CLURE POINT REC AREA (Population served: 332, Surface water):Past monitoring violations:
- MCL, Monthly (TCR) - In JUN-2013, Contaminant: Coliform
- MCL, Monthly (TCR) - In JUN-2012, Contaminant: Coliform. Follow-up actions: St AO (w/o penalty) issued (AUG-28-2012)
- MCL, Monthly (TCR) - In APR-2012, Contaminant: Coliform. Follow-up actions: St AO (w/o penalty) issued (AUG-28-2012)
- 2 routine major monitoring violations
Past monitoring violations:MID - MC SWAIN REC AREA (Population served: 323, Surface water):
- One minor monitoring violation
- One regular monitoring violation
Past monitoring violations:MID -HORSESHOE BEND REC AREA (Population served: 323, Groundwater):
- One minor monitoring violation
- 3 regular monitoring violations
Past health violations:HENDERSON COUNTY PARK (Population served: 299, Groundwater):Past monitoring violations:
- MCL, Monthly (TCR) - In JUL-2011, Contaminant: Coliform. Follow-up actions: St AO (w/o penalty) issued (AUG-30-2011)
- One regular monitoring violation
Past health violations:MERCED GOLF & COUNTRY CLUB (Population served: 150, Groundwater):
- MCL, Monthly (TCR) - In JUN-2013, Contaminant: Coliform
Past monitoring violations:
- Monitoring, Repeat Major (TCR) - In AUG-2011, Contaminant: Coliform (TCR). Follow-up actions: St Formal NOV issued (AUG-27-2012)
- One minor monitoring violation
Drinking water stations with addresses in Merced that have no violations reported:
- ELKS LODGE PARK (Population served: 400, Primary Water Source Type: )
- BLACK RASCAL WATER COMPANY (Population served: 393, Primary Water Source Type: Groundwater)
- NAGAME JAPANESE RESTAURANT (Population served: 75, Primary Water Source Type: Groundwater)
- LDS CHURCH (Population served: 65, Primary Water Source Type: Groundwater)
| This city: | 3.1 people |
| California: | 2.9 people |
| This city: | 71.6% |
| Whole state: | 68.7% |
| This city: | 9.3% |
| Whole state: | 7.2% |
Likely homosexual households (counted as self-reported same-sex unmarried-partner households)
- Lesbian couples: 0.4% of all households
- Gay men: 0.3% of all households
People in group quarters in Merced in 2010:
- 343 people in nursing facilities/skilled-nursing facilities
- 262 people in other noninstitutional facilities
- 109 people in local jails and other municipal confinement facilities
- 100 people in emergency and transitional shelters (with sleeping facilities) for people experiencing homelessness
- 96 people in mental (psychiatric) hospitals and psychiatric units in other hospitals
- 68 people in residential treatment centers for adults
- 51 people in group homes intended for adults
- 40 people in group homes for juveniles (non-correctional)
- 11 people in workers' group living quarters and job corps centers
People in group quarters in Merced in 2000:
- 539 people in local jails and other confinement facilities (including police lockups)
- 389 people in other noninstitutional group quarters
- 222 people in nursing homes
- 92 people in other nonhousehold living situations
- 58 people in homes for the mentally retarded
- 45 people in short-term care, detention or diagnostic centers for delinquent children
- 18 people in homes or halfway houses for drug/alcohol abuse
- 4 people in mental (psychiatric) hospitals or wards
- 3 people in other group homes
Banks with most branches in Merced (2011 data):
- Westamerica Bank: Olive Road Branch at 490 West Olive Avenue, branch established on 1997/09/01; Merced Downtown Branch at 605 W 18th St, branch established on 2009/08/17. Info updated 2011/06/21: Bank assets: $4,998.1 mil, Deposits: $4,253.2 mil, headquarters in San Rafael, CA, positive income, Commercial Lending Specialization, 98 total offices, Holding Company: Westamerica Bancorporation
- Rabobank, National Association: Merced M Street Branch at 2000 M Street, branch established on 2009/05/05; Merced Yosemite Ave Branch at 731 E. Yosemite Ave, branch established on 2009/05/05. Info updated 2011/01/27: Bank assets: $11,745.0 mil, Deposits: $8,446.0 mil, headquarters in Roseville, CA, positive income, Agricultural Specialization, 124 total offices, Holding Company: Cooperatieve Centrale Raiffeisen-Boerenleenbank B.A., "rabobank Nederland
- Citibank, National Association: 3190m Street Suite G Branch at 3190 M Street, branch established on 1919/01/01; 1840 M Street Branch at 1840 M Street, branch established on 1919/01/01. Info updated 2012/01/10: Bank assets: $1,288,658.0 mil, Deposits: $882,541.0 mil, headquarters in Sioux Falls, SD, positive income, International Specialization, 1048 total offices, Holding Company: Citigroup Inc.
- Wells Fargo Bank, National Association: Merced Branch at 555 West 18th Street, branch established on 1948/12/20; Yosemite North at 3538 G Street, branch established on 1998/01/06. Info updated 2011/04/05: Bank assets: $1,161,490.0 mil, Deposits: $905,653.0 mil, headquarters in Sioux Falls, SD, positive income, 6395 total offices, Holding Company: Wells Fargo & Company
- JPMorgan Chase Bank, National Association: North Merced Branch at 800 West Olive Avenue, branch established on 1981/12/11; North G Street & Yosemite Avenue Ral at 3550 North G Street, branch established on 2010/11/16. Info updated 2011/11/10: Bank assets: $1,811,678.0 mil, Deposits: $1,190,738.0 mil, headquarters in Columbus, OH, positive income, International Specialization, 5577 total offices, Holding Company: Jpmorgan Chase & Co.
- Farmers & Merchants Bank of Central California: Merced Branch at 2936 G Street, branch established on 2009/02/18. Info updated 2006/11/03: Bank assets: $1,920.1 mil, Deposits: $1,627.8 mil, headquarters in Lodi, CA, positive income, Agricultural Specialization, 23 total offices, Holding Company: Farmers & Merchants Bancorp
- Compass Bank: Merced Branch at 3065 G St, branch established on 1989/06/30. Info updated 2011/02/24: Bank assets: $63,107.0 mil, Deposits: $46,232.4 mil, headquarters in Birmingham, AL, negative income in the last year, Commercial Lending Specialization, 720 total offices, Holding Company: Banco Bilbao Vizcaya Argentaria, S.A.
- Union Bank, National Association: Merced Instore Branch at 150 West Olive Avenue, branch established on 1997/09/04. Info updated 2011/09/01: Bank assets: $88,967.5 mil, Deposits: $65,286.4 mil, headquarters in San Francisco, CA, positive income, Commercial Lending Specialization, 403 total offices, Holding Company: Mitsubishi Ufj Financial Group, Inc.
- Bank of America, National Association: Merced Branch at 710 West Main Street, branch established on 1916/06/07. Info updated 2009/11/18: Bank assets: $1,451,969.3 mil, Deposits: $1,077,176.8 mil, headquarters in Charlotte, NC, positive income, 5782 total offices, Holding Company: Bank Of America Corporation
For population 15 years and over in Merced:
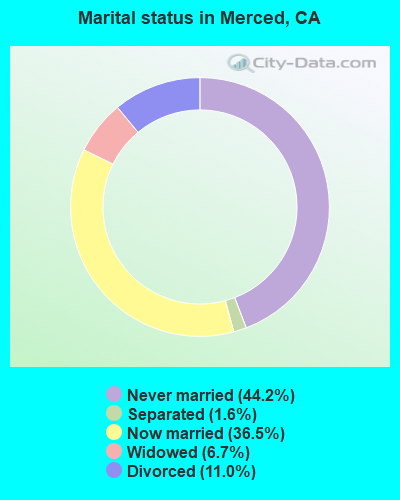
- Never married: 44.2%
- Now married: 36.5%
- Separated: 1.6%
- Widowed: 6.7%
- Divorced: 11.0%
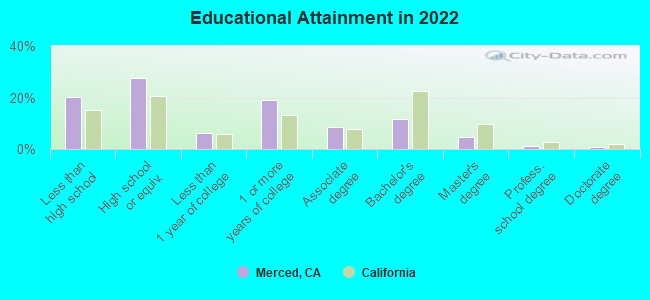
For population 25 years and over in Merced:
- High school or higher: 79.8%
- Bachelor's degree or higher: 18.4%
- Graduate or professional degree: 6.8%
- Unemployed: 13.1%
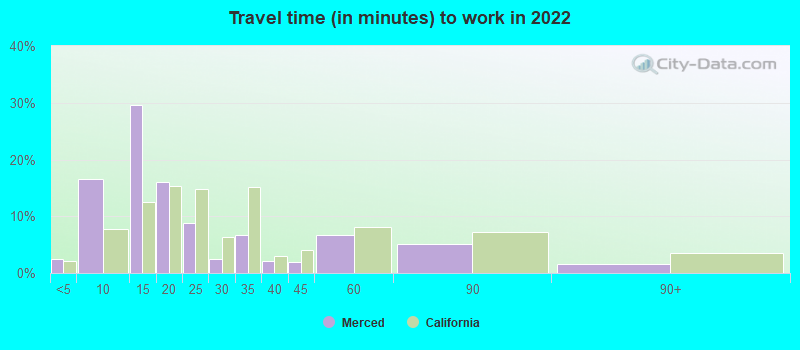
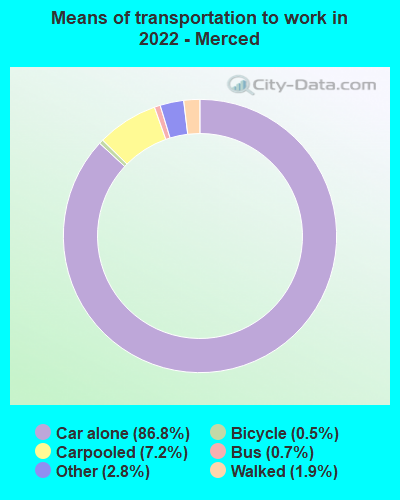
- Mean travel time to work (commute): 22.4 minutes
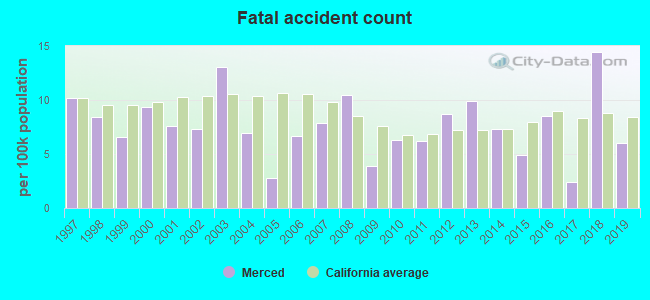
| Here: | 16.5 |
| California average: | 15.5 |
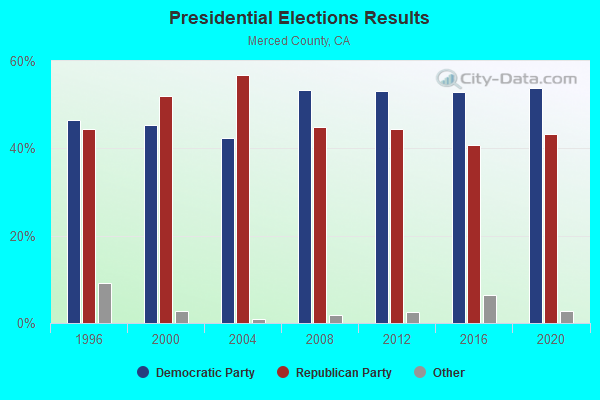
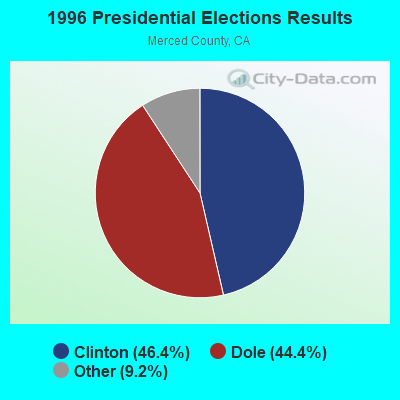
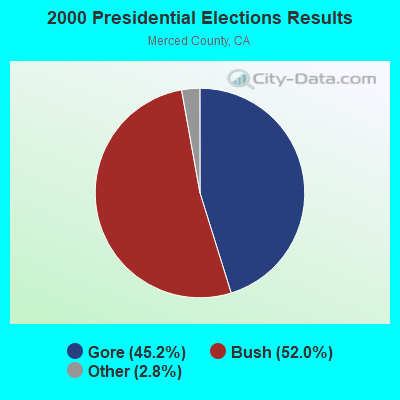
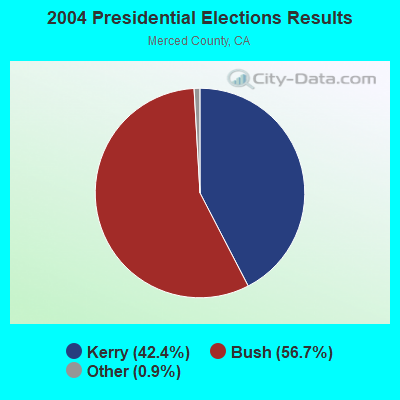
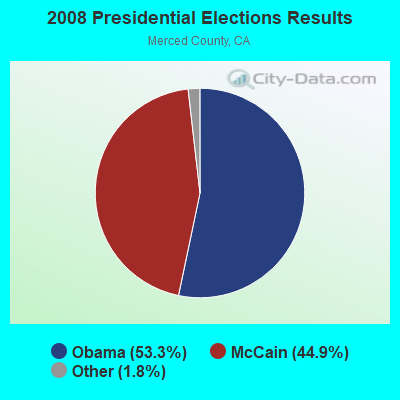
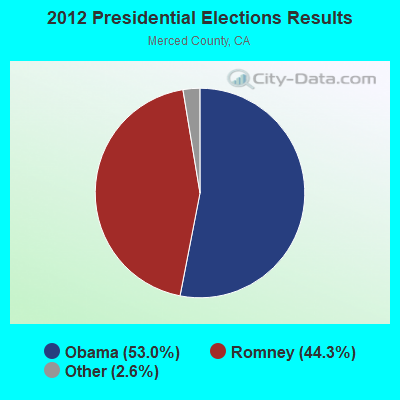
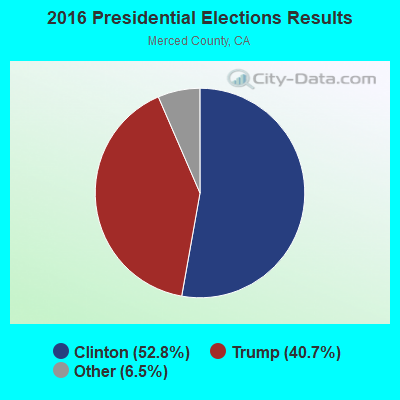

Graphs represent county-level data. Detailed 2008 Election Results
Religion statistics for Merced, CA (based on Merced County data)
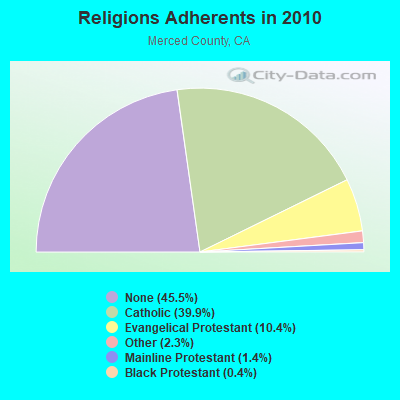
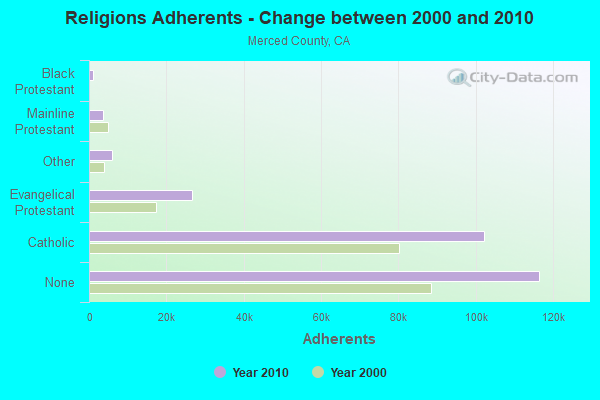
| Religion | Adherents | Congregations |
|---|---|---|
| Catholic | 102,005 | 18 |
| Evangelical Protestant | 26,640 | 124 |
| Other | 5,884 | 23 |
| Mainline Protestant | 3,673 | 18 |
| Black Protestant | 1,087 | 8 |
| Orthodox | 64 | 1 |
| None | 116,440 | - |
Food Environment Statistics:
| Merced County: | 2.37 / 10,000 pop. |
| California: | 2.14 / 10,000 pop. |
| Merced County: | 0.04 / 10,000 pop. |
| California: | 0.04 / 10,000 pop. |
| Merced County: | 1.06 / 10,000 pop. |
| California: | 0.62 / 10,000 pop. |
| This county: | 2.17 / 10,000 pop. |
| California: | 1.49 / 10,000 pop. |
| Here: | 4.09 / 10,000 pop. |
| California: | 7.42 / 10,000 pop. |
| Merced County: | 6.9% |
| California: | 7.3% |
| Here: | 29.5% |
| State: | 21.3% |
| Here: | 17.8% |
| California: | 17.9% |
Health and Nutrition:
| Merced: | 47.2% |
| State: | 49.4% |
| Here: | 45.5% |
| California: | 48.0% |
| Merced: | 28.3 |
| State: | 28.1 |
| Merced: | 22.2% |
| California: | 20.2% |
| Merced: | 11.5% |
| California: | 11.2% |
| Merced: | 6.8 |
| California: | 6.8 |
| Merced: | 31.6% |
| California: | 31.5% |
| This city: | 54.5% |
| State: | 56.4% |
| Merced: | 80.5% |
| California: | 80.9% |
More about Health and Nutrition of Merced, CA Residents
| Local government employment and payroll (March 2022) | |||||
| Function | Full-time employees | Monthly full-time payroll | Average yearly full-time wage | Part-time employees | Monthly part-time payroll |
|---|---|---|---|---|---|
| Police Protection - Officers | 94 | $921,424 | $117,629 | 0 | $0 |
| Other and Unallocable | 68 | $417,845 | $73,737 | 9 | $14,756 |
| Firefighters | 61 | $578,728 | $113,848 | 0 | $0 |
| Solid Waste Management | 45 | $248,264 | $66,204 | 4 | $8,461 |
| Police - Other | 38 | $199,452 | $62,985 | 10 | $11,430 |
| Sewerage | 37 | $227,936 | $73,925 | 4 | $8,208 |
| Financial Administration | 31 | $203,163 | $78,644 | 2 | $4,466 |
| Water Supply | 27 | $171,988 | $76,439 | 1 | $2,469 |
| Streets and Highways | 18 | $97,573 | $65,049 | 1 | $2,115 |
| Parks and Recreation | 16 | $85,793 | $64,345 | 30 | $34,284 |
| Other Government Administration | 10 | $77,730 | $93,276 | 0 | $0 |
| Judicial and Legal | 4 | $31,620 | $94,860 | 0 | $0 |
| Airports | 3 | $21,036 | $84,144 | 1 | $421 |
| Housing and Community Development (Local) | 3 | $18,678 | $74,712 | 0 | $0 |
| Fire - Other | 3 | $17,068 | $68,272 | 0 | $0 |
| Totals for Government | 458 | $3,318,295 | $86,942 | 62 | $86,609 |
Merced government finances - Expenditure in 2017 (per resident):
- Construction - Regular Highways: $12,301,000 ($134.34)
Housing and Community Development: $5,357,000 ($58.51)
Parks and Recreation: $2,292,000 ($25.03)
Central Staff Services: $459,000 ($5.01)
- Current Operations - Police Protection: $20,607,000 ($225.06)
Solid Waste Management: $12,154,000 ($132.74)
Local Fire Protection: $11,372,000 ($124.20)
Sewerage: $10,364,000 ($113.19)
Water Utilities: $10,288,000 ($112.36)
Central Staff Services: $6,731,000 ($73.51)
Regular Highways: $3,500,000 ($38.23)
Financial Administration: $3,447,000 ($37.65)
Protective Inspection and Regulation - Other: $2,866,000 ($31.30)
Parks and Recreation: $2,859,000 ($31.22)
Housing and Community Development: $2,588,000 ($28.26)
Health - Other: $1,077,000 ($11.76)
Air Transportation: $515,000 ($5.62)
Parking Facilities: $118,000 ($1.29)
- General - Interest on Debt: $1,157,000 ($12.64)
- Intergovernmental to Local - Other - Solid Waste Management: $2,571,000 ($28.08)
Other - Natural Resources - Other: $2,132,000 ($23.28)
Other - Health - Other: $220,000 ($2.40)
- Intergovernmental to State - Sewerage: $149,000 ($1.63)
- Other Capital Outlay - Sewerage: $1,771,000 ($19.34)
General - Other: $361,000 ($3.94)
Protective Inspection and Regulation - Other: $58,000 ($0.63)
- Water Utilities - Interest on Debt: $256,000 ($2.80)
Merced government finances - Revenue in 2017 (per resident):
- Charges - Sewerage: $19,145,000 ($209.09)
Solid Waste Management: $13,229,000 ($144.48)
Other: $9,237,000 ($100.88)
Regular Highways: $802,000 ($8.76)
Housing and Community Development: $536,000 ($5.85)
Air Transportation: $438,000 ($4.78)
Parks and Recreation: $238,000 ($2.60)
Parking Facilities: $99,000 ($1.08)
- Federal Intergovernmental - Other: $1,195,000 ($13.05)
Housing and Community Development: $856,000 ($9.35)
Air Transportation: $124,000 ($1.35)
- Miscellaneous - Special Assessments: $1,473,000 ($16.09)
Interest Earnings: $699,000 ($7.63)
Fines and Forfeits: $440,000 ($4.81)
General Revenue - Other: $410,000 ($4.48)
Rents: $182,000 ($1.99)
Donations From Private Sources: $152,000 ($1.66)
Sale of Property: $4,000 ($0.04)
- Revenue - Water Utilities: $13,207,000 ($144.24)
- State Intergovernmental - Other: $3,048,000 ($33.29)
Highways: $1,524,000 ($16.64)
Water Utilities: $995,000 ($10.87)
General Local Government Support: $63,000 ($0.69)
Sewerage: $10,000 ($0.11)
- Tax - General Sales and Gross Receipts: $18,291,000 ($199.76)
Property: $13,954,000 ($152.40)
Public Utilities Sales: $1,628,000 ($17.78)
Other Selective Sales: $1,609,000 ($17.57)
Occupation and Business License - Other: $1,281,000 ($13.99)
Other License: $1,206,000 ($13.17)
Other: $454,000 ($4.96)
Documentary and Stock Transfer: $187,000 ($2.04)
Merced government finances - Debt in 2017 (per resident):
- Long Term Debt - Beginning Outstanding - Unspecified Public Purpose: $53,225,000 ($581.29)
Outstanding Unspecified Public Purpose: $49,593,000 ($541.63)
Retired Unspecified Public Purpose: $3,631,000 ($39.66)
Merced government finances - Cash and Securities in 2017 (per resident):
- Bond Funds - Cash and Securities: $3,208,000 ($35.04)
- Other Funds - Cash and Securities: $185,230,000 ($2022.98)
- Sinking Funds - Cash and Securities: $4,008,000 ($43.77)
| Businesses in Merced, CA | ||||
| Name | Count | Name | Count | |
|---|---|---|---|---|
| 7-Eleven | 4 | Kohl's | 1 | |
| 99 Cents Only Stores | 1 | Lane Bryant | 1 | |
| AT&T | 3 | Lane Furniture | 1 | |
| Aeropostale | 1 | Little Caesars Pizza | 2 | |
| Applebee's | 1 | Long John Silver's | 1 | |
| AutoZone | 1 | Lowe's | 1 | |
| Barnes & Noble | 1 | Marriott | 1 | |
| Baskin-Robbins | 1 | Mazda | 1 | |
| Bath & Body Works | 1 | McDonald's | 5 | |
| Best Western | 1 | Men's Wearhouse | 1 | |
| Big O Tires | 1 | Motel 6 | 1 | |
| Blockbuster | 1 | New Balance | 1 | |
| Budget Car Rental | 1 | New York & Co | 1 | |
| Burger King | 2 | Nike | 1 | |
| CVS | 2 | Nissan | 1 | |
| Carl\s Jr. | 2 | Pac Sun | 1 | |
| Chevrolet | 1 | Panda Express | 2 | |
| Cold Stone Creamery | 1 | Payless | 2 | |
| Comfort Inn | 1 | Penske | 1 | |
| Costco | 1 | PetSmart | 1 | |
| Cricket Wireless | 5 | Pier 1 Imports | 1 | |
| Curves | 1 | Pizza Hut | 1 | |
| DHL | 1 | Quality | 1 | |
| Days Inn | 1 | Quiznos | 1 | |
| Dennys | 1 | RadioShack | 1 | |
| Domino's Pizza | 1 | Ramada | 1 | |
| El Pollo Loco | 1 | Rite Aid | 2 | |
| FedEx | 10 | SAS Shoes | 1 | |
| Foot Locker | 1 | SONIC Drive-In | 1 | |
| Ford | 1 | Sears | 2 | |
| GNC | 1 | Sprint Nextel | 1 | |
| GameStop | 2 | Staples | 1 | |
| Goodwill | 2 | Starbucks | 4 | |
| H&R Block | 4 | T-Mobile | 5 | |
| Hilton | 1 | Taco Bell | 2 | |
| Hobby Lobby | 1 | Target | 1 | |
| Holiday Inn | 1 | Toyota | 1 | |
| Home Depot | 1 | Travelodge | 1 | |
| HomeTown Buffet | 1 | U-Haul | 2 | |
| Honda | 1 | UPS | 11 | |
| Hot Topic | 1 | Vans | 2 | |
| IHOP | 1 | Volkswagen | 1 | |
| JCPenney | 1 | Walgreens | 2 | |
| Jack In The Box | 2 | Walmart | 1 | |
| Jamba Juice | 1 | Wendy's | 1 | |
| Jones New York | 2 | Wet Seal | 1 | |
| KFC | 2 | |||
Strongest AM radio stations in Merced:
- KVVY (1580 AM; 10 kW; MERCED, CA; Owner: MAPLETON COMMUNICATIONS, LLC)
- KYOS (1480 AM; 5 kW; MERCED, CA; Owner: MAPLETON COMMUNICATIONS, LLC)
- KTIQ (1660 AM; 10 kW; MERCED, CA; Owner: MAPLETON COMMUNICATIONS, LLC)
- KCBC (770 AM; 50 kW; RIVERBANK, CA; Owner: KIERTRON, INC.)
- KMJ (580 AM; 50 kW; FRESNO, CA; Owner: INFINITY RADIO OPERATIONS INC.)
- KLOC (1390 AM; 5 kW; TURLOCK, CA)
- KLOK (1170 AM; 50 kW; SAN JOSE, CA; Owner: ENTRAVISION HOLDINGS, LLC)
- KGO (810 AM; 50 kW; SAN FRANCISCO, CA; Owner: KGO-AM RADIO, INC.)
- KNBR (680 AM; 50 kW; SAN FRANCISCO, CA; Owner: KNBR LICO, INC.)
- KWRU (940 AM; 50 kW; FRESNO, CA)
- KLBS (1330 AM; 5 kW; LOS BANOS, CA; Owner: ETHNIC RADIO OF LOS BANOS, INC.)
- KHTK (1140 AM; 50 kW; SACRAMENTO, CA; Owner: INFINITY RADIO SUBSIDIARY OPERATIONS INC.)
- KTCT (1050 AM; 50 kW; SAN MATEO, CA; Owner: SUSQUEHANNA RADIO CORP.)
Strongest FM radio stations in Merced:
- KHTN (104.7 FM; LOS BANOS, CA; Owner: BUCKLEY COMMUNICATIONS, INC.)
- KAMB (101.5 FM; MERCED, CA; Owner: CENTRAL VALLEY BROADCASTING CO. INC.)
- KBRE (92.5 FM; ATWATER, CA; Owner: MAPLETON COMMUNICATIONS, LLC)
- KIBG (106.3 FM; MERCED, CA; Owner: MAPLETON COMMUNICATIONS, LLC)
- KLVY (91.1 FM; FAIRMEAD, CA; Owner: EDUCATIONAL MEDIA FOUNDATION)
- KEFR (89.9 FM; LE GRAND, CA; Owner: FAMILY STATIONS, INC.)
- KUBB (96.3 FM; MARIPOSA, CA; Owner: BUCKLEY BROADCASTING CORP. OF MONTEREY INC)
- KCIV (99.9 FM; MOUNT BULLION, CA; Owner: BOTT COMMUNICATIONS, INC.)
- KLOQ-FM (98.7 FM; WINTON, CA; Owner: MAPLETON COMMUNICATIONS, LLC)
- KMPO (88.7 FM; MODESTO, CA; Owner: RADIO BILINGUE, INC.)
- KDJK (103.9 FM; MARIPOSA, CA; Owner: CITADEL BROADCASTING COMPANY)
- K214CT (90.7 FM; MARIPOSA, CA; Owner: CALVARY CHAPEL OF TWIN FALLS, INC.)
- KABX-FM (97.5 FM; MERCED, CA; Owner: MAPLETON COMMUNICATIONS, LLC)
- KHOP (95.1 FM; OAKDALE, CA; Owner: CITADEL BROADCASTING COMPANY)
- K238AC (95.5 FM; SALIDA, CA; Owner: FAMILY STATIONS, INC.)
- KUOP (91.3 FM; STOCKTON, CA; Owner: UNIVERSITY OF THE PACIFIC)
- KMGV (97.9 FM; FRESNO, CA; Owner: INFINITY RADIO OPERATIONS INC.)
- KOSO (93.1 FM; PATTERSON, CA; Owner: CAPSTAR TX LIMITED PARTNERSHIP)
- KCJH (89.1 FM; LIVINGSTON, CA; Owner: YOUR CHRISTIAN COMPANION NETWORK, INC.)
- KKBN (93.5 FM; TWAIN HARTE, CA; Owner: CLARKE BROADCASTING CORPORATION)
TV broadcast stations around Merced:
- K49EO (Channel 49; MODESTO, CA; Owner: TRINITY BROADCASTING NETWORK)
- KBSV (Channel 23; CERES, CA; Owner: BET-NAHRAIN, INC.)
Medal of Honor Recipients
Medal of Honor Recipient born in Merced: Albert Moore.
- National Bridge Inventory (NBI) Statistics
- 131Number of bridges
- 1,253ft / 382mTotal length
- $3,234,000Total costs
- 1,426,891Total average daily traffic
- 183,251Total average daily truck traffic
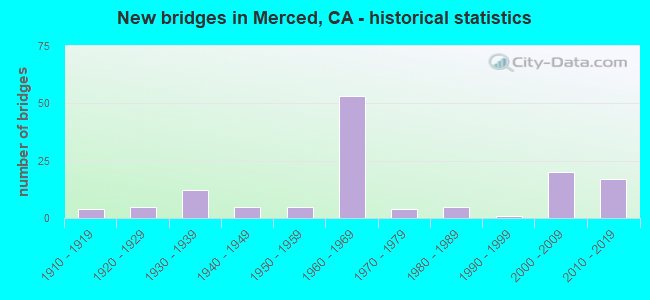
- New bridges - historical statistics
- 41910-1919
- 51920-1929
- 121930-1939
- 51940-1949
- 51950-1959
- 531960-1969
- 41970-1979
- 51980-1989
- 11990-1999
- 202000-2009
- 172010-2019
FCC Registered Antenna Towers: 371 (See the full list of FCC Registered Antenna Towers)
FCC Registered Private Land Mobile Towers: 15 (See the full list of FCC Registered Private Land Mobile Towers in Merced, CA)
FCC Registered Broadcast Land Mobile Towers: 72 (See the full list of FCC Registered Broadcast Land Mobile Towers)
FCC Registered Microwave Towers: 96 (See the full list of FCC Registered Microwave Towers in this town)
FCC Registered Paging Towers: 20 (See the full list of FCC Registered Paging Towers)
FCC Registered Maritime Coast & Aviation Ground Towers: 5 (See the full list of FCC Registered Maritime Coast & Aviation Ground Towers)
FCC Registered Amateur Radio Licenses: 246 (See the full list of FCC Registered Amateur Radio Licenses in Merced)
FAA Registered Aircraft Manufacturers and Dealers: 3 (See the full list of FAA Registered Manufacturers and Dealers in Merced)
FAA Registered Aircraft: 88 (See the full list of FAA Registered Aircraft)
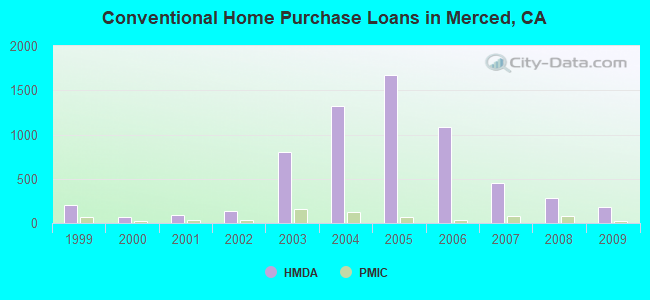
| Home Mortgage Disclosure Act Aggregated Statistics For Year 2009 (Based on 8 full and 11 partial tracts) | ||||||||||||||
| A) FHA, FSA/RHS & VA Home Purchase Loans | B) Conventional Home Purchase Loans | C) Refinancings | D) Home Improvement Loans | E) Loans on Dwellings For 5+ Families | F) Non-occupant Loans on < 5 Family Dwellings (A B C & D) | G) Loans On Manufactured Home Dwelling (A B C & D) | ||||||||
|---|---|---|---|---|---|---|---|---|---|---|---|---|---|---|
| Number | Average Value | Number | Average Value | Number | Average Value | Number | Average Value | Number | Average Value | Number | Average Value | Number | Average Value | |
| LOANS ORIGINATED | 285 | $126,079 | 185 | $109,614 | 191 | $167,687 | 20 | $58,233 | 2 | $1,290,455 | 106 | $93,576 | 0 | $0 |
| APPLICATIONS APPROVED, NOT ACCEPTED | 21 | $116,933 | 29 | $124,476 | 34 | $161,271 | 0 | $0 | 0 | $0 | 20 | $112,550 | 0 | $0 |
| APPLICATIONS DENIED | 46 | $125,228 | 50 | $98,778 | 169 | $158,498 | 17 | $61,874 | 1 | $52,000 | 61 | $100,129 | 2 | $140,845 |
| APPLICATIONS WITHDRAWN | 34 | $132,993 | 36 | $113,603 | 71 | $177,098 | 3 | $110,987 | 0 | $0 | 29 | $116,335 | 0 | $0 |
| FILES CLOSED FOR INCOMPLETENESS | 5 | $119,560 | 8 | $117,822 | 29 | $154,546 | 3 | $126,370 | 0 | $0 | 6 | $90,340 | 0 | $0 |
Detailed mortgage data for all 19 tracts in Merced, CA
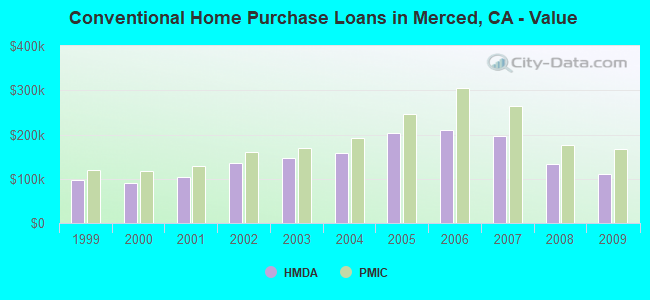
| Private Mortgage Insurance Companies Aggregated Statistics For Year 2009 (Based on 4 full and 10 partial tracts) | ||||||
| A) Conventional Home Purchase Loans | B) Refinancings | C) Non-occupant Loans on < 5 Family Dwellings (A & B) | ||||
|---|---|---|---|---|---|---|
| Number | Average Value | Number | Average Value | Number | Average Value | |
| LOANS ORIGINATED | 18 | $167,737 | 1 | $247,090 | 2 | $143,725 |
| APPLICATIONS APPROVED, NOT ACCEPTED | 6 | $211,518 | 1 | $238,950 | 1 | $199,230 |
| APPLICATIONS DENIED | 2 | $99,690 | 0 | $0 | 1 | $92,980 |
| APPLICATIONS WITHDRAWN | 0 | $0 | 3 | $312,137 | 0 | $0 |
| FILES CLOSED FOR INCOMPLETENESS | 1 | $185,950 | 0 | $0 | 0 | $0 |
2005 - 2018 National Fire Incident Reporting System (NFIRS) incidents
- Fire incident types reported to NFIRS in Merced, CA
- 2,73060.5%Outside Fires
- 1,16425.8%Structure Fires
- 54812.1%Mobile Property/Vehicle Fires
- 731.6%Other
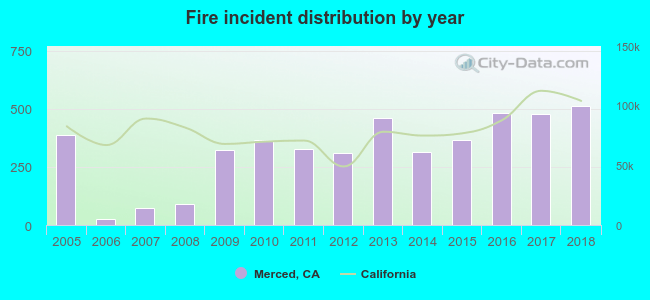 Based on the data from the years 2005 - 2018 the average number of fires per year is 322. The highest number of fires - 514 took place in 2018, and the least - 27 in 2006. The data has an increasing trend.
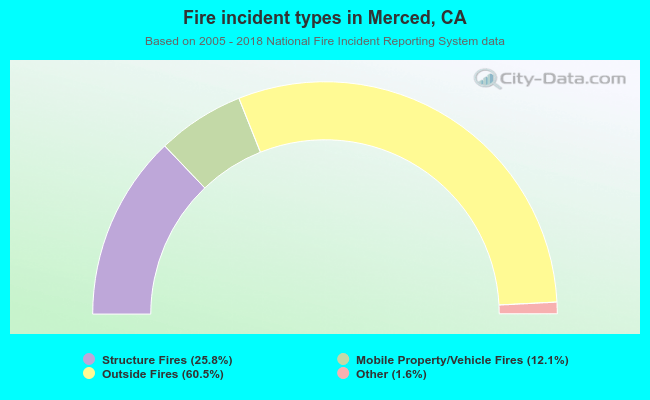 When looking into fire subcategories, the most reports belonged to: Outside Fires (60.5%), and Structure Fires (25.8%).
Fire-safe hotels and motels in Merced, California:
- Motel 6, #1029, 1410 V St, Merced, California 95340 , Phone: (209) 384-2181
- Days Inn Yosemite Area, 1215 R St, Merced, California 95341 , Phone: (209) 580-4838, Fax: (209) 580-4609
- Americas Best Value Inn, 1213 V St, Merced, California 95340 , Phone: (209) 723-3711, Fax: (209) 722-8551
- Travelodge, 1260 Yosemite Pkwy, Merced, California 95340 , Phone: (209) 722-6224, Fax: (209) 726-3224
- Comfort Inn Merced, 730 Motel Dr, Merced, California 95341 , Phone: (209) 383-0333, Fax: (209) 383-0643
- Super 8, 1983 Childs Ave, Merced, California 95340 , Phone: (209) 384-1303, Fax: (209) 384-1304
- Best Western Inn, 1033 Motel Dr, Merced, California 95340 , Phone: (209) 723-2163, Fax: (209) 384-7272
- Courtyard By Marriott Merced, 750 Motel Dr, Merced, California 95340 , Phone: (209) 725-1221, Fax: (209) 725-1222
- 5 other hotels and motels
| Most common first names in Merced, CA among deceased individuals | ||
| Name | Count | Lived (average) |
|---|---|---|
| Mary | 377 | 79.5 years |
| John | 355 | 75.1 years |
| Robert | 271 | 70.3 years |
| William | 262 | 75.0 years |
| James | 217 | 69.9 years |
| George | 164 | 74.1 years |
| Frank | 154 | 76.7 years |
| Charles | 133 | 72.9 years |
| Helen | 131 | 80.0 years |
| Dorothy | 124 | 76.9 years |
| Most common last names in Merced, CA among deceased individuals | ||
| Last name | Count | Lived (average) |
|---|---|---|
| Smith | 124 | 76.6 years |
| Johnson | 107 | 75.2 years |
| Jones | 99 | 74.0 years |
| Garcia | 99 | 74.0 years |
| Williams | 96 | 77.2 years |
| Brown | 95 | 76.3 years |
| Martinez | 83 | 72.0 years |
| Davis | 64 | 71.6 years |
| Lee | 59 | 71.7 years |
| Miller | 56 | 73.5 years |
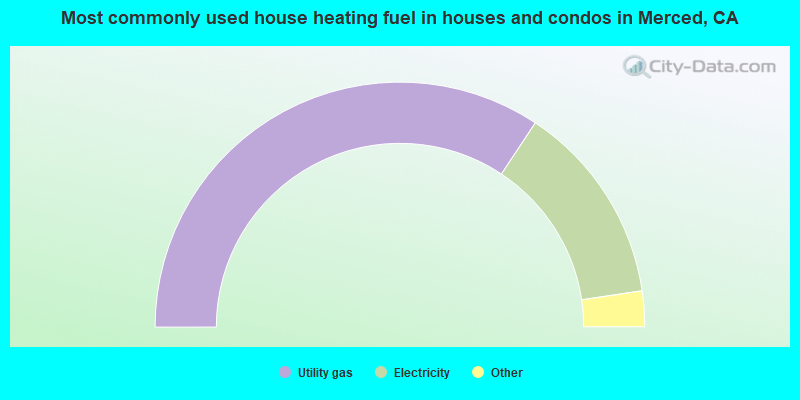
- 68.7%Utility gas
- 26.7%Electricity
- 2.5%Solar energy
- 1.6%Bottled, tank, or LP gas
- 0.3%Wood
- 0.2%No fuel used
- 0.1%Fuel oil, kerosene, etc.
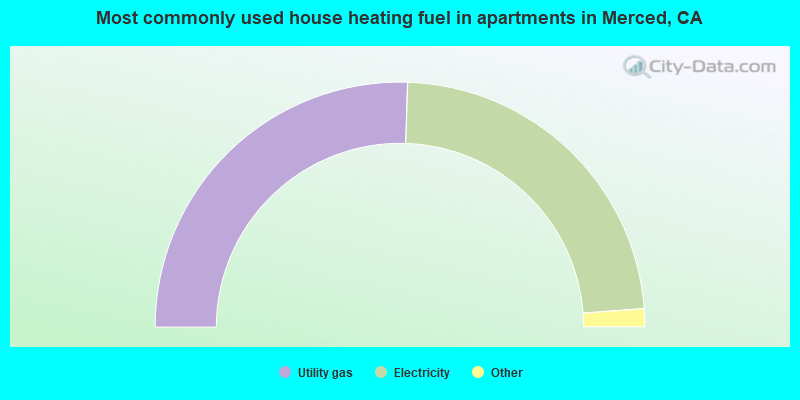
- 51.0%Utility gas
- 46.6%Electricity
- 0.9%Bottled, tank, or LP gas
- 0.9%No fuel used
- 0.3%Wood
- 0.1%Solar energy
- 0.1%Other fuel
Merced compared to California state average:
- Median house value below state average.
- Hispanic race population percentage above state average.
- Length of stay since moving in significantly below state average.
Merced on our top lists:
- #2 on the list of "Top 101 cities with the largest city-data.com crime index increase from 2011 to 2012 (population 50,000+)"
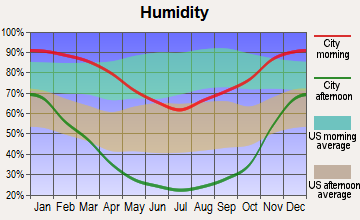
- #5 on the list of "Top 101 cities with the largest differences between morning and afternoon humidity (population 50,000+)"
- #5 on the list of "Top 101 cities with the largest humidity differences during a year (population 50,000+)"
- #8 on the list of "Top 101 cities with largest percentage of males in occupations: farming, fishing, and forestry occupations (population 50,000+)"
- #8 on the list of "Top 101 cities with largest percentage of males in occupations: material moving occupations (population 50,000+)"
- #10 on the list of "Top 101 cities with largest percentage of females in occupations: farming, fishing, and forestry occupations (population 50,000+)"
- #12 on the list of "Top 101 cities with the largest city-data.com crime index per police officer (population 50,000+)"
- #13 on the list of "Top 101 cities with largest percentage of males in industries: agriculture, forestry, fishing and hunting (population 50,000+)"
- #14 on the list of "Top 101 cities with largest percentage of females in industries: agriculture, forestry, fishing and hunting (population 50,000+)"
- #14 on the list of "Top 101 cities with the largest sunshine amount differences during a year (population 50,000+)"
- #18 on the list of "Top 101 cities with largest percentage of females in industries: construction (population 50,000+)"
- #23 on the list of "Top 101 cities with largest percentage of females in occupations: education, training, and library occupations (population 50,000+)"
- #23 on the list of "Top 101 cities with the highest number of arson incidents per 100,000 residents, excludes tourist destinations and others with a lot of outsiders visiting based on city industries data (population 50,000+)"
- #23 on the list of "Top 101 cities with the highest average snowfall in a year (population 50,000+)"
- #26 on the list of "Top 101 cities with largest percentage of females in industries: educational services (population 50,000+)"
- #29 on the list of "Top 101 cities with the smallest percentage of high school students in private schools (3,000+ students)"
- #29 on the list of "Top 100 high-educated but low-earning cities (pop. 50,000+)"
- #33 on the list of "Top 101 cities with largest percentage of females in occupations: community and social service occupations (population 50,000+)"
- #33 on the list of "Top 101 cities with the highest number of days clear of clouds (population 50,000+)"
- #33 on the list of "Top 101 cities with the lowest number of days clear of clouds (population 50,000+)"
- #28 on the list of "Top 101 counties with the lowest surface withdrawal of fresh water for public supply (pop. 50,000+)"
- #30 on the list of "Top 101 counties with the highest number of births per 1000 residents 2007-2013"
- #49 on the list of "Top 101 counties with the highest ground withdrawal of fresh water for public supply"
- #82 on the list of "Top 101 counties with the lowest number of deaths per 1000 residents 2007-2013 (pop. 50,000+)"
- #85 on the list of "Top 101 counties with the highest Particulate Matter (PM2.5) Annual air pollution readings in 2012 (µg/m3)"

|
|
Total of 144 patent applications in 2008-2024.