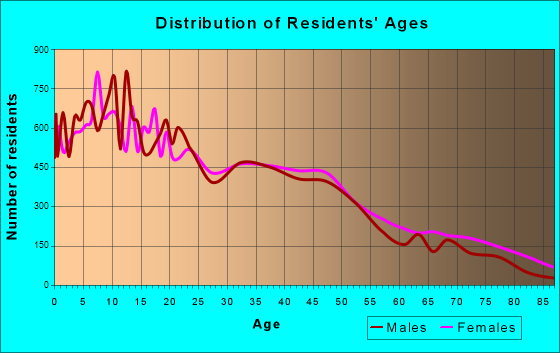
Merced, CA (California) Houses and Residents
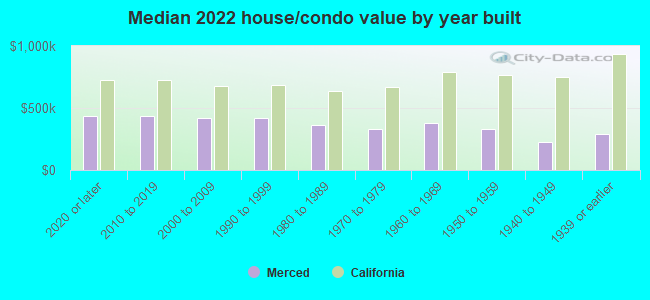
| Merced: | $380,000 |
| California: | $715,900 |
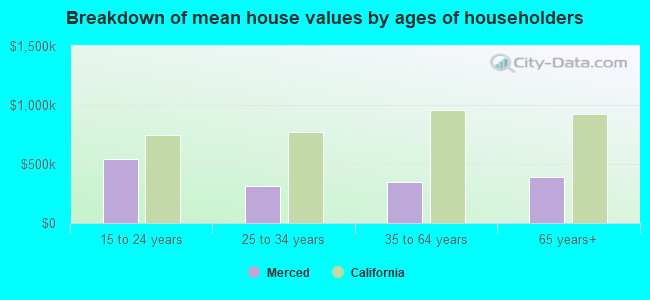
Mean price in 2022:
Detached houses: $354,656
Here: $354,656 State: $988,808 Townhouses or other attached units: $351,202
Here: $351,202 State: $838,546 In 2-unit structures: $506,230
Here: $506,230 State: $1,138,100 In 5-or-more-unit structures: $580,221
Here: $580,221 State: $730,996 Mobile homes: $60,491
Here: $60,491 State: $184,506
Total population: 81,743 (Urban population: 63,729, Rural population: 262 (14 farm, 248 nonfarm))
Houses: 29,943 (29,161 occupied: 14,358 owner occupied, 14,803 renter occupied)
| % of renters here: | 51% |
| State: | 44% |
Housing density: 1,507 houses/condos per square mile
Median price asked for vacant for-sale houses and condos in 2022: $275,350.
Median contract rent in 2022: $1,045 (lower quartile is $803, upper quartile is $1,442)
Median rent asked for vacant for-rent units in 2022: $859
Median gross rent in Merced, CA in 2022: $1,305
Housing units in Merced with a mortgage: 10,343 (404 second mortgage, 0 home equity loan, 210 both second mortgage and home equity loan)
Houses without a mortgage: 33
Median household income for houses/condos with a mortgage: $88,668
Median household income for apartments without a mortgage: $70,559
Median monthly housing costs: $1,359
Compare current foreclosures in Merced, CA:
| Photo | Address | Area | Beds / Baths | Price | Details |
|---|---|---|---|---|---|

|
#1
Harp Ct
Merced, CA 95341
|
- sq. feet
|
2 baths 4 beds |
show details | |

|
#2
Oakhurst Ave
Merced, CA 95340
|
1,176 sq. feet
|
2 baths 3 beds |
show details | |

|
#3
Cowden Ave
Merced, CA 95348
|
1,436 sq. feet
|
2 baths 3 beds |
show details | |

|
#4
El Portal Dr
Merced, CA 95340
|
2,410 sq. feet
|
3 baths 4 beds |
show details | |

|
#5
Fairfax Ct
Merced, CA 95348
|
1,378 sq. feet
|
2 baths 3 beds |
show details | |

|
#6
Cheyenne Dr
Merced, CA 95348
|
1,147 sq. feet
|
2 baths 3 beds |
show details | |

|
#7
Creekside Dr
Merced, CA 95348
|
1,290 sq. feet
|
2 baths 3 beds |
show details | |

|
#8
Wren Ct
Merced, CA 95340
|
1,621 sq. feet
|
2 baths 3 beds |
show details | |

|
#9
Green St
Merced, CA 95340
|
1,264 sq. feet
|
2 baths 3 beds |
show details | |

|
#10
Carol Ave
Merced, CA 95341
|
878 sq. feet
|
1 baths 1 beds |
show details |
| Photo | Address | Area | Beds / Baths | Price | Details |
|---|---|---|---|---|---|

|
#11
W 21st St
Merced, CA 95340
|
1,537 sq. feet
|
1 baths 3 beds |
show details | |

|
#12
La Jolla Dr
Merced, CA 95348
|
1,412 sq. feet
|
2 baths 3 beds |
show details | |

|
#13
Dinkey Creek Ave
Merced, CA 95341
|
1,595 sq. feet
|
2 baths 3 beds |
show details | |

|
#14
Bedford Dr
Merced, CA 95340
|
2,073 sq. feet
|
3 baths 4 beds |
show details | |

|
#15
Swan Ct
Merced, CA 95340
|
1,434 sq. feet
|
2 baths 3 beds |
show details | |

|
#16
Azalea Ct
Merced, CA 95341
|
1,272 sq. feet
|
2 baths 3 beds |
show details | |

|
#17
R St
Merced, CA 95340
|
1,227 sq. feet
|
2 baths 3 beds |
show details | |

|
#18
Casual Ct
Merced, CA 95340
|
2,036 sq. feet
|
2 baths 4 beds |
show details | |

|
#19
Cherokee Ave
Merced, CA 95340
|
1,706 sq. feet
|
2 baths 4 beds |
show details | |

|
#20
Birchwood Ct
Merced, CA 95341
|
1,603 sq. feet
|
2 baths 3 beds |
show details |
| Photo | Address | Area | Beds / Baths | Price | Details |
|---|---|---|---|---|---|

|
#21
Swan Ct
Merced, CA 95340
|
1,823 sq. feet
|
2 baths 3 beds |
show details | |

|
#22
Vega Ct
Merced, CA 95341
|
1,187 sq. feet
|
2 baths 3 beds |
show details | |

|
#23
Mathias Way
Merced, CA 95348
|
1,663 sq. feet
|
2 baths 3 beds |
show details | |

|
#24
Gettysburg Ave
Merced, CA 95340
|
2,106 sq. feet
|
2 baths 4 beds |
show details | |

|
#25
K St
Merced, CA 95341
|
3,000 sq. feet
|
4 baths 8 beds |
show details | |

|
#26
Jacobs Dr
Merced, CA 95348
|
1,832 sq. feet
|
3 baths 4 beds |
show details | |

|
#27
San Isidro Ave
Merced, CA 95348
|
2,170 sq. feet
|
2 baths 4 beds |
show details | |

|
#28
El Camino Real
Merced, CA 95340
|
1,757 sq. feet
|
2 baths 3 beds |
show details | |

|
#29
Occidental Ct
Merced, CA 95348
|
1,120 sq. feet
|
2 baths 3 beds |
show details | |

|
#30
Princeton Ct
Merced, CA 95348
|
1,577 sq. feet
|
2 baths 3 beds |
show details |
| Photo | Address | Area | Beds / Baths | Price | Details |
|---|---|---|---|---|---|

|
#31
Merced Ave
Merced, CA 95341
|
1,141 sq. feet
|
1 baths 2 beds |
show details | |

|
#32
Gove Rd
Merced, CA 95341
|
560 sq. feet
|
1 baths 2 beds |
show details | |

|
#33
La Purisima St
Merced, CA 95341
|
1,277 sq. feet
|
2 baths 4 beds |
show details | |

|
#34
W 23rd St
Merced, CA 95340
|
996 sq. feet
|
1 baths 2 beds |
show details | |

|
#35
Constitution Ct
Merced, CA 95341
|
1,022 sq. feet
|
2 baths 3 beds |
show details | |

|
#36
Ellison Pl
Merced, CA 95348
|
2,411 sq. feet
|
2 baths 4 beds |
show details | |

|
#37
E 20th St
Merced, CA 95340
|
1,025 sq. feet
|
1 baths 2 beds |
show details | |

|
#38
E Childs Ave
Merced, CA 95341
|
1,429 sq. feet
|
1 baths 2 beds |
show details | |

|
#39
W 22nd St
Merced, CA 95340
|
955 sq. feet
|
1 baths 3 beds |
show details | |

|
#40
Villanova Ct
Merced, CA 95348
|
1,866 sq. feet
|
2 baths 3 beds |
show details |
| Photo | Address | Area | Beds / Baths | Price | Details |
|---|---|---|---|---|---|

|
#41
San Juan Bautista Ave
Merced, CA 95341
|
- sq. feet
|
- baths - beds |
show details | |

|
#42
Denise Dr
Merced, CA 95341
|
- sq. feet
|
- baths - beds |
show details | |

|
#43
Conestoga Dr
Merced, CA 95348
|
- sq. feet
|
- baths - beds |
show details | |

|
#44
Rye St
Merced, CA 95341
|
- sq. feet
|
- baths - beds |
show details | |

|
#45
Pacheco Dr
Merced, CA 95340
|
- sq. feet
|
- baths - beds |
show details | |

|
#46
Rice Ct
Merced, CA 95348
|
- sq. feet
|
- baths - beds |
show details | |

|
#47
S Canal St Apt A
Merced, CA 95341
|
- sq. feet
|
- baths - beds |
show details | |

|
#48
W 11th St
Merced, CA 95341
|
- sq. feet
|
- baths - beds |
show details | |

|
#49
Stonybrook Ave
Merced, CA 95348
|
- sq. feet
|
- baths - beds |
show details | |

|
Check over 1 million property listings on Foreclosure.com!
|
browse all offers | |||

Latest news about housing in Merced, CA collected exclusively by city-data.com from local newspapers, TV, and radio stations


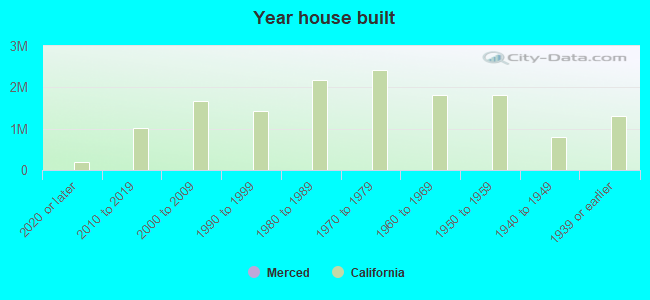
Median year apartment built: 1980
Household type by relationship:
Households: 91,572- Male householders: 13,422 (2,868 living alone), Female householders: 15,739 (4,329 living alone)
11,502 spouses (11,415 opposite-sex spouses), 3,305 unmarried partners, (3,066 opposite-sex unmarried partners), 32,620 children (30,339 natural, 1,009 adopted, 1,272 stepchildren), 3,872 grandchildren, 2,601 brothers or sisters, 2,689 parents, 33 foster children, 2,505 other relatives, 2,158 non-relatives
- In group quarters: 1,126
Size of family households: 6,243 2-persons, 4,842 3-persons, 3,298 4-persons, 3,108 5-persons, 1,530 6-persons, 1,147 7-or-more-persons.
Size of nonfamily households: 7,197 1-person, 1,689 2-persons, 107 3-persons.
12,278 married couples with children.
8,680 single-parent households (2,181 men, 6,499 women).
52.6% of residents of Merced speak English at home.
38.7% of residents speak Spanish at home (67% speak English very well, 10% speak English well, 10% speak English not well, 14% don't speak English at all).
2.3% of residents speak other Indo-European language at home (89% speak English very well, 7% speak English well, 3% speak English not well, 1% don't speak English at all).
6.4% of residents speak Asian or Pacific Island language at home (64% speak English very well, 18% speak English well, 12% speak English not well, 6% don't speak English at all).
0.3% of residents speak other language at home (64% speak English very well, 36% speak English not well).
Foreign born population: 19,320 (21.1%)
(49.7% of them are naturalized citizens)
| Here: | 6.1 |
| State: | 6.0 |
| Here: | 4.5 |
| State: | 3.9 |
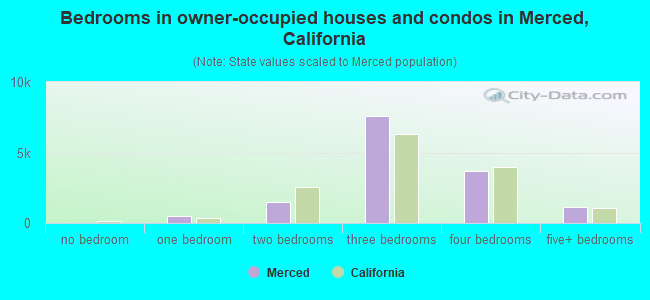
- Bedrooms in owner-occupied houses and condos in Merced, California
- 0no bedroom
- 4771 bedroom
- 1,5062 bedrooms
- 7,5623 bedrooms
- 3,6924 bedrooms
- 1,1215+ bedrooms
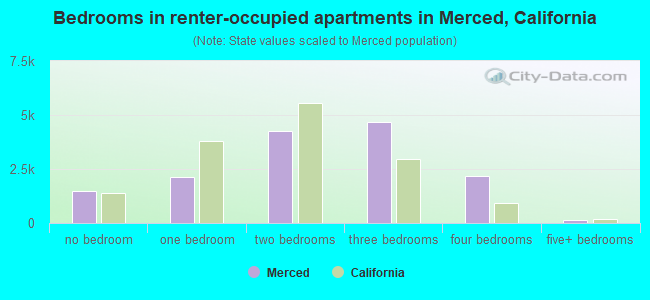
- Bedrooms in renter-occupied apartments in Merced, California
- 1,470no bedroom
- 2,1301 bedroom
- 4,2592 bedrooms
- 4,6593 bedrooms
- 2,1544 bedrooms
- 1315+ bedrooms
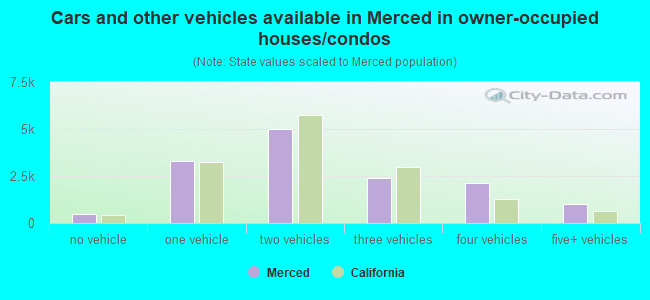
- Cars and other vehicles available in Merced in owner-occupied houses/condos
- 500no vehicle
- 3,2831 vehicle
- 5,0162 vehicles
- 2,4013 vehicles
- 2,1464 vehicles
- 1,0125+ vehicles
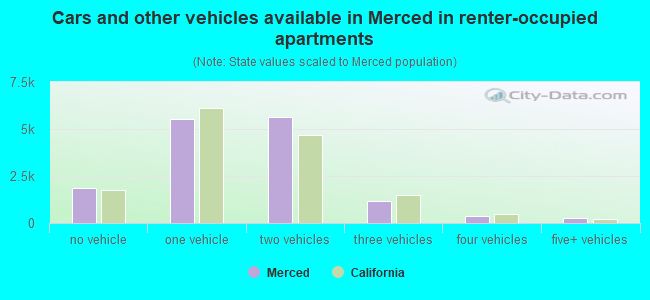
- Cars and other vehicles available in Merced in renter-occupied apartments
- 1,871no vehicle
- 5,5121 vehicle
- 5,6122 vehicles
- 1,1753 vehicles
- 3534 vehicles
- 2805+ vehicles
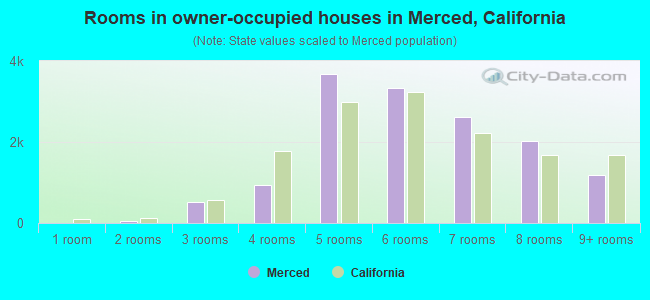
- Rooms in owner-occupied houses in Merced, California
- 01 room
- 542 rooms
- 5173 rooms
- 9354 rooms
- 3,6855 rooms
- 3,3366 rooms
- 2,6237 rooms
- 2,0328 rooms
- 1,1769+ rooms
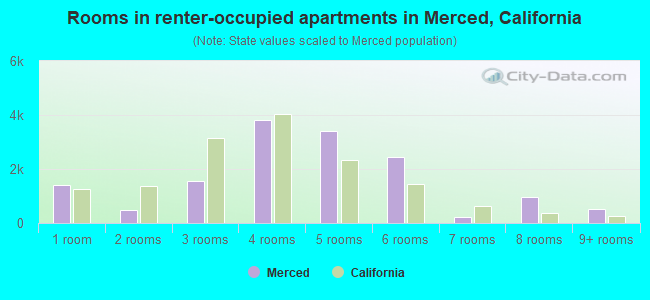
- Rooms in renter-occupied apartments in Merced, California
- 1,3941 room
- 4692 rooms
- 1,5673 rooms
- 3,8234 rooms
- 3,4045 rooms
- 2,4306 rooms
- 2337 rooms
- 9818 rooms
- 5029+ rooms
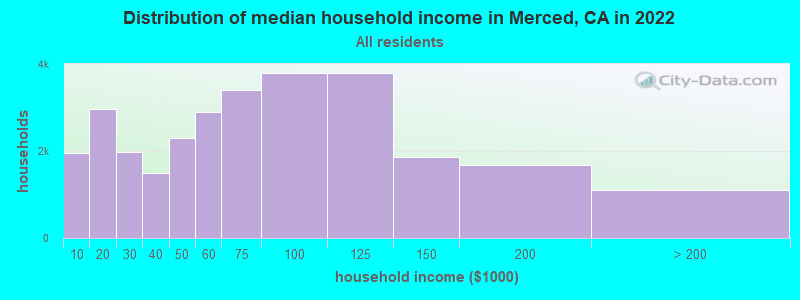
Merced, CA household income distribution

- 1,951Less than $10,000
- 2,971$10,000 to $19,999
- 1,966$20,000 to $29,999
- 1,488$30,000 to $39,999
- 2,290$40,000 to $49,999
- 2,895$50,000 to $59,999
- 3,392$60,000 to $74,999
- 3,799$75,000 to $99,999
- 3,783$100,000 to $124,999
- 1,855$125,000 to $149,999
- 1,667$150,000 to $199,999
- 1,104$200,000 or more
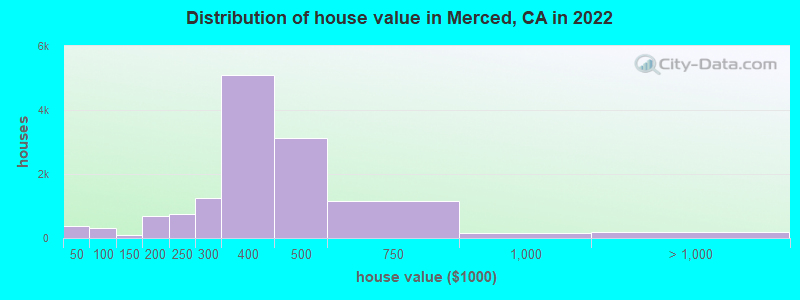
Home value of owner - occupied houses in 2022 in Merced, CA
-
- 56Less than $10,000
- 42$10,000 to $14,999
- 71$15,000 to $19,999
- 47$20,000 to $24,999
- 78$25,000 to $29,999
- 46$30,000 to $34,999
- 15$35,000 to $39,999
- 6$40,000 to $49,999
- 43$50,000 to $59,999
- 65$60,000 to $69,999
- 13$70,000 to $79,999
- 121$80,000 to $89,999
- 57$90,000 to $99,999
- 44$100,000 to $124,999
- 51$125,000 to $149,999
- 330$150,000 to $174,999
- 342$175,000 to $199,999
- 762$200,000 to $249,999
- 1,257$250,000 to $299,999
- 5,109$300,000 to $399,999
- 3,138$400,000 to $499,999
- 1,158$500,000 to $749,999
- 154$750,000 to $999,999
- 90$1,000,000 to $1,499,999
- 46$1,500,000 to $1,999,999
- 65$2,000,000 or more
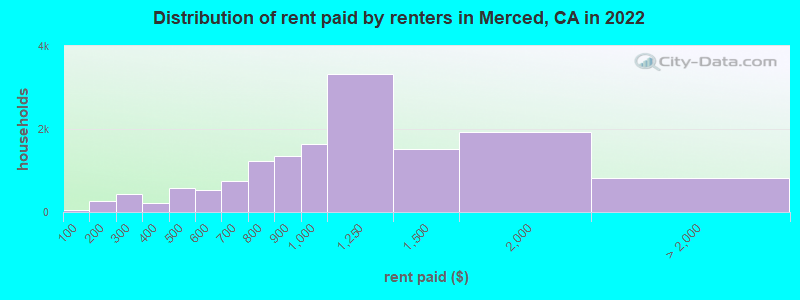
Rent paid by renters in 2022 in Merced, CA
-
- 37Less than $100
- 107$100 to $149
- 152$150 to $199
- 226$200 to $249
- 210$250 to $299
- 80$300 to $349
- 124$350 to $399
- 208$400 to $449
- 372$450 to $499
- 305$500 to $549
- 218$550 to $599
- 351$600 to $649
- 401$650 to $699
- 664$700 to $749
- 555$750 to $799
- 1,339$800 to $899
- 1,649$900 to $999
- 3,337$1,000 to $1,249
- 1,511$1,250 to $1,499
- 1,922$1,500 to $1,999
- 441$2,000 to $2,499
- 105$2,500 to $2,999
- 282No cash rent
Percentage of workers working in this county: 83.7%
Number of people working at home: 2,849 (8.0% of all workers)
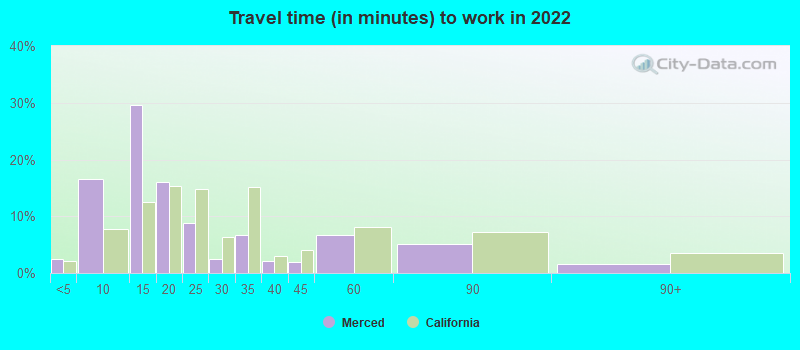
Travel time to work (commute)
- Less than 5 minutes: 418
- 5 to 9 minutes: 5,358
- 10 to 14 minutes: 9,567
- 15 to 19 minutes: 5,566
- 20 to 24 minutes: 3,370
- 25 to 29 minutes: 945
- 30 to 34 minutes: 3,285
- 35 to 39 minutes: 598
- 40 to 44 minutes: 685
- 45 to 59 minutes: 2,086
- 60 to 89 minutes: 1,496
- 90 or more minutes: 1,089
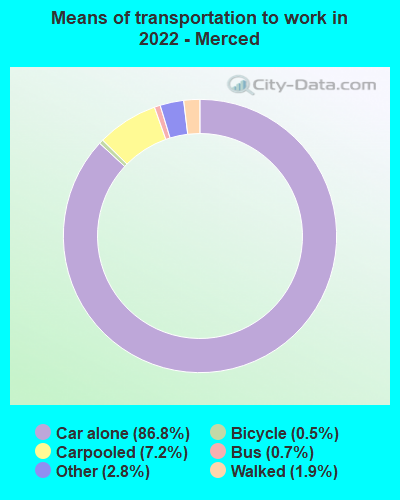
Means of transportation to work:
- Drove a car alone: 26,862 (76.1%)
- Carpooled: 3,427 (9.7%)
- Bus: 172 (0.5%)
- Subway or elevated rail: 12 (0.0%)
- Taxi: 922 (2.6%)
- Bicycle: 155 (0.4%)
- Walked: 582 (1.6%)
- Worked at home: 2,849 (8.1%)
- Unemployment by race in 2022
- Unemployment rate for White non-Hispanic residents
- 12.1%Males
- 10.9%Females
- Unemployment rate for Black residents
- 15.8%Males
- 47.3%Females
- Unemployment rate for American Indian and Alaska Native residents
- 5.5%Males
- 7.6%Females
- Unemployment rate for Asian residents
- 12.2%Males
- 11.8%Females
- Unemployment rate for other race residents
- 8.7%Males
- 18.3%Females
- Unemployment rate for two or more race residents
- 21.8%Males
- 5.4%Females
- Unemployment rate for Hispanic or Latino residents
- 9.7%Males
- 15.4%Females
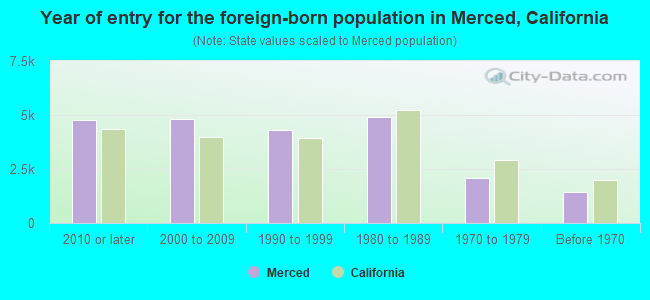
- Year of entry for the foreign-born population in Merced, California
- 4,7762010 or later
- 4,8102000 to 2009
- 4,3261990 to 1999
- 4,9281980 to 1989
- 2,0701970 to 1979
- 1,417Before 1970
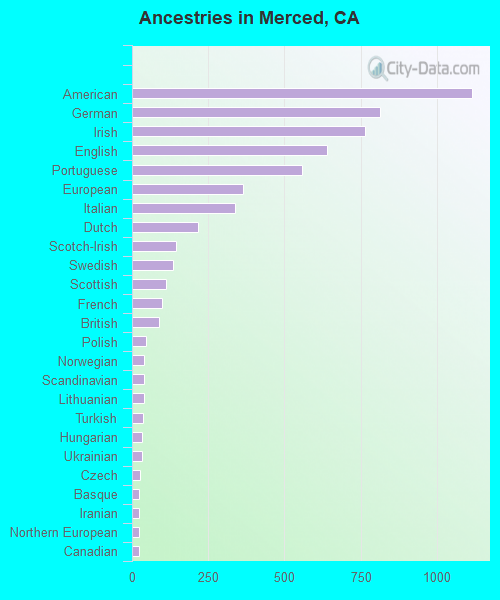
First ancestries reported:
- American: 1,115 (1.9%)
- German: 812 (1.4%)
- Irish: 765 (1.3%)
- English: 640 (1.1%)
- Portuguese: 557 (0.9%)
- European: 363 (0.6%)
- Italian: 337 (0.6%)
- Dutch: 218 (0.4%)
- Scotch-Irish: 145 (0.2%)
- Swedish: 133 (0.2%)
- Scottish: 112 (0.2%)
- French: 98 (0.2%)
- British: 90 (0.2%)
- Polish: 45 (0.08%)
- Norwegian: 39 (0.07%)
- Scandinavian: 39 (0.07%)
- Lithuanian: 38 (0.06%)
- Turkish: 35 (0.06%)
- Hungarian: 33 (0.06%)
- Ukrainian: 33 (0.06%)
- Czech: 25 (0.04%)
- Basque: 24 (0.04%)
- Iranian: 24 (0.04%)
- Northern European: 24 (0.04%)
- Canadian: 22 (0.04%)
- South African: 21 (0.04%)
- Armenian: 12 (0.02%)
- Croatian: 12 (0.02%)
- Somali: 11 (0.02%)
- Slovene: 10 (0.02%)
- Egyptian: 8 (0.01%)
- Russian: 7 (0.01%)
- Danish: 7 (0.01%)
- Jamaican: 7 (0.01%)
- Eastern European: 6 (0.01%)
- African: 6 (0.01%)
- Syrian: 5 (0.01%)
- Welsh: 5 (0.01%)
- Belgian: 4 (0.01%)
- Finnish: 4 (0.01%)
- Swiss: 3 (0.01%)
Most common places of birth for foreign-born residents (%):
| Merced: | 67.0% (13,596) |
| California: | 37.2% (3,881,193) |
| Merced: | 5.3% (1,069) |
| California: | 0.5% (48,911) |
| Merced: | 4.2% (845) |
| California: | 5.2% (539,184) |
| Merced: | 4.0% (802) |
| California: | 0.6% (65,335) |
| Merced: | 2.4% (489) |
| California: | 7.8% (818,297) |
| Merced: | 1.5% (310) |
| California: | 6.6% (684,672) |
Place of birth for U.S.-born residents:
- This state: 63,848
- Other state: 7,246
- Northeast: 821
- Midwest: 1,593
- South: 3,342
- West: 1,490
86.7% of Merced residents lived in the same house 1 years ago.
Out of people who lived in different houses, 44.1% lived in this county.
Out of people who lived in different counties, 66.5% lived in California.
| Merced: | 86.7% |
| State average: | 88.9% |
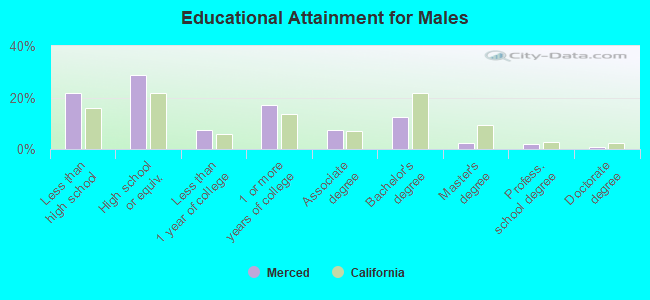
Education attainment for males 25 years and older:
- No schooling: 1,530
- Nursery to 4th grade: 170
- 5th and 6th grade: 1,064
- 7th and 8th grade: 482
- 9th grade: 346
- 10th grade: 772
- 11th grade: 833
- 12th grade, no diploma: 555
- High school graduate (or equivalency): 7,540
- Less than 1 year of college: 1,971
- Some college more than 1 year, no degree: 4,532
- Associate degree: 1,972
- Bachelor's degree: 3,221
- Master's degree: 647
- Professional school degree: 472
- Doctorate degree: 165
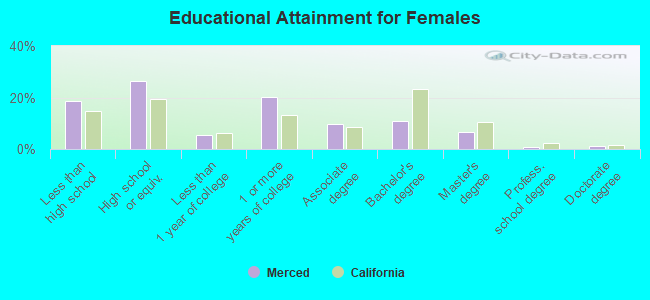
Education attainment for females 25 years and older:
- No schooling: 1,361
- Nursery to 4th grade: 808
- 5th and 6th grade: 1,326
- 7th and 8th grade: 80
- 9th grade: 374
- 10th grade: 329
- 11th grade: 365
- 12th grade, no diploma: 921
- High school graduate (or equivalency): 7,867
- Less than 1 year of college: 1,612
- Some college more than 1 year, no degree: 6,053
- Associate degree: 2,858
- Bachelor's degree: 3,239
- Master's degree: 1,968
- Professional school degree: 254
- Doctorate degree: 316
Housing units in structures:
- One, detached: 21,828
- One, attached: 431
- Two: 837
- 3 or 4: 2,119
- 5 to 9: 2,283
- 10 to 19: 391
- 20 to 49: 478
- 50 or more: 834
- Mobile homes: 742
Median worth of mobile homes: $33,474
Housing units lacking complete kitchen facilities in 2022: 0.8%
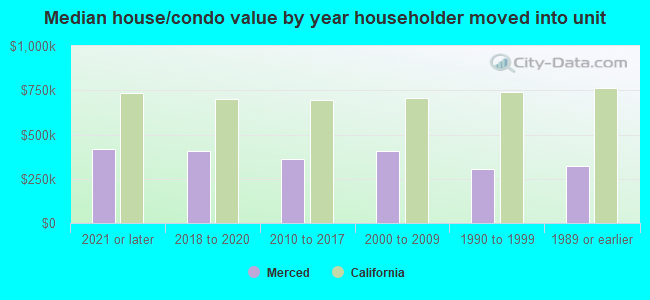
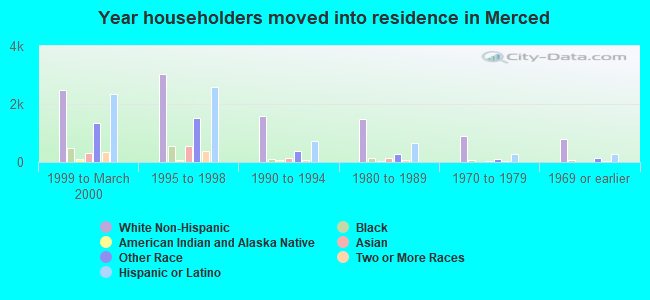
House/condo owner moved in on average 8 years ago
Renter moved in on average 3 years ago
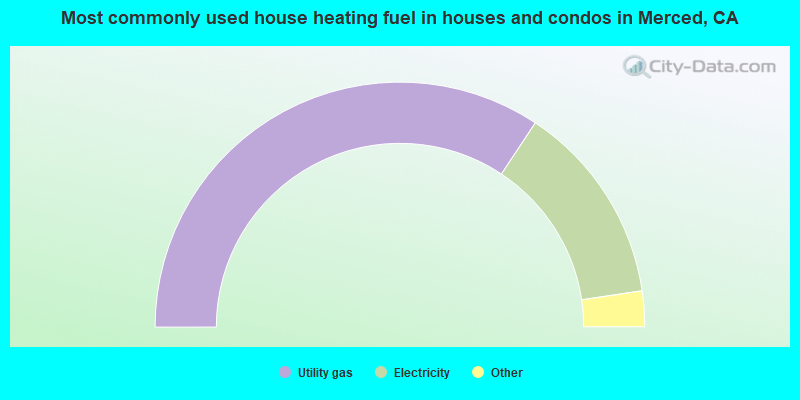
- 68.7%Utility gas
- 26.7%Electricity
- 2.5%Solar energy
- 1.6%Bottled, tank, or LP gas
- 0.3%Wood
- 0.2%No fuel used
- 0.1%Fuel oil, kerosene, etc.
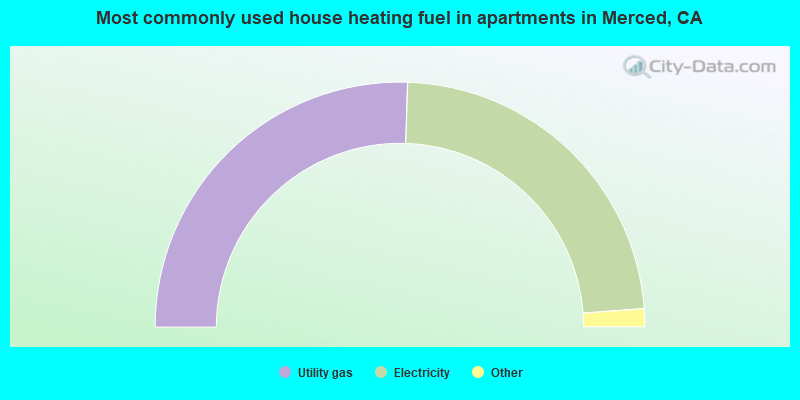
- 51.0%Utility gas
- 46.6%Electricity
- 0.9%Bottled, tank, or LP gas
- 0.9%No fuel used
- 0.3%Wood
- 0.1%Solar energy
- 0.1%Other fuel
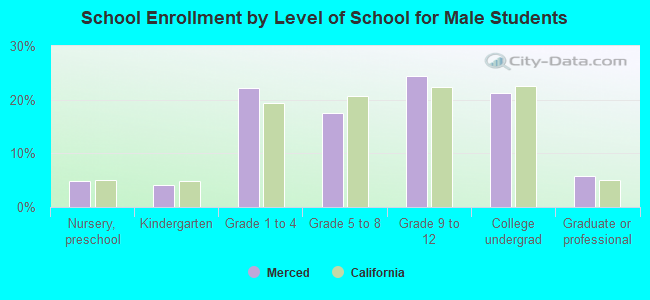
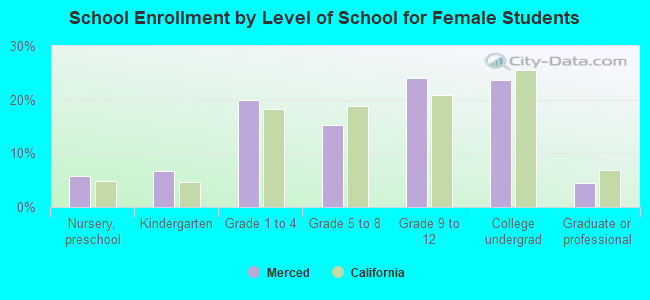
Private vs. public school enrollment:
| Here: | 3.9% |
| California: | 10.5% |
| Here: | 6.6% |
| California: | 8.5% |
| Here: | 13.1% |
| California: | 15.9% |