Estimated zip code population in 2022: 47,287
Zip code population in 2010: 38,776
Zip code population in 2000: 29,120
Houses and condos: 13,939
Renter-occupied apartments: 5,646
% of renters here:
43%State:
44%
March 2022 cost of living index in zip code 93635: 94.8
(less than average, U.S. average is 100)
Land area: 259.2
sq. mi.
Water area: 8.5
sq. mi.
Population density: 182 people per square mile (very low).
OSM Map
General Map
Google Map
MSN Map
OSM Map
General Map
Google Map
MSN Map
OSM Map
General Map
Google Map
MSN Map
OSM Map
General Map
Google Map
MSN Map
Please wait while loading the map...
Real estate property taxes paid for housing units in 2022:
This zip code:
0.7% ($2,869)California:
0.7% ($4,831)
Median real estate property taxes paid for housing units with mortgages in 2022: $3,339 (0.8%)
Median real estate property taxes paid for housing units with no mortgage in 2022: $2,238 (0.6%)
Profiles of local businesses
Business Search - 14 Million verified businesses
Males: 24,079 Females: 23,207
For population 25 years and over in 93635:
High school or higher: 70.8%Bachelor's degree or higher: 12.8%Graduate or professional degree: 3.5%Unemployed: 6.7%Mean travel time to work (commute): 47.8 minutes
For population 15 years and over in 93635:
Never married: 39.2%Now married: 50.1%Separated: 1.2%Widowed: 3.1%Divorced: 6.3%
Zip code 93635 compared to state average:
Median house value below state average. Black race population percentage below state average. Hispanic race population percentage above state average. Median age significantly below state average. House age below state average. Percentage of population with a bachelor's degree or higher significantly below state average. 34,135 72.2% Hispanic or Latino 9,614 20.3% White 1,192 2.5% Two or more races 1,058 2.2% Asian 955 2.0% Black 121 0.3% American Indian 142 0.3% Native Hawaiian and Other 66 0.1% Some other race
Data:
Median household income ($)
Median household income (% change since 2000)
Household income diversity
Ratio of average income to average house value (%)
Ratio of average income to average rent
Median household income ($) - White
Median household income ($) - Black or African American
Median household income ($) - Asian
Median household income ($) - Hispanic or Latino
Median household income ($) - American Indian and Alaska Native
Median household income ($) - Multirace
Median household income ($) - Other Race
Median household income for houses/condos with a mortgage ($)
Median household income for apartments without a mortgage ($)
Races - White alone (%)
Races - White alone (% change since 2000)
Races - Black alone (%)
Races - Black alone (% change since 2000)
Races - American Indian alone (%)
Races - American Indian alone (% change since 2000)
Races - Asian alone (%)
Races - Asian alone (% change since 2000)
Races - Hispanic (%)
Races - Hispanic (% change since 2000)
Races - Native Hawaiian and Other Pacific Islander alone (%)
Races - Native Hawaiian and Other Pacific Islander alone (% change since 2000)
Races - Two or more races (%)
Races - Two or more races (% change since 2000)
Races - Other race alone (%)
Races - Other race alone (% change since 2000)
Racial diversity
Unemployment (%)
Unemployment (% change since 2000)
Unemployment (%) - White
Unemployment (%) - Black or African American
Unemployment (%) - Asian
Unemployment (%) - Hispanic or Latino
Unemployment (%) - American Indian and Alaska Native
Unemployment (%) - Multirace
Unemployment (%) - Other Race
Population density (people per square mile)
Population - Males (%)
Population - Females (%)
Population - Males (%) - White
Population - Males (%) - Black or African American
Population - Males (%) - Asian
Population - Males (%) - Hispanic or Latino
Population - Males (%) - American Indian and Alaska Native
Population - Males (%) - Multirace
Population - Males (%) - Other Race
Population - Females (%) - White
Population - Females (%) - Black or African American
Population - Females (%) - Asian
Population - Females (%) - Hispanic or Latino
Population - Females (%) - American Indian and Alaska Native
Population - Females (%) - Multirace
Population - Females (%) - Other Race
Coronavirus confirmed cases (Apr 27, 2024)
Deaths caused by coronavirus (Apr 27, 2024)
Coronavirus confirmed cases (per 100k population) (Apr 27, 2024)
Deaths caused by coronavirus (per 100k population) (Apr 27, 2024)
Daily increase in number of cases (Apr 27, 2024)
Weekly increase in number of cases (Apr 27, 2024)
Cases doubled (in days) (Apr 27, 2024)
Hospitalized patients (Apr 18, 2022)
Negative test results (Apr 18, 2022)
Total test results (Apr 18, 2022)
COVID Vaccine doses distributed (per 100k population) (Sep 19, 2023)
COVID Vaccine doses administered (per 100k population) (Sep 19, 2023)
COVID Vaccine doses distributed (Sep 19, 2023)
COVID Vaccine doses administered (Sep 19, 2023)
Likely homosexual households (%)
Likely homosexual households (% change since 2000)
Likely homosexual households - Lesbian couples (%)
Likely homosexual households - Lesbian couples (% change since 2000)
Likely homosexual households - Gay men (%)
Likely homosexual households - Gay men (% change since 2000)
Cost of living index
Median gross rent ($)
Median contract rent ($)
Median monthly housing costs ($)
Median house or condo value ($)
Median house or condo value ($ change since 2000)
Mean house or condo value by units in structure - 1, detached ($)
Mean house or condo value by units in structure - 1, attached ($)
Mean house or condo value by units in structure - 2 ($)
Mean house or condo value by units in structure by units in structure - 3 or 4 ($)
Mean house or condo value by units in structure - 5 or more ($)
Mean house or condo value by units in structure - Boat, RV, van, etc. ($)
Mean house or condo value by units in structure - Mobile home ($)
Median house or condo value ($) - White
Median house or condo value ($) - Black or African American
Median house or condo value ($) - Asian
Median house or condo value ($) - Hispanic or Latino
Median house or condo value ($) - American Indian and Alaska Native
Median house or condo value ($) - Multirace
Median house or condo value ($) - Other Race
Median resident age
Resident age diversity
Median resident age - Males
Median resident age - Females
Median resident age - White
Median resident age - Black or African American
Median resident age - Asian
Median resident age - Hispanic or Latino
Median resident age - American Indian and Alaska Native
Median resident age - Multirace
Median resident age - Other Race
Median resident age - Males - White
Median resident age - Males - Black or African American
Median resident age - Males - Asian
Median resident age - Males - Hispanic or Latino
Median resident age - Males - American Indian and Alaska Native
Median resident age - Males - Multirace
Median resident age - Males - Other Race
Median resident age - Females - White
Median resident age - Females - Black or African American
Median resident age - Females - Asian
Median resident age - Females - Hispanic or Latino
Median resident age - Females - American Indian and Alaska Native
Median resident age - Females - Multirace
Median resident age - Females - Other Race
Commute - mean travel time to work (minutes)
Travel time to work - Less than 5 minutes (%)
Travel time to work - Less than 5 minutes (% change since 2000)
Travel time to work - 5 to 9 minutes (%)
Travel time to work - 5 to 9 minutes (% change since 2000)
Travel time to work - 10 to 19 minutes (%)
Travel time to work - 10 to 19 minutes (% change since 2000)
Travel time to work - 20 to 29 minutes (%)
Travel time to work - 20 to 29 minutes (% change since 2000)
Travel time to work - 30 to 39 minutes (%)
Travel time to work - 30 to 39 minutes (% change since 2000)
Travel time to work - 40 to 59 minutes (%)
Travel time to work - 40 to 59 minutes (% change since 2000)
Travel time to work - 60 to 89 minutes (%)
Travel time to work - 60 to 89 minutes (% change since 2000)
Travel time to work - 90 or more minutes (%)
Travel time to work - 90 or more minutes (% change since 2000)
Marital status - Never married (%)
Marital status - Now married (%)
Marital status - Separated (%)
Marital status - Widowed (%)
Marital status - Divorced (%)
Median family income ($)
Median family income (% change since 2000)
Median non-family income ($)
Median non-family income (% change since 2000)
Median per capita income ($)
Median per capita income (% change since 2000)
Median family income ($) - White
Median family income ($) - Black or African American
Median family income ($) - Asian
Median family income ($) - Hispanic or Latino
Median family income ($) - American Indian and Alaska Native
Median family income ($) - Multirace
Median family income ($) - Other Race
Median year house/condo built
Median year apartment built
Year house built - Built 2005 or later (%)
Year house built - Built 2000 to 2004 (%)
Year house built - Built 1990 to 1999 (%)
Year house built - Built 1980 to 1989 (%)
Year house built - Built 1970 to 1979 (%)
Year house built - Built 1960 to 1969 (%)
Year house built - Built 1950 to 1959 (%)
Year house built - Built 1940 to 1949 (%)
Year house built - Built 1939 or earlier (%)
Average household size
Household density (households per square mile)
Average household size - White
Average household size - Black or African American
Average household size - Asian
Average household size - Hispanic or Latino
Average household size - American Indian and Alaska Native
Average household size - Multirace
Average household size - Other Race
Occupied housing units (%)
Vacant housing units (%)
Owner occupied housing units (%)
Renter occupied housing units (%)
Vacancy status - For rent (%)
Vacancy status - For sale only (%)
Vacancy status - Rented or sold, not occupied (%)
Vacancy status - For seasonal, recreational, or occasional use (%)
Vacancy status - For migrant workers (%)
Vacancy status - Other vacant (%)
Residents with income below the poverty level (%)
Residents with income below 50% of the poverty level (%)
Children below poverty level (%)
Poor families by family type - Married-couple family (%)
Poor families by family type - Male, no wife present (%)
Poor families by family type - Female, no husband present (%)
Poverty status for native-born residents (%)
Poverty status for foreign-born residents (%)
Poverty among high school graduates not in families (%)
Poverty among people who did not graduate high school not in families (%)
Residents with income below the poverty level (%) - White
Residents with income below the poverty level (%) - Black or African American
Residents with income below the poverty level (%) - Asian
Residents with income below the poverty level (%) - Hispanic or Latino
Residents with income below the poverty level (%) - American Indian and Alaska Native
Residents with income below the poverty level (%) - Multirace
Residents with income below the poverty level (%) - Other Race
Air pollution - Air Quality Index (AQI)
Air pollution - CO
Air pollution - NO2
Air pollution - SO2
Air pollution - Ozone
Air pollution - PM10
Air pollution - PM25
Air pollution - Pb
Crime - Murders per 100,000 population
Crime - Rapes per 100,000 population
Crime - Robberies per 100,000 population
Crime - Assaults per 100,000 population
Crime - Burglaries per 100,000 population
Crime - Thefts per 100,000 population
Crime - Auto thefts per 100,000 population
Crime - Arson per 100,000 population
Crime - City-data.com crime index
Crime - Violent crime index
Crime - Property crime index
Crime - Murders per 100,000 population (5 year average)
Crime - Rapes per 100,000 population (5 year average)
Crime - Robberies per 100,000 population (5 year average)
Crime - Assaults per 100,000 population (5 year average)
Crime - Burglaries per 100,000 population (5 year average)
Crime - Thefts per 100,000 population (5 year average)
Crime - Auto thefts per 100,000 population (5 year average)
Crime - Arson per 100,000 population (5 year average)
Crime - City-data.com crime index (5 year average)
Crime - Violent crime index (5 year average)
Crime - Property crime index (5 year average)
1996 Presidential Elections Results (%) - Democratic Party (Clinton)
1996 Presidential Elections Results (%) - Republican Party (Dole)
1996 Presidential Elections Results (%) - Other
2000 Presidential Elections Results (%) - Democratic Party (Gore)
2000 Presidential Elections Results (%) - Republican Party (Bush)
2000 Presidential Elections Results (%) - Other
2004 Presidential Elections Results (%) - Democratic Party (Kerry)
2004 Presidential Elections Results (%) - Republican Party (Bush)
2004 Presidential Elections Results (%) - Other
2008 Presidential Elections Results (%) - Democratic Party (Obama)
2008 Presidential Elections Results (%) - Republican Party (McCain)
2008 Presidential Elections Results (%) - Other
2012 Presidential Elections Results (%) - Democratic Party (Obama)
2012 Presidential Elections Results (%) - Republican Party (Romney)
2012 Presidential Elections Results (%) - Other
2016 Presidential Elections Results (%) - Democratic Party (Clinton)
2016 Presidential Elections Results (%) - Republican Party (Trump)
2016 Presidential Elections Results (%) - Other
2020 Presidential Elections Results (%) - Democratic Party (Biden)
2020 Presidential Elections Results (%) - Republican Party (Trump)
2020 Presidential Elections Results (%) - Other
Ancestries Reported - Arab (%)
Ancestries Reported - Czech (%)
Ancestries Reported - Danish (%)
Ancestries Reported - Dutch (%)
Ancestries Reported - English (%)
Ancestries Reported - French (%)
Ancestries Reported - French Canadian (%)
Ancestries Reported - German (%)
Ancestries Reported - Greek (%)
Ancestries Reported - Hungarian (%)
Ancestries Reported - Irish (%)
Ancestries Reported - Italian (%)
Ancestries Reported - Lithuanian (%)
Ancestries Reported - Norwegian (%)
Ancestries Reported - Polish (%)
Ancestries Reported - Portuguese (%)
Ancestries Reported - Russian (%)
Ancestries Reported - Scotch-Irish (%)
Ancestries Reported - Scottish (%)
Ancestries Reported - Slovak (%)
Ancestries Reported - Subsaharan African (%)
Ancestries Reported - Swedish (%)
Ancestries Reported - Swiss (%)
Ancestries Reported - Ukrainian (%)
Ancestries Reported - United States (%)
Ancestries Reported - Welsh (%)
Ancestries Reported - West Indian (%)
Ancestries Reported - Other (%)
Educational Attainment - No schooling completed (%)
Educational Attainment - Less than high school (%)
Educational Attainment - High school or equivalent (%)
Educational Attainment - Less than 1 year of college (%)
Educational Attainment - 1 or more years of college (%)
Educational Attainment - Associate degree (%)
Educational Attainment - Bachelor's degree (%)
Educational Attainment - Master's degree (%)
Educational Attainment - Professional school degree (%)
Educational Attainment - Doctorate degree (%)
School Enrollment - Nursery, preschool (%)
School Enrollment - Kindergarten (%)
School Enrollment - Grade 1 to 4 (%)
School Enrollment - Grade 5 to 8 (%)
School Enrollment - Grade 9 to 12 (%)
School Enrollment - College undergrad (%)
School Enrollment - Graduate or professional (%)
School Enrollment - Not enrolled in school (%)
School enrollment - Public schools (%)
School enrollment - Private schools (%)
School enrollment - Not enrolled (%)
Median number of rooms in houses and condos
Median number of rooms in apartments
Housing units lacking complete plumbing facilities (%)
Housing units lacking complete kitchen facilities (%)
Density of houses
Urban houses (%)
Rural houses (%)
Households with people 60 years and over (%)
Households with people 65 years and over (%)
Households with people 75 years and over (%)
Households with one or more nonrelatives (%)
Households with no nonrelatives (%)
Population in households (%)
Family households (%)
Nonfamily households (%)
Population in families (%)
Family households with own children (%)
Median number of bedrooms in owner occupied houses
Mean number of bedrooms in owner occupied houses
Median number of bedrooms in renter occupied houses
Mean number of bedrooms in renter occupied houses
Median number of vehichles in owner occupied houses
Mean number of vehichles in owner occupied houses
Median number of vehichles in renter occupied houses
Mean number of vehichles in renter occupied houses
Mortgage status - with mortgage (%)
Mortgage status - with second mortgage (%)
Mortgage status - with home equity loan (%)
Mortgage status - with both second mortgage and home equity loan (%)
Mortgage status - without a mortgage (%)
Average family size
Average family size - White
Average family size - Black or African American
Average family size - Asian
Average family size - Hispanic or Latino
Average family size - American Indian and Alaska Native
Average family size - Multirace
Average family size - Other Race
Geographical mobility - Same house 1 year ago (%)
Geographical mobility - Moved within same county (%)
Geographical mobility - Moved from different county within same state (%)
Geographical mobility - Moved from different state (%)
Geographical mobility - Moved from abroad (%)
Place of birth - Born in state of residence (%)
Place of birth - Born in other state (%)
Place of birth - Native, outside of US (%)
Place of birth - Foreign born (%)
Housing units in structures - 1, detached (%)
Housing units in structures - 1, attached (%)
Housing units in structures - 2 (%)
Housing units in structures - 3 or 4 (%)
Housing units in structures - 5 to 9 (%)
Housing units in structures - 10 to 19 (%)
Housing units in structures - 20 to 49 (%)
Housing units in structures - 50 or more (%)
Housing units in structures - Mobile home (%)
Housing units in structures - Boat, RV, van, etc. (%)
House/condo owner moved in on average (years ago)
Renter moved in on average (years ago)
Year householder moved into unit - Moved in 1999 to March 2000 (%)
Year householder moved into unit - Moved in 1995 to 1998 (%)
Year householder moved into unit - Moved in 1990 to 1994 (%)
Year householder moved into unit - Moved in 1980 to 1989 (%)
Year householder moved into unit - Moved in 1970 to 1979 (%)
Year householder moved into unit - Moved in 1969 or earlier (%)
Means of transportation to work - Drove car alone (%)
Means of transportation to work - Carpooled (%)
Means of transportation to work - Public transportation (%)
Means of transportation to work - Bus or trolley bus (%)
Means of transportation to work - Streetcar or trolley car (%)
Means of transportation to work - Subway or elevated (%)
Means of transportation to work - Railroad (%)
Means of transportation to work - Ferryboat (%)
Means of transportation to work - Taxicab (%)
Means of transportation to work - Motorcycle (%)
Means of transportation to work - Bicycle (%)
Means of transportation to work - Walked (%)
Means of transportation to work - Other means (%)
Working at home (%)
Industry diversity
Most Common Industries - Agriculture, forestry, fishing and hunting, and mining (%)
Most Common Industries - Agriculture, forestry, fishing and hunting (%)
Most Common Industries - Mining, quarrying, and oil and gas extraction (%)
Most Common Industries - Construction (%)
Most Common Industries - Manufacturing (%)
Most Common Industries - Wholesale trade (%)
Most Common Industries - Retail trade (%)
Most Common Industries - Transportation and warehousing, and utilities (%)
Most Common Industries - Transportation and warehousing (%)
Most Common Industries - Utilities (%)
Most Common Industries - Information (%)
Most Common Industries - Finance and insurance, and real estate and rental and leasing (%)
Most Common Industries - Finance and insurance (%)
Most Common Industries - Real estate and rental and leasing (%)
Most Common Industries - Professional, scientific, and management, and administrative and waste management services (%)
Most Common Industries - Professional, scientific, and technical services (%)
Most Common Industries - Management of companies and enterprises (%)
Most Common Industries - Administrative and support and waste management services (%)
Most Common Industries - Educational services, and health care and social assistance (%)
Most Common Industries - Educational services (%)
Most Common Industries - Health care and social assistance (%)
Most Common Industries - Arts, entertainment, and recreation, and accommodation and food services (%)
Most Common Industries - Arts, entertainment, and recreation (%)
Most Common Industries - Accommodation and food services (%)
Most Common Industries - Other services, except public administration (%)
Most Common Industries - Public administration (%)
Occupation diversity
Most Common Occupations - Management, business, science, and arts occupations (%)
Most Common Occupations - Management, business, and financial occupations (%)
Most Common Occupations - Management occupations (%)
Most Common Occupations - Business and financial operations occupations (%)
Most Common Occupations - Computer, engineering, and science occupations (%)
Most Common Occupations - Computer and mathematical occupations (%)
Most Common Occupations - Architecture and engineering occupations (%)
Most Common Occupations - Life, physical, and social science occupations (%)
Most Common Occupations - Education, legal, community service, arts, and media occupations (%)
Most Common Occupations - Community and social service occupations (%)
Most Common Occupations - Legal occupations (%)
Most Common Occupations - Education, training, and library occupations (%)
Most Common Occupations - Arts, design, entertainment, sports, and media occupations (%)
Most Common Occupations - Healthcare practitioners and technical occupations (%)
Most Common Occupations - Health diagnosing and treating practitioners and other technical occupations (%)
Most Common Occupations - Health technologists and technicians (%)
Most Common Occupations - Service occupations (%)
Most Common Occupations - Healthcare support occupations (%)
Most Common Occupations - Protective service occupations (%)
Most Common Occupations - Fire fighting and prevention, and other protective service workers including supervisors (%)
Most Common Occupations - Law enforcement workers including supervisors (%)
Most Common Occupations - Food preparation and serving related occupations (%)
Most Common Occupations - Building and grounds cleaning and maintenance occupations (%)
Most Common Occupations - Personal care and service occupations (%)
Most Common Occupations - Sales and office occupations (%)
Most Common Occupations - Sales and related occupations (%)
Most Common Occupations - Office and administrative support occupations (%)
Most Common Occupations - Natural resources, construction, and maintenance occupations (%)
Most Common Occupations - Farming, fishing, and forestry occupations (%)
Most Common Occupations - Construction and extraction occupations (%)
Most Common Occupations - Installation, maintenance, and repair occupations (%)
Most Common Occupations - Production, transportation, and material moving occupations (%)
Most Common Occupations - Production occupations (%)
Most Common Occupations - Transportation occupations (%)
Most Common Occupations - Material moving occupations (%)
People in Group quarters - Institutionalized population (%)
People in Group quarters - Correctional institutions (%)
People in Group quarters - Federal prisons and detention centers (%)
People in Group quarters - Halfway houses (%)
People in Group quarters - Local jails and other confinement facilities (including police lockups) (%)
People in Group quarters - Military disciplinary barracks (%)
People in Group quarters - State prisons (%)
People in Group quarters - Other types of correctional institutions (%)
People in Group quarters - Nursing homes (%)
People in Group quarters - Hospitals/wards, hospices, and schools for the handicapped (%)
People in Group quarters - Hospitals/wards and hospices for chronically ill (%)
People in Group quarters - Hospices or homes for chronically ill (%)
People in Group quarters - Military hospitals or wards for chronically ill (%)
People in Group quarters - Other hospitals or wards for chronically ill (%)
People in Group quarters - Hospitals or wards for drug/alcohol abuse (%)
People in Group quarters - Mental (Psychiatric) hospitals or wards (%)
People in Group quarters - Schools, hospitals, or wards for the mentally retarded (%)
People in Group quarters - Schools, hospitals, or wards for the physically handicapped (%)
People in Group quarters - Institutions for the deaf (%)
People in Group quarters - Institutions for the blind (%)
People in Group quarters - Orthopedic wards and institutions for the physically handicapped (%)
People in Group quarters - Wards in general hospitals for patients who have no usual home elsewhere (%)
People in Group quarters - Wards in military hospitals for patients who have no usual home elsewhere (%)
People in Group quarters - Juvenile institutions (%)
People in Group quarters - Long-term care (%)
People in Group quarters - Homes for abused, dependent, and neglected children (%)
People in Group quarters - Residential treatment centers for emotionally disturbed children (%)
People in Group quarters - Training schools for juvenile delinquents (%)
People in Group quarters - Short-term care, detention or diagnostic centers for delinquent children (%)
People in Group quarters - Type of juvenile institution unknown (%)
People in Group quarters - Noninstitutionalized population (%)
People in Group quarters - College dormitories (includes college quarters off campus) (%)
People in Group quarters - Military quarters (%)
People in Group quarters - On base (%)
People in Group quarters - Barracks, unaccompanied personnel housing (UPH), (Enlisted/Officer), ;and similar group living quarters for military personnel (%)
People in Group quarters - Transient quarters for temporary residents (%)
People in Group quarters - Military ships (%)
People in Group quarters - Group homes (%)
People in Group quarters - Homes or halfway houses for drug/alcohol abuse (%)
People in Group quarters - Homes for the mentally ill (%)
People in Group quarters - Homes for the mentally retarded (%)
People in Group quarters - Homes for the physically handicapped (%)
People in Group quarters - Other group homes (%)
People in Group quarters - Religious group quarters (%)
People in Group quarters - Dormitories (%)
People in Group quarters - Agriculture workers' dormitories on farms (%)
People in Group quarters - Job Corps and vocational training facilities (%)
People in Group quarters - Other workers' dormitories (%)
People in Group quarters - Crews of maritime vessels (%)
People in Group quarters - Other nonhousehold living situations (%)
People in Group quarters - Other noninstitutional group quarters (%)
Residents speaking English at home (%)
Residents speaking English at home - Born in the United States (%)
Residents speaking English at home - Native, born elsewhere (%)
Residents speaking English at home - Foreign born (%)
Residents speaking Spanish at home (%)
Residents speaking Spanish at home - Born in the United States (%)
Residents speaking Spanish at home - Native, born elsewhere (%)
Residents speaking Spanish at home - Foreign born (%)
Residents speaking other language at home (%)
Residents speaking other language at home - Born in the United States (%)
Residents speaking other language at home - Native, born elsewhere (%)
Residents speaking other language at home - Foreign born (%)
Class of Workers - Employee of private company (%)
Class of Workers - Self-employed in own incorporated business (%)
Class of Workers - Private not-for-profit wage and salary workers (%)
Class of Workers - Local government workers (%)
Class of Workers - State government workers (%)
Class of Workers - Federal government workers (%)
Class of Workers - Self-employed workers in own not incorporated business and Unpaid family workers (%)
House heating fuel used in houses and condos - Utility gas (%)
House heating fuel used in houses and condos - Bottled, tank, or LP gas (%)
House heating fuel used in houses and condos - Electricity (%)
House heating fuel used in houses and condos - Fuel oil, kerosene, etc. (%)
House heating fuel used in houses and condos - Coal or coke (%)
House heating fuel used in houses and condos - Wood (%)
House heating fuel used in houses and condos - Solar energy (%)
House heating fuel used in houses and condos - Other fuel (%)
House heating fuel used in houses and condos - No fuel used (%)
House heating fuel used in apartments - Utility gas (%)
House heating fuel used in apartments - Bottled, tank, or LP gas (%)
House heating fuel used in apartments - Electricity (%)
House heating fuel used in apartments - Fuel oil, kerosene, etc. (%)
House heating fuel used in apartments - Coal or coke (%)
House heating fuel used in apartments - Wood (%)
House heating fuel used in apartments - Solar energy (%)
House heating fuel used in apartments - Other fuel (%)
House heating fuel used in apartments - No fuel used (%)
Armed forces status - In Armed Forces (%)
Armed forces status - Civilian (%)
Armed forces status - Civilian - Veteran (%)
Armed forces status - Civilian - Nonveteran (%)
Fatal accidents locations in years 2005-2021
Fatal accidents locations in 2005
Fatal accidents locations in 2006
Fatal accidents locations in 2007
Fatal accidents locations in 2008
Fatal accidents locations in 2009
Fatal accidents locations in 2010
Fatal accidents locations in 2011
Fatal accidents locations in 2012
Fatal accidents locations in 2013
Fatal accidents locations in 2014
Fatal accidents locations in 2015
Fatal accidents locations in 2016
Fatal accidents locations in 2017
Fatal accidents locations in 2018
Fatal accidents locations in 2019
Fatal accidents locations in 2020
Fatal accidents locations in 2021
Alcohol use - People drinking some alcohol every month (%)
Alcohol use - People not drinking at all (%)
Alcohol use - Average days/month drinking alcohol
Alcohol use - Average drinks/week
Alcohol use - Average days/year people drink much
Audiometry - Average condition of hearing (%)
Audiometry - People that can hear a whisper from across a quiet room (%)
Audiometry - People that can hear normal voice from across a quiet room (%)
Audiometry - Ears ringing, roaring, buzzing (%)
Audiometry - Had a job exposure to loud noise (%)
Audiometry - Had off-work exposure to loud noise (%)
Blood Pressure & Cholesterol - Has high blood pressure (%)
Blood Pressure & Cholesterol - Checking blood pressure at home (%)
Blood Pressure & Cholesterol - Frequently checking blood cholesterol (%)
Blood Pressure & Cholesterol - Has high cholesterol level (%)
Consumer Behavior - Money monthly spent on food at supermarket/grocery store
Consumer Behavior - Money monthly spent on food at other stores
Consumer Behavior - Money monthly spent on eating out
Consumer Behavior - Money monthly spent on carryout/delivered foods
Consumer Behavior - Income spent on food at supermarket/grocery store (%)
Consumer Behavior - Income spent on food at other stores (%)
Consumer Behavior - Income spent on eating out (%)
Consumer Behavior - Income spent on carryout/delivered foods (%)
Current Health Status - General health condition (%)
Current Health Status - Blood donors (%)
Current Health Status - Has blood ever tested for HIV virus (%)
Current Health Status - Left-handed people (%)
Dermatology - People using sunscreen (%)
Diabetes - Diabetics (%)
Diabetes - Had a blood test for high blood sugar (%)
Diabetes - People taking insulin (%)
Diet Behavior & Nutrition - Diet health (%)
Diet Behavior & Nutrition - Milk product consumption (# of products/month)
Diet Behavior & Nutrition - Meals not home prepared (#/week)
Diet Behavior & Nutrition - Meals from fast food or pizza place (#/week)
Diet Behavior & Nutrition - Ready-to-eat foods (#/month)
Diet Behavior & Nutrition - Frozen meals/pizza (#/month)
Drug Use - People that ever used marijuana or hashish (%)
Drug Use - Ever used hard drugs (%)
Drug Use - Ever used any form of cocaine (%)
Drug Use - Ever used heroin (%)
Drug Use - Ever used methamphetamine (%)
Health Insurance - People covered by health insurance (%)
Kidney Conditions-Urology - Avg. # of times urinating at night
Medical Conditions - People with asthma (%)
Medical Conditions - People with anemia (%)
Medical Conditions - People with psoriasis (%)
Medical Conditions - People with overweight (%)
Medical Conditions - Elderly people having difficulties in thinking or remembering (%)
Medical Conditions - People who ever received blood transfusion (%)
Medical Conditions - People having trouble seeing even with glass/contacts (%)
Medical Conditions - People with arthritis (%)
Medical Conditions - People with gout (%)
Medical Conditions - People with congestive heart failure (%)
Medical Conditions - People with coronary heart disease (%)
Medical Conditions - People with angina pectoris (%)
Medical Conditions - People who ever had heart attack (%)
Medical Conditions - People who ever had stroke (%)
Medical Conditions - People with emphysema (%)
Medical Conditions - People with thyroid problem (%)
Medical Conditions - People with chronic bronchitis (%)
Medical Conditions - People with any liver condition (%)
Medical Conditions - People who ever had cancer or malignancy (%)
Mental Health - People who have little interest in doing things (%)
Mental Health - People feeling down, depressed, or hopeless (%)
Mental Health - People who have trouble sleeping or sleeping too much (%)
Mental Health - People feeling tired or having little energy (%)
Mental Health - People with poor appetite or overeating (%)
Mental Health - People feeling bad about themself (%)
Mental Health - People who have trouble concentrating on things (%)
Mental Health - People moving or speaking slowly or too fast (%)
Mental Health - People having thoughts they would be better off dead (%)
Oral Health - Average years since last visit a dentist
Oral Health - People embarrassed because of mouth (%)
Oral Health - People with gum disease (%)
Oral Health - General health of teeth and gums (%)
Oral Health - Average days a week using dental floss/device
Oral Health - Average days a week using mouthwash for dental problem
Oral Health - Average number of teeth
Pesticide Use - Households using pesticides to control insects (%)
Pesticide Use - Households using pesticides to kill weeds (%)
Physical Activity - People doing vigorous-intensity work activities (%)
Physical Activity - People doing moderate-intensity work activities (%)
Physical Activity - People walking or bicycling (%)
Physical Activity - People doing vigorous-intensity recreational activities (%)
Physical Activity - People doing moderate-intensity recreational activities (%)
Physical Activity - Average hours a day doing sedentary activities
Physical Activity - Average hours a day watching TV or videos
Physical Activity - Average hours a day using computer
Physical Functioning - People having limitations keeping them from working (%)
Physical Functioning - People limited in amount of work they can do (%)
Physical Functioning - People that need special equipment to walk (%)
Physical Functioning - People experiencing confusion/memory problems (%)
Physical Functioning - People requiring special healthcare equipment (%)
Prescription Medications - Average number of prescription medicines taking
Preventive Aspirin Use - Adults 40+ taking low-dose aspirin (%)
Reproductive Health - Vaginal deliveries (%)
Reproductive Health - Cesarean deliveries (%)
Reproductive Health - Deliveries resulted in a live birth (%)
Reproductive Health - Pregnancies resulted in a delivery (%)
Reproductive Health - Women breastfeeding newborns (%)
Reproductive Health - Women that had a hysterectomy (%)
Reproductive Health - Women that had both ovaries removed (%)
Reproductive Health - Women that have ever taken birth control pills (%)
Reproductive Health - Women taking birth control pills (%)
Reproductive Health - Women that have ever used Depo-Provera or injectables (%)
Reproductive Health - Women that have ever used female hormones (%)
Sexual Behavior - People 18+ that ever had sex (vaginal, anal, or oral) (%)
Sexual Behavior - Males 18+ that ever had vaginal sex with a woman (%)
Sexual Behavior - Males 18+ that ever performed oral sex on a woman (%)
Sexual Behavior - Males 18+ that ever had anal sex with a woman (%)
Sexual Behavior - Males 18+ that ever had any sex with a man (%)
Sexual Behavior - Females 18+ that ever had vaginal sex with a man (%)
Sexual Behavior - Females 18+ that ever performed oral sex on a man (%)
Sexual Behavior - Females 18+ that ever had anal sex with a man (%)
Sexual Behavior - Females 18+ that ever had any kind of sex with a woman (%)
Sexual Behavior - Average age people first had sex
Sexual Behavior - Average number of female sex partners in lifetime (males 18+)
Sexual Behavior - Average number of female vaginal sex partners in lifetime (males 18+)
Sexual Behavior - Average age people first performed oral sex on a woman (18+)
Sexual Behavior - Average number of woman performed oral sex on in lifetime (18+)
Sexual Behavior - Average number of male sex partners in lifetime (males 18+)
Sexual Behavior - Average number of male anal sex partners in lifetime (males 18+)
Sexual Behavior - Average age people first performed oral sex on a man (18+)
Sexual Behavior - Average number of male oral sex partners in lifetime (18+)
Sexual Behavior - People using protection when performing oral sex (%)
Sexual Behavior - Average number of times people have vaginal or anal sex a year
Sexual Behavior - People having sex without condom (%)
Sexual Behavior - Average number of male sex partners in lifetime (females 18+)
Sexual Behavior - Average number of male vaginal sex partners in lifetime (females 18+)
Sexual Behavior - Average number of female sex partners in lifetime (females 18+)
Sexual Behavior - Circumcised males 18+ (%)
Sleep Disorders - Average hours sleeping at night
Sleep Disorders - People that has trouble sleeping (%)
Smoking-Cigarette Use - People smoking cigarettes (%)
Taste & Smell - People 40+ having problems with smell (%)
Taste & Smell - People 40+ having problems with taste (%)
Taste & Smell - People 40+ that ever had wisdom teeth removed (%)
Taste & Smell - People 40+ that ever had tonsils teeth removed (%)
Taste & Smell - People 40+ that ever had a loss of consciousness because of a head injury (%)
Taste & Smell - People 40+ that ever had a broken nose or other serious injury to face or skull (%)
Taste & Smell - People 40+ that ever had two or more sinus infections (%)
Weight - Average height (inches)
Weight - Average weight (pounds)
Weight - Average BMI
Weight - People that are obese (%)
Weight - People that ever were obese (%)
Weight - People trying to lose weight (%)
Urban population: 42,278
Rural population: 5,008
Estimated median house/condo value in 2022: $428,476
93635:
$428,476California:
$715,900
Median resident age: This zip code:
29.9 yearsCalifornia median age:
37.9 years
Average household size: This zip code:
3.6 peopleCalifornia:
2.8 people
Averages for the 2020 tax year for zip code 93635, filed in 2021:
Average Adjusted Gross Income (AGI) in 2020: $52,900 (Individual Income Tax Returns) Here:
$52,900State:
$95,910
Salary/wage: $46,919 (reported on 85.7% of returns )Here:
$46,919State:
$77,331
(% of AGI for various income ranges: 1310.1% for AGIs below $25k , 3902.6% for AGIs $25k-50k , 7506.8% for AGIs $50k-75k , 11129.2% for AGIs $75k-100k , 19275.3% for AGIs $100k-200k , 78450.0% for AGIs over 200k ) Taxable interest for individuals: $754 (reported on 25.7% of returns )This zip code:
$754California:
$2,294
(% of AGI for various income ranges: 4.8% for AGIs below $25k , 7.9% for AGIs $25k-50k , 13.4% for AGIs $50k-75k , 25.5% for AGIs $75k-100k , 63.9% for AGIs $100k-200k , 3031.4% for AGIs over 200k ) Ordinary dividends: $7,784 (reported on 5.5% of returns )(% of AGI for various income ranges: 5.7% for AGIs below $25k , 9.9% for AGIs $25k-50k , 21.9% for AGIs $50k-75k , 37.9% for AGIs $75k-100k , 92.2% for AGIs $100k-200k , 8980.0% for AGIs over 200k ) Net capital gain/loss in AGI: +$13,331 (reported on 6.2% of returns )Here:
+$13,331State:
+$49,306
(% of AGI for various income ranges: 1.2% for AGIs below $25k , 12.2% for AGIs $25k-50k , 23.8% for AGIs $50k-75k , 101.6% for AGIs $75k-100k , 364.3% for AGIs $100k-200k , 14981.4% for AGIs over 200k ) Profit/loss from business: +$12,374 (reported on 11.8% of returns )Here:
+$12,374State:
+$15,671
(% of AGI for various income ranges: 122.6% for AGIs below $25k , 173.5% for AGIs $25k-50k , 232.7% for AGIs $50k-75k , 177.6% for AGIs $75k-100k , 412.2% for AGIs $100k-200k , 6554.3% for AGIs over 200k ) Taxable individual retirement arrangement distribution: $16,982 (reported on 2.8% of returns )93635:
$16,982California:
$23,505
(% of AGI for various income ranges: 20.0% for AGIs below $25k , 27.1% for AGIs $25k-50k , 53.3% for AGIs $50k-75k , 145.2% for AGIs $75k-100k , 273.1% for AGIs $100k-200k , 2060.0% for AGIs over 200k ) Self-employed (Keogh) retirement plans: $30,667 (reported on 0.1% of returns )93635:
$30,667California:
$30,163
(% of AGI for various income ranges: 69.7% for AGIs $100k-200k ) Total itemized deductions: $28,192 (reported on 7.7% of returns )Here:
$28,192State:
$39,517
(% of AGI for various income ranges: 46.9% for AGIs below $25k , 135.8% for AGIs $25k-50k , 328.4% for AGIs $50k-75k , 589.7% for AGIs $75k-100k , 1227.5% for AGIs $100k-200k , 9945.7% for AGIs over 200k ) Charity contributions: $4,959 (reported on 5.4% of returns )(% of AGI for various income ranges: 2.4% for AGIs below $25k , 8.2% for AGIs $25k-50k , 28.7% for AGIs $50k-75k , 68.1% for AGIs $75k-100k , 142.3% for AGIs $100k-200k , 2665.7% for AGIs over 200k ) Taxes paid: $7,738 (reported on 7.6% of returns )(% of AGI for various income ranges: 8.5% for AGIs below $25k , 30.6% for AGIs $25k-50k , 87.8% for AGIs $50k-75k , 185.3% for AGIs $75k-100k , 393.6% for AGIs $100k-200k , 1765.7% for AGIs over 200k ) Earned income credit: $2,332 (reported on 19.8% of returns )(% of AGI for various income ranges: 112.7% for AGIs below $25k , 98.1% for AGIs $25k-50k , 2.2% for AGIs $50k-75k ) Percentage of individuals using paid preparers for their 2020 taxes: 94.5%(% for various income ranges: 93.1% for AGIs below $25k , 94.9% for AGIs $25k-50k , 95.1% for AGIs $50k-75k , 95.4% for AGIs $75k-100k , 95.8% for AGIs $100k-200k , 97.0% for AGIs over 200k )
Averages for the 2012 tax year for zip code 93635, filed in 2013:
Average Adjusted Gross Income (AGI) in 2012: $42,560 (Individual Income Tax Returns) Here:
$42,560State:
$72,726
Salary/wage: $37,878 (reported on 86.4% of returns )Here:
$37,878State:
$59,079
(% of AGI for various income ranges: 73.3% for AGIs below $25k , 80.7% for AGIs $25k-50k , 82.1% for AGIs $50k-75k , 83.4% for AGIs $75k-100k , 79.4% for AGIs $100k-200k , 41.5% for AGIs over 200k ) Taxable interest for individuals: $756 (reported on 25.3% of returns )This zip code:
$756California:
$2,146
(% of AGI for various income ranges: 0.4% for AGIs below $25k , 0.2% for AGIs $25k-50k , 0.4% for AGIs $50k-75k , 0.4% for AGIs $75k-100k , 0.5% for AGIs $100k-200k , 1.3% for AGIs over 200k ) Ordinary dividends: $3,172 (reported on 6.9% of returns )(% of AGI for various income ranges: 0.4% for AGIs below $25k , 0.3% for AGIs $25k-50k , 0.4% for AGIs $50k-75k , 0.4% for AGIs $75k-100k , 0.7% for AGIs $100k-200k , 1.5% for AGIs over 200k ) Net capital gain/loss in AGI: +$8,535 (reported on 5.9% of returns )Here:
+$8,535State:
+$30,460
(% of AGI for various income ranges: 0.1% for AGIs below $25k , 0.2% for AGIs $25k-50k , 0.3% for AGIs $75k-100k , 1.5% for AGIs $100k-200k , 9.5% for AGIs over 200k ) Profit/loss from business: +$12,873 (reported on 12.9% of returns )Here:
+$12,873State:
+$17,064
(% of AGI for various income ranges: 8.7% for AGIs below $25k , 4.2% for AGIs $25k-50k , 2.1% for AGIs $50k-75k , 2.2% for AGIs $75k-100k , 2.3% for AGIs $100k-200k , 6.7% for AGIs over 200k ) Taxable individual retirement arrangement distribution: $14,259 (reported on 4.2% of returns )93635:
$14,259California:
$19,557
(% of AGI for various income ranges: 1.1% for AGIs below $25k , 0.9% for AGIs $25k-50k , 1.0% for AGIs $50k-75k , 1.3% for AGIs $75k-100k , 2.0% for AGIs $100k-200k , 3.2% for AGIs over 200k ) Self-employment retirement plans: $30,367 (reported on 0.2% of returns )93635:
$30,367California:
$24,530
Total itemized deductions: $21,119 (25% of AGI, reported on 24.8% of returns )Here:
$21,119State:
$34,004
Here:
25.4% of AGIState:
22.7% of AGI
(% of AGI for various income ranges: 6.6% for AGIs below $25k , 8.7% for AGIs $25k-50k , 13.0% for AGIs $50k-75k , 14.9% for AGIs $75k-100k , 17.2% for AGIs $100k-200k , 13.5% for AGIs over 200k ) Charity contributions: $2,457 (reported on 18.9% of returns )(% of AGI for various income ranges: 0.4% for AGIs below $25k , 0.6% for AGIs $25k-50k , 0.9% for AGIs $50k-75k , 1.4% for AGIs $75k-100k , 1.8% for AGIs $100k-200k , 2.0% for AGIs over 200k ) Taxes paid: $6,272 (reported on 24.8% of returns )93635:
$6,272State:
$14,448
(% of AGI for various income ranges: 1.1% for AGIs below $25k , 1.8% for AGIs $25k-50k , 3.1% for AGIs $50k-75k , 4.1% for AGIs $75k-100k , 6.0% for AGIs $100k-200k , 8.1% for AGIs over 200k ) Earned income credit: $2,511 (reported on 28.6% of returns )(% of AGI for various income ranges: 9.1% for AGIs below $25k , 2.0% for AGIs $25k-50k ) Percentage of individuals using paid preparers for their 2012 taxes: 67.9%(% for various income ranges: 63.3% for AGIs below $25k , 71.1% for AGIs $25k-50k , 72.1% for AGIs $50k-75k , 71.2% for AGIs $75k-100k , 70.1% for AGIs $100k-200k , 84.6% for AGIs over 200k )
Averages for the 2004 tax year for zip code 93635, filed in 2005:
Average Adjusted Gross Income (AGI) in 2004: $44,637 (Individual Income Tax Returns) Here:
$44,637State:
$58,600
Salary/wage: $37,325 (reported on 88.6% of returns )Here:
$37,325State:
$49,455
(% of AGI for various income ranges: 131.9% for AGIs below $10k , 80.3% for AGIs $10k-25k , 85.1% for AGIs $25k-50k , 87.6% for AGIs $50k-75k , 87.4% for AGIs $75k-100k , 43.0% for AGIs over 100k ) Taxable interest for individuals: $1,421 (reported on 37.5% of returns )This zip code:
$1,421California:
$2,365
(% of AGI for various income ranges: 6.2% for AGIs below $10k , 1.2% for AGIs $10k-25k , 0.8% for AGIs $25k-50k , 0.7% for AGIs $50k-75k , 0.8% for AGIs $75k-100k , 1.9% for AGIs over 100k ) Taxable dividends: $1,930 (reported on 11.0% of returns )(% of AGI for various income ranges: 2.2% for AGIs below $10k , 0.5% for AGIs $10k-25k , 0.3% for AGIs $25k-50k , 0.4% for AGIs $50k-75k , 0.3% for AGIs $75k-100k , 0.7% for AGIs over 100k ) Net capital gain/loss: +$25,339 (reported on 9.9% of returns )Here:
+$25,339State:
+$23,418
(% of AGI for various income ranges: 12.4% for AGIs below $10k , 0.4% for AGIs $10k-25k , 0.6% for AGIs $25k-50k , 0.7% for AGIs $50k-75k , 1.6% for AGIs $75k-100k , 17.0% for AGIs over 100k ) Profit/loss from business: +$14,384 (reported on 12.4% of returns )Here:
+$14,384State:
+$16,826
(% of AGI for various income ranges: 3.0% for AGIs below $10k , 4.9% for AGIs $10k-25k , 3.9% for AGIs $25k-50k , 2.5% for AGIs $50k-75k , 2.5% for AGIs $75k-100k , 5.8% for AGIs over 100k ) IRA payment deduction: $3,078 (reported on 1.5% of returns )93635:
$3,078California:
$3,192
(% of AGI for various income ranges: 0.1% for AGIs $10k-25k , 0.1% for AGIs $25k-50k , 0.1% for AGIs $50k-75k , 0.2% for AGIs $75k-100k , 0.1% for AGIs over 100k ) Self-employed pension: $14,824 (reported on 0.6% of returns )Here:
$14,824California:
$17,688
Total itemized deductions: $22,945 (30% of AGI, reported on 39.6% of returns )Here:
$22,945State:
$28,113
Here:
29.8% of AGIState:
25.3% of AGI
(% of AGI for various income ranges: 16.0% for AGIs below $10k , 13.1% for AGIs $10k-25k , 20.0% for AGIs $25k-50k , 25.3% for AGIs $50k-75k , 24.5% for AGIs $75k-100k , 17.2% for AGIs over 100k ) Charity contributions deductions: $2,226 (3% of AGI, reported on 31.8% of returns )Here:
2.7% of AGIState:
3.3% of AGI
(% of AGI for various income ranges: 0.5% for AGIs below $10k , 0.7% for AGIs $10k-25k , 1.1% for AGIs $25k-50k , 1.5% for AGIs $50k-75k , 1.7% for AGIs $75k-100k , 2.3% for AGIs over 100k ) Total tax: $5,187 (reported on 65.2% of returns )93635:
$5,187State:
$10,761
(% of AGI for various income ranges: 4.4% for AGIs below $10k , 3.1% for AGIs $10k-25k , 4.7% for AGIs $25k-50k , 6.1% for AGIs $50k-75k , 8.4% for AGIs $75k-100k , 12.2% for AGIs over 100k ) Earned income credit: $1,884 (reported on 21.1% of returns )Percentage of individuals using paid preparers for their 2004 taxes: 72.1%(% for various income ranges: 59.7% for AGIs below $10k , 71.3% for AGIs $10k-25k , 75.3% for AGIs $25k-50k , 78.7% for AGIs $50k-75k , 73.1% for AGIs $75k-100k , 76.4% for AGIs over 100k )
Estimated median household income in 2022: This zip code:
$75,231California:
$91,551
Nearest zip codes: 95322 ,
93620 ,
93665 ,
95374 ,
95334 ,
95301 .
Percentage of family households: This zip code:
60.5%California:
46.8%
Percentage of households with unmarried partners: This zip code:
4.9%California:
48.1%
No gay or lesbian households reported
Household received Food Stamps/SNAP in the past 12 months: 2,368Household did not receive Food Stamps/SNAP in the past 12 months: 11,051
Women who had a birth in the past 12 months: 510 (264 now married , 248 unmarried) Women who did not have a birth in the past 12 months: 10,051 (4,507 now married , 5,521 unmarried)
Housing units in zip code 93635 with a mortgage: 4,966 (178
second mortgage , 53
home equity loan , 70
both second mortgage and home equity loan )
Median monthly owner costs for units with a mortgage: $1,936
Median monthly owner costs for units without a mortgage: $616
Residents with income below the poverty level in 2022:
This zip code:
15.2%Whole state:
12.2%
Residents with income below 50% of the poverty level in 2022:
This zip code:
7.7%Whole state:
6.2%
Median number of rooms in houses and condos: Median number of rooms in apartments:
Year house built (houses)
150 2020 or later1,518 2010 to 20193,344 2000 to 20093,029 1990 to 19991,292 1980 to 19891,768 1970 to 1979850 1960 to 1969710 1950 to 1959869 1940 to 1949413 1939 or earlier
Zip code 93635 household income distribution in 2022 646 Less than $10,000240 $10,000 to $14,999602 $15,000 to $19,999777 $20,000 to $24,999502 $25,000 to $29,999712 $30,000 to $34,999466 $35,000 to $39,999356 $40,000 to $44,999454 $45,000 to $49,999813 $50,000 to $59,999990 $60,000 to $74,9992,738 $75,000 to $99,9991,587 $100,000 to $124,999691 $125,000 to $149,999805 $150,000 to $199,999866 $200,000 or moreEstimate of home value of owner-occupied houses/condos in 2022 in zip code 93635 191 Less than $10,00013 $10,000 to $14,99913 $20,000 to $24,99913 $25,000 to $29,99946 $35,000 to $39,9997 $100,000 to $124,99915 $125,000 to $149,99925 $150,000 to $174,99986 $175,000 to $199,999230 $200,000 to $249,999361 $250,000 to $299,9992,189 $300,000 to $399,9991,885 $400,000 to $499,9991,206 $500,000 to $749,99975 $750,000 to $999,999137 $1,000,000 to $1,499,99951 $1,500,000 to $1,999,99962 $2,000,000 or moreRent paid by renters in 2022 in zip code 93635 52 $100 to $14961 $200 to $24957 $250 to $29950 $350 to $399153 $400 to $44937 $450 to $499353 $500 to $54948 $550 to $599126 $600 to $64938 $650 to $699132 $700 to $74941 $750 to $799392 $800 to $899285 $900 to $9991,460 $1,000 to $1,249663 $1,250 to $1,4991,028 $1,500 to $1,999195 $2,000 to $2,49942 $2,500 to $2,99928 $3,000 to $3,499445 No cash rent
Median gross rent in 2022: $1,430.
Median price asked for vacant for-sale houses and condos in 2022: $327,589.
Estimated median house (or condo) value in 2022 for: White Non-Hispanic householders: $421,446Black or African American householders: $501,824American Indian or Alaska Native householders: $450,480Asian householders: $517,716Native Hawaiian and other Pacific Islander householders: $319,981Some other race householders: $437,644Two or more races householders: $463,010Hispanic or Latino householders: $424,502Estimated median house or condo value in 2022: $428,476
93635:
$428,476California:
$715,900
Lower value quartile - upper value quartile: $356,875 - $524,379
Mean price in 2022: Detached houses: $215,377Here:
$215,377State:
$988,808
Townhouses or other attached units: $243,332Here:
$243,332State:
$838,546
Mobile homes: $8,246Here:
$8,246State:
$184,506
Housing units in structures:
One, detached: 11,557One, attached: 315Two: 2753 or 4: 3555 to 9: 44910 to 19: 17720 to 49: 10050 or more: 88Mobile homes: 543Boats, RVs, vans, etc.: 34Unemployment : 6.7%
Means of transportation to work in zip code 93635 70.6% 12,133 Drove a car alone17.4% 2,995 Carpooled0.2% 28 Bus or trolley bus0.3% 44 Bicycle2.3% 399 Walked0.6% 104 Other means7.5% 1,282 Worked at homeTravel time to work (commute) in zip code 93635 804 Less than 5 minutes2,490 5 to 9 minutes1,859 10 to 14 minutes874 15 to 19 minutes675 20 to 24 minutes139 25 to 29 minutes216 30 to 34 minutes214 35 to 39 minutes209 40 to 44 minutes1,223 45 to 59 minutes2,504 60 to 89 minutes4,278 90 or more minutes
Percentage of zip code residents living and working in this county: 53.5%
Household type by relationship:
Households: 47,287
Male householders: 6,975 (1,583 living alone ), Female householders: 6,297 (888 living alone )7,397 spouses (7,358 opposite-sex spouses ), 1,134 unmarried partners , (1,113 opposite-sex unmarried partners ), 18,123 children (17,529 natural , 138 adopted , 458 stepchildren ), 2,402 grandchildren , 910 brothers or sisters , 1,189 parents , 64 foster children , 1,505 other relatives , 849 non-relatives In group quarters: 209 (-1 institutionalized population )
Size of family households: 2,663 2-persons , 1,841 3-persons , 2,670 4-persons , 1,898 5-persons , 660 6-persons , 626 7-or-more-persons
Size of nonfamily households: 2,460 1-person , 223 2-persons , 58 3-persons , 58 4-persons
8,253 married couples with children. single-parent households (1,451 men , 2,834 women ).
46.8% of residents of 93635 zip code speak English at home. of residents speak Spanish at home (51% very well, 24% well, 16% not well, 10% not at all ).of residents speak other Indo-European language at home (48% very well, 7% well, 37% not well, 8% not at all ).of residents speak Asian or Pacific Island language at home (42% very well, 28% well, 30% not well ).
Foreign born population: 12,842 (27.2%)
(41.4%
of them are naturalized citizens )
This zip code:
27.2%Whole state:
26.7%
78% Honduras 4% Italy 3% Portugal 2% El Salvador 2% Costa Rica 1% Thailand 1% Guyana 3% Portuguese 2% American 2% German 1% Irish 1% English 1% Italian 0% French Canadian
Year of entry for the foreign-born population
1,759 2010 or later 3,992 2000 to 2009 2,827 1990 to 1999 4,779 Before 1990
Major facilities with environmental interests located in this zip code:
INGOMAR PACKING CO (9950 SOUTH INGOMAR GRADE in LOS BANOS, CA)
AIR MAJOR (AIRS/AFS) STATE MASTER (California - Hazardous Waste Tracking) - HAZARDOU WASTE PROGRAM Small Quantity Generators, between 100 kg and 1000 kg of hazardous waste/month (Resource Conservation and Recovery Act (tracking hazardous waste)) - notification TRI REPORTER (Tracking of toxic chemicals releasing facilities) Business SIC classification: CANNED FRUITS, VEGETABLES, PRESERVES, JAMS, AND JELLIES
CHEVRON PIPE LINE COMPANY (JENSEN RD in LOS BANOS, CA)
STATE MASTER (California - Hazardous Waste Tracking) - HAZARDOU WASTE PROGRAM Small Quantity Generators, between 100 kg and 1000 kg of hazardous waste/month (Resource Conservation and Recovery Act (tracking hazardous waste)) Alternative names: CHEVRON USA INC LOS BANOS STA
MCELVANY (13343 JOHNSON RD in LOS BANOS, CA)
STATE MASTER (California - Hazardous Waste Tracking) - HAZARDOU WASTE PROGRAM Small Quantity Generators, between 100 kg and 1000 kg of hazardous waste/month (Resource Conservation and Recovery Act (tracking hazardous waste)) - notification Organizations: CHARLES MCELVANY (CONTACT/OWNER)
LIFETIME DOORS INC (G STREET in LOS BANOS, CA)
STATE MASTER (California - Hazardous Waste Tracking) - HAZARDOU WASTE PROGRAM Small Quantity Generators, between 100 kg and 1000 kg of hazardous waste/month (Resource Conservation and Recovery Act (tracking hazardous waste)) Business NAICS classification: METAL WINDOW AND DOOR MANUFACTURING.
MEMORIAL HOSPITAL LOS BANOS (520 W I ST in LOS BANOS, CA)
STATE MASTER (California - Hazardous Waste Tracking) - HAZARDOU WASTE PROGRAM Small Quantity Generators, between 100 kg and 1000 kg of hazardous waste/month (Resource Conservation and Recovery Act (tracking hazardous waste)) - notification Organizations: BOARD OF DIRECTORS (CONTACT/OWNER)
Alternative names: LOS BANOS COMMUNITY HOSPITAL
MIANO (R.M.) ELEMENTARY (1129 B ST. in LOS BANOS, CA)
(National Center for Education Statistics) - STATE ID-6025563 Organizations: LOS BANOS UNIFIED (SCHOOL DISTRICT)
HENRY MILLER ELEMENTARY (545 WEST L ST. in LOS BANOS, CA)
(National Center for Education Statistics) - STATE ID-6025548 Organizations: LOS BANOS UNIFIED (SCHOOL DISTRICT)
LOS BANOS JUNIOR HIGH (7TH & K STS. in LOS BANOS, CA)
(National Center for Education Statistics) - STATE ID-6058689 Organizations: LOS BANOS UNIFIED (SCHOOL DISTRICT)
CHARLESTON ELEMENTARY (18463 W. CHARLESTON ROAD in LOS BANOS, CA)
(National Center for Education Statistics) - STATE ID-6025530 Organizations: LOS BANOS UNIFIED (SCHOOL DISTRICT)
LOS BANOS COMMUNITY DAY (975 I ST. in LOS BANOS, CA)
(National Center for Education Statistics) - STATE ID-2430189 Organizations: LOS BANOS UNIFIED (SCHOOL DISTRICT)
LOS BANOS ELEMENTARY (1260 SEVENTH ST. in LOS BANOS, CA)
(National Center for Education Statistics) - STATE ID-6025555 Organizations: LOS BANOS UNIFIED (SCHOOL DISTRICT)
LOS BANOS HIGH (1966 11TH ST. in LOS BANOS, CA)
(National Center for Education Statistics) - STATE ID-2434207 Organizations: LOS BANOS UNIFIED (SCHOOL DISTRICT)
CALIFORNIA DAIRIES INC (1155 PACHECO BOULEVARD in LOS BANOS, CA)
AIR SYNTHETIC MINOR (AIRS/AFS) CRITERIA AND HAZARDOUS AIR POLLUTANT INVENTORY (Inventory of air pollution sources) National Pollutant Discharge Elimination System NON-MAJOR (Tracking pollutant discharge elimination systems) - permit TRI REPORTER (Tracking of toxic chemicals releasing facilities) Business SIC classification: NATURAL, PROCESSED, AND IMITATION CHEESE; DRY, CONDENSED, AND EVAPORATED DAIRY PRODUCTS; FLUID MILKOrganizations: SAN JOAQUIN VALLEY DAIRYMEN (CONTACT/OWNER)
Alternative names: MILK PROCESSING FACILITY, SAN JOAQUIN VALLEY DAIRYMEN
Housing units lacking complete plumbing facilities: 1.3%
Housing units lacking complete kitchen facilities: 2.0%
48.6% Utility gas 46.6% Electricity 1.8% Bottled, tank, or LP gas 1.5% Solar energy 0.6% Wood
Population in 1990: 18,199. Population change in the 1990s: +10,921 (+60.0%).
Place of birth for U.S.-born residents:
This state: 30,330Northeast: 625Midwest: 575South: 1,245West: 1,064
50% of the 93635 zip code residents lived in the same house 5 years ago.
Out of people who lived in different houses, 35% lived in this county.
Out of people who lived in different counties, 50% lived in California.
90% of the 93635 zip code residents lived in the same house 1 year ago.
Out of people who lived in different houses, 36% moved from this county.
Out of people who lived in different houses, 51% moved from different county within same state.
Out of people who lived in different houses, 3% moved from different state.
Out of people who lived in different houses, 13% moved from abroad.
Private vs. public school enrollment:
Students in private schools in grades 1 to 8 (elementary and middle school): 350
Here:
5.0%California:
10.5%
Students in private schools in grades 9 to 12 (high school): 185
Students in private undergraduate colleges: 150
Here:
8.2%California:
15.9%
Occupation by median earnings in the past 12 months ($)
107,736 Health diagnosing and treating practitioners and other technical occupations 78,506 Law enforcement workers including supervisors 74,781 Business and financial operations occupations 69,823 Management occupations 67,777 Life, physical, and social science occupations 65,846 Fire fighting and prevention, and other protective service workers including supervisors
Companies with federal contracts located in this zip code:
SOIL TECH, INC (2140 ARROYO CT in LOS BANOS, CA; small business)
$97,500 with Army for Hazardous Substance Removal, Cleanup, and Disposal Services and Operational Support. Signed on 2000-08-22. Completion date: 2000-09-15.
Top industries in this zip code by the number of employees in 2005:
Accommodation and Food Services: Limited-Service Restaurants (50-99 employees: 1 establishment, 20-49 employees: 7 establishments, 10-19 employees: 7 establishments, 5-9 employees: 3 establishments, 1-4 employees: 5 establishments)Accommodation and Food Services: Full-Service Restaurants (50-99: 2, 20-49: 1, 10-19: 5, 5-9: 1, 1-4: 5)Health Care and Social Assistance: Nursing Care Facilities (100-249: 1)Health Care and Social Assistance: General Medical and Surgical Hospitals (100-249: 1)Administrative and Support and Waste Management and Remediation Services: Solid Waste Collection (100-249: 1)Health Care and Social Assistance: Offices of Physicians (except Mental Health Specialists) (10-19: 3, 5-9: 6, 1-4: 7)
People in group quarters in 2010:
78 people in nursing facilities/skilled-nursing facilities
68 people in other noninstitutional facilities
49 people in workers' group living quarters and job corps centers
23 people in residential treatment centers for adults
People in group quarters in 2000:
149 people in nursing homes
109 people in agriculture workers' dormitories on farms
10 people in other noninstitutional group quarters
6 people in unknown juvenile institutions
Home Mortgage Disclosure Act Aggregated Statistics For Year 2009(Based on 4 full and 4 partial tracts) A) FHA, FSA/RHS & VA B) Conventional C) Refinancings D) Home Improvement Loans E) Loans on Dwellings For 5+ Families F) Non-occupant Loans on G) Loans On Manufactured Number Average Value Number Average Value Number Average Value Number Average Value Number Average Value Number Average Value Number Average Value
LOANS ORIGINATED 616 $131,233 408 $99,262 180 $171,782 8 $66,875 1 $69,730 200 $84,398 2 $265,470 APPLICATIONS APPROVED, NOT ACCEPTED 49 $136,726 45 $125,094 35 $172,501 5 $28,990 0 $0 31 $116,743 1 $86,960 APPLICATIONS DENIED 123 $134,743 105 $111,442 213 $187,702 27 $64,243 0 $0 70 $93,278 6 $119,493 APPLICATIONS WITHDRAWN 87 $133,272 57 $101,331 88 $205,034 10 $130,666 1 $88,000 31 $88,079 1 $24,610 FILES CLOSED FOR INCOMPLETENESS 25 $130,159 17 $118,525 28 $199,313 0 $0 0 $0 10 $125,148 0 $0
Aggregated Statistics For Year 2008(Based on 4 full and 4 partial tracts) A) FHA, FSA/RHS & VA B) Conventional C) Refinancings D) Home Improvement Loans E) Loans on Dwellings For 5+ Families F) Non-occupant Loans on G) Loans On Manufactured Number Average Value Number Average Value Number Average Value Number Average Value Number Average Value Number Average Value Number Average Value
LOANS ORIGINATED 472 $175,729 544 $143,941 161 $214,338 34 $66,008 1 $615,300 205 $119,328 8 $333,660 APPLICATIONS APPROVED, NOT ACCEPTED 27 $176,682 112 $195,523 94 $208,208 9 $44,468 0 $0 29 $156,500 4 $119,748 APPLICATIONS DENIED 124 $187,411 256 $186,904 443 $258,928 72 $89,049 1 $360,000 104 $150,013 14 $69,481 APPLICATIONS WITHDRAWN 70 $179,583 114 $159,340 119 $246,251 10 $111,612 0 $0 48 $141,231 1 $10,120 FILES CLOSED FOR INCOMPLETENESS 9 $186,667 41 $194,640 33 $233,623 4 $72,500 0 $0 8 $126,884 0 $0
Aggregated Statistics For Year 2007(Based on 4 full and 4 partial tracts) A) FHA, FSA/RHS & VA B) Conventional C) Refinancings D) Home Improvement Loans E) Loans on Dwellings For 5+ Families F) Non-occupant Loans on G) Loans On Manufactured Number Average Value Number Average Value Number Average Value Number Average Value Number Average Value Number Average Value Number Average Value
LOANS ORIGINATED 24 $289,618 595 $238,716 1,118 $269,586 154 $172,552 4 $942,630 208 $235,789 16 $84,588 APPLICATIONS APPROVED, NOT ACCEPTED 1 $205,100 199 $236,627 382 $282,534 42 $198,718 0 $0 38 $247,564 5 $68,358 APPLICATIONS DENIED 8 $282,125 487 $250,661 1,270 $307,108 185 $169,380 1 $102,550 152 $273,960 22 $146,985 APPLICATIONS WITHDRAWN 4 $304,000 176 $251,798 436 $312,165 45 $114,894 0 $0 44 $267,553 2 $92,420 FILES CLOSED FOR INCOMPLETENESS 0 $0 46 $297,859 145 $301,193 13 $245,598 0 $0 12 $294,971 0 $0
Aggregated Statistics For Year 2006(Based on 4 full and 4 partial tracts) A) FHA, FSA/RHS & VA B) Conventional C) Refinancings D) Home Improvement Loans E) Loans on Dwellings For 5+ Families F) Non-occupant Loans on G) Loans On Manufactured Number Average Value Number Average Value Number Average Value Number Average Value Number Average Value Number Average Value Number Average Value
LOANS ORIGINATED 0 $0 1,670 $251,885 2,229 $288,471 359 $197,020 2 $860,000 377 $261,386 7 $124,759 APPLICATIONS APPROVED, NOT ACCEPTED 0 $0 401 $264,179 565 $292,324 84 $126,177 0 $0 96 $281,625 5 $98,774 APPLICATIONS DENIED 1 $415,000 774 $263,648 1,396 $300,246 251 $140,655 1 $217,410 199 $265,735 18 $133,112 APPLICATIONS WITHDRAWN 0 $0 359 $269,137 805 $295,067 89 $216,627 0 $0 93 $266,294 7 $116,867 FILES CLOSED FOR INCOMPLETENESS 0 $0 66 $280,282 200 $299,514 22 $142,703 0 $0 24 $264,258 0 $0
Aggregated Statistics For Year 2005(Based on 4 full and 4 partial tracts) A) FHA, FSA/RHS & VA B) Conventional C) Refinancings D) Home Improvement Loans E) Loans on Dwellings For 5+ Families F) Non-occupant Loans on G) Loans On Manufactured Number Average Value Number Average Value Number Average Value Number Average Value Number Average Value Number Average Value Number Average Value
LOANS ORIGINATED 2 $235,955 2,586 $240,578 2,789 $264,986 364 $198,559 1 $360,000 581 $253,871 20 $143,142 APPLICATIONS APPROVED, NOT ACCEPTED 0 $0 541 $240,186 515 $252,886 62 $132,175 1 $275,000 73 $248,792 9 $100,444 APPLICATIONS DENIED 0 $0 948 $242,396 1,244 $277,159 256 $121,037 0 $0 188 $277,764 40 $119,803 APPLICATIONS WITHDRAWN 0 $0 485 $256,415 964 $263,481 106 $195,056 2 $124,700 111 $258,160 10 $142,234 FILES CLOSED FOR INCOMPLETENESS 0 $0 135 $257,503 292 $259,333 18 $107,629 0 $0 51 $286,276 2 $190,360
Aggregated Statistics For Year 2004(Based on 4 full and 4 partial tracts) A) FHA, FSA/RHS & VA B) Conventional C) Refinancings D) Home Improvement Loans E) Loans on Dwellings For 5+ Families F) Non-occupant Loans on G) Loans On Manufactured Number Average Value Number Average Value Number Average Value Number Average Value Number Average Value Number Average Value Number Average Value
LOANS ORIGINATED 6 $246,600 2,012 $187,739 2,250 $202,033 162 $132,198 6 $557,137 374 $180,590 19 $150,699 APPLICATIONS APPROVED, NOT ACCEPTED 3 $227,440 399 $195,944 526 $207,391 41 $111,682 0 $0 64 $188,598 14 $77,796 APPLICATIONS DENIED 2 $208,660 544 $192,113 1,445 $203,960 183 $103,847 1 $320,000 120 $183,051 21 $75,768 APPLICATIONS WITHDRAWN 1 $143,000 344 $222,617 918 $198,879 60 $124,224 0 $0 63 $188,664 12 $120,438 FILES CLOSED FOR INCOMPLETENESS 0 $0 55 $194,608 303 $205,929 14 $70,979 0 $0 28 $185,342 1 $128,660
Aggregated Statistics For Year 2003(Based on 4 full and 4 partial tracts) A) FHA, FSA/RHS & VA B) Conventional C) Refinancings D) Home Improvement Loans E) Loans on Dwellings For 5+ Families F) Non-occupant Loans on Number Average Value Number Average Value Number Average Value Number Average Value Number Average Value Number Average Value
LOANS ORIGINATED 36 $197,147 1,540 $163,090 2,517 $157,980 96 $51,599 1 $347,000 339 $143,028 APPLICATIONS APPROVED, NOT ACCEPTED 2 $130,500 217 $181,787 564 $175,266 29 $56,514 1 $50,000 42 $173,117 APPLICATIONS DENIED 9 $162,760 338 $162,541 1,405 $175,618 101 $38,062 1 $1,300,000 106 $154,300 APPLICATIONS WITHDRAWN 9 $136,778 241 $171,814 829 $170,863 18 $73,930 0 $0 63 $144,868 FILES CLOSED FOR INCOMPLETENESS 0 $0 20 $199,164 152 $172,536 4 $32,980 0 $0 15 $167,322
Aggregated Statistics For Year 2002(Based on 2 full and 2 partial tracts) A) FHA, FSA/RHS & VA B) Conventional C) Refinancings D) Home Improvement Loans E) Loans on Dwellings For 5+ Families F) Non-occupant Loans on Number Average Value Number Average Value Number Average Value Number Average Value Number Average Value Number Average Value
LOANS ORIGINATED 19 $198,296 492 $159,100 912 $154,417 50 $36,534 1 $600,000 95 $130,802 APPLICATIONS APPROVED, NOT ACCEPTED 7 $131,313 60 $171,920 185 $169,542 32 $28,923 0 $0 6 $163,202 APPLICATIONS DENIED 2 $177,460 102 $142,351 485 $164,926 52 $37,953 0 $0 21 $145,849 APPLICATIONS WITHDRAWN 3 $168,667 104 $173,700 371 $172,789 10 $37,959 0 $0 15 $149,779 FILES CLOSED FOR INCOMPLETENESS 2 $160,390 38 $171,761 109 $149,010 3 $26,103 0 $0 4 $82,250
Aggregated Statistics For Year 2001(Based on 2 full and 2 partial tracts) A) FHA, FSA/RHS & VA B) Conventional C) Refinancings D) Home Improvement Loans E) Loans on Dwellings For 5+ Families F) Non-occupant Loans on Number Average Value Number Average Value Number Average Value Number Average Value Number Average Value Number Average Value
LOANS ORIGINATED 34 $168,130 587 $156,500 1,025 $150,170 74 $35,988 1 $285,000 94 $123,533 APPLICATIONS APPROVED, NOT ACCEPTED 2 $107,060 65 $148,094 136 $136,167 23 $43,443 0 $0 16 $137,594 APPLICATIONS DENIED 6 $148,000 147 $152,193 470 $137,762 73 $25,293 0 $0 19 $160,709 APPLICATIONS WITHDRAWN 4 $120,152 121 $162,831 316 $146,994 22 $59,260 0 $0 14 $135,034 FILES CLOSED FOR INCOMPLETENESS 1 $201,000 26 $176,410 94 $154,218 5 $25,600 0 $0 1 $153,000
Aggregated Statistics For Year 2000(Based on 2 full and 2 partial tracts) A) FHA, FSA/RHS & VA B) Conventional C) Refinancings D) Home Improvement Loans E) Loans on Dwellings For 5+ Families F) Non-occupant Loans on Number Average Value Number Average Value Number Average Value Number Average Value Number Average Value Number Average Value
LOANS ORIGINATED 103 $138,434 618 $132,156 227 $104,197 71 $30,752 0 $0 53 $99,060 APPLICATIONS APPROVED, NOT ACCEPTED 11 $137,283 81 $125,157 57 $110,874 61 $29,564 0 $0 8 $85,045 APPLICATIONS DENIED 17 $124,395 218 $123,174 281 $98,823 79 $30,233 1 $119,000 24 $75,967 APPLICATIONS WITHDRAWN 16 $149,620 122 $130,347 149 $89,735 9 $42,019 0 $0 13 $113,923 FILES CLOSED FOR INCOMPLETENESS 2 $176,500 31 $155,303 56 $112,445 1 $28,710 0 $0 2 $69,690
Aggregated Statistics For Year 1999(Based on 5 full and 2 partial tracts) A) FHA, FSA/RHS & VA B) Conventional C) Refinancings D) Home Improvement Loans E) Loans on Dwellings For 5+ Families F) Non-occupant Loans on Number Average Value Number Average Value Number Average Value Number Average Value Number Average Value Number Average Value
LOANS ORIGINATED 199 $127,956 463 $112,639 444 $88,205 98 $30,541 8 $521,750 65 $77,297 APPLICATIONS APPROVED, NOT ACCEPTED 7 $142,449 67 $107,340 120 $91,436 57 $26,196 0 $0 11 $82,895 APPLICATIONS DENIED 17 $118,470 147 $109,413 452 $77,998 143 $28,861 0 $0 37 $74,777 APPLICATIONS WITHDRAWN 35 $128,053 100 $130,437 273 $92,724 7 $44,304 2 $110,500 11 $91,865 FILES CLOSED FOR INCOMPLETENESS 0 $0 16 $111,978 79 $97,136 4 $33,872 0 $0 4 $88,750
Private Mortgage Insurance Companies Aggregated Statistics For Year 2009(Based on 4 full and 4 partial tracts) A) Conventional B) Refinancings C) Non-occupant Loans on Number Average Value Number Average Value Number Average Value
LOANS ORIGINATED 55 $130,549 0 $0 1 $76,000 APPLICATIONS APPROVED, NOT ACCEPTED 23 $163,508 3 $193,667 1 $130,000 APPLICATIONS DENIED 13 $153,271 1 $57,430 0 $0 APPLICATIONS WITHDRAWN 4 $169,718 0 $0 0 $0 FILES CLOSED FOR INCOMPLETENESS 7 $197,643 0 $0 2 $211,000
Aggregated Statistics For Year 2008(Based on 4 full and 4 partial tracts) A) Conventional B) Refinancings C) Non-occupant Loans on Number Average Value Number Average Value Number Average Value
LOANS ORIGINATED 202 $195,113 25 $296,677 18 $169,315 APPLICATIONS APPROVED, NOT ACCEPTED 121 $244,895 32 $318,934 11 $248,727 APPLICATIONS DENIED 44 $196,376 4 $333,000 10 $215,600 APPLICATIONS WITHDRAWN 19 $189,737 6 $290,990 0 $0 FILES CLOSED FOR INCOMPLETENESS 14 $252,571 0 $0 0 $0
Aggregated Statistics For Year 2007(Based on 4 full and 4 partial tracts) A) Conventional B) Refinancings C) Non-occupant Loans on D) Loans On Manufactured Number Average Value Number Average Value Number Average Value Number Average Value
LOANS ORIGINATED 99 $314,384 76 $349,793 9 $283,508 0 $0 APPLICATIONS APPROVED, NOT ACCEPTED 11 $336,880 34 $366,394 1 $224,000 1 $154,680 APPLICATIONS DENIED 9 $313,111 4 $378,000 2 $266,500 0 $0 APPLICATIONS WITHDRAWN 12 $336,250 6 $293,555 2 $332,000 0 $0 FILES CLOSED FOR INCOMPLETENESS 0 $0 2 $400,000 0 $0 0 $0
Aggregated Statistics For Year 2006(Based on 4 full and 4 partial tracts) A) Conventional B) Refinancings D) Loans On Manufactured Number Average Value Number Average Value Number Average Value
LOANS ORIGINATED 20 $317,618 26 $394,919 1 $172,030 APPLICATIONS APPROVED, NOT ACCEPTED 2 $273,360 6 $378,463 0 $0 APPLICATIONS DENIED 2 $395,000 2 $455,000 0 $0 APPLICATIONS WITHDRAWN 0 $0 3 $431,333 0 $0 FILES CLOSED FOR INCOMPLETENESS 1 $410,200 0 $0 0 $0
Aggregated Statistics For Year 2005(Based on 4 full and 4 partial tracts) A) Conventional B) Refinancings C) Non-occupant Loans on D) Loans On Manufactured Number Average Value Number Average Value Number Average Value Number Average Value
LOANS ORIGINATED 34 $318,447 43 $292,336 3 $263,240 2 $176,100 APPLICATIONS APPROVED, NOT ACCEPTED 11 $335,577 12 $254,132 3 $290,720 0 $0 APPLICATIONS DENIED 6 $318,033 0 $0 0 $0 1 $164,800 APPLICATIONS WITHDRAWN 2 $318,830 5 $374,328 0 $0 0 $0 FILES CLOSED FOR INCOMPLETENESS 0 $0 0 $0 0 $0 0 $0
Aggregated Statistics For Year 2004(Based on 4 full and 4 partial tracts) A) Conventional B) Refinancings C) Non-occupant Loans on D) Loans On Manufactured Number Average Value Number Average Value Number Average Value Number Average Value
LOANS ORIGINATED 97 $254,835 98 $230,855 12 $230,167 1 $245,300 APPLICATIONS APPROVED, NOT ACCEPTED 19 $262,502 41 $223,662 5 $234,754 0 $0 APPLICATIONS DENIED 0 $0 6 $260,167 0 $0 1 $292,000 APPLICATIONS WITHDRAWN 2 $253,650 5 $196,600 0 $0 1 $213,300 FILES CLOSED FOR INCOMPLETENESS 4 $266,690 0 $0 0 $0 0 $0
Aggregated Statistics For Year 2003(Based on 4 full and 4 partial tracts) A) Conventional B) Refinancings C) Non-occupant Loans on Number Average Value Number Average Value Number Average Value
LOANS ORIGINATED 198 $212,327 161 $201,288 24 $174,079 APPLICATIONS APPROVED, NOT ACCEPTED 25 $241,327 55 $212,272 6 $169,612 APPLICATIONS DENIED 6 $192,980 8 $189,859 4 $174,462 APPLICATIONS WITHDRAWN 6 $210,002 8 $197,905 2 $202,000 FILES CLOSED FOR INCOMPLETENESS 1 $174,000 2 $268,000 0 $0
Aggregated Statistics For Year 2002(Based on 2 full and 2 partial tracts) A) Conventional B) Refinancings C) Non-occupant Loans on Number Average Value Number Average Value Number Average Value
LOANS ORIGINATED 98 $190,833 62 $201,541 6 $135,833 APPLICATIONS APPROVED, NOT ACCEPTED 9 $199,557 21 $206,229 1 $164,000 APPLICATIONS DENIED 0 $0 0 $0 0 $0 APPLICATIONS WITHDRAWN 1 $221,000 3 $230,667 0 $0 FILES CLOSED FOR INCOMPLETENESS 0 $0 0 $0 0 $0
Aggregated Statistics For Year 2001(Based on 2 full and 2 partial tracts) A) Conventional B) Refinancings C) Non-occupant Loans on Number Average Value Number Average Value Number Average Value
LOANS ORIGINATED 150 $200,567 73 $181,146 3 $203,000 APPLICATIONS APPROVED, NOT ACCEPTED 28 $186,114 15 $173,311 4 $170,768 APPLICATIONS DENIED 6 $212,500 3 $197,223 0 $0 APPLICATIONS WITHDRAWN 1 $240,000 5 $185,400 0 $0 FILES CLOSED FOR INCOMPLETENESS 1 $155,060 1 $178,000 0 $0
Aggregated Statistics For Year 2000(Based on 2 full and 2 partial tracts) A) Conventional B) Refinancings C) Non-occupant Loans on Number Average Value Number Average Value Number Average Value
LOANS ORIGINATED 153 $162,565 18 $162,583 4 $122,715 APPLICATIONS APPROVED, NOT ACCEPTED 15 $152,412 6 $119,810 1 $106,000 APPLICATIONS DENIED 4 $161,785 1 $125,000 0 $0 APPLICATIONS WITHDRAWN 6 $135,323 1 $149,000 0 $0 FILES CLOSED FOR INCOMPLETENESS 0 $0 0 $0 0 $0
Aggregated Statistics For Year 1999(Based on 3 full and 2 partial tracts) A) Conventional B) Refinancings C) Non-occupant Loans on Number Average Value Number Average Value Number Average Value
LOANS ORIGINATED 162 $140,605 73 $115,654 5 $86,834 APPLICATIONS APPROVED, NOT ACCEPTED 15 $134,789 13 $123,899 0 $0 APPLICATIONS DENIED 11 $124,718 7 $150,286 3 $98,667 APPLICATIONS WITHDRAWN 6 $141,540 8 $110,010 2 $101,500 FILES CLOSED FOR INCOMPLETENESS 0 $0 2 $141,500 0 $0
2005 - 2018 National Fire Incident Reporting System (NFIRS) incidents See full 2006 National Fire Incident Reporting System statistics for zip code 93635, California
Most common first names in zip code 93635 among deceased individuals Name Count Lived (average)
Mary 128 78.6 years John 119 75.6 years Joe 88 76.8 years Frank 79 72.3 years Maria 77 81.3 years William 71 72.9 years James 70 74.2 years Robert 56 67.2 years Charles 48 75.1 years Manuel 48 74.5 years
Most common last names in zip code 93635 among deceased individuals Last name Count Lived (average)
Lewis 39 73.8 years Silva 39 78.6 years Souza 38 77.3 years Smith 32 73.3 years Garcia 28 72.2 years Toscano 28 80.5 years Brown 27 72.8 years Gomes 22 78.8 years Johnson 21 76.2 years Rocha 19 78.8 years
Businesses in zip code 93635
Name Count Name Count
7-Eleven 1 KFC 1 AT&T 1 Kmart 1 AutoZone 1 Little Caesars Pizza 1 Baskin-Robbins 1 Lowe's 1 Best Western 1 McDonald's 3 Big O Tires 1 Nike 2 Burger King 1 Panda Express 1 Carl\s Jr. 2 Payless 1 Circle K 3 Penske 1 Cricket Wireless 2 Pizza Hut 1 Dairy Queen 1 Quiznos 1 Days Inn 1 RadioShack 1 Dennys 1 Rite Aid 1 Domino's Pizza 1 Rue21 1 Famous Footwear 1 Sprint Nextel 1 Fashion Bug 1 Starbucks 3 FedEx 3 T-Mobile 2 Ford 1 Taco Bell 2 GNC 2 Target 1 GameStop 1 True Value 1 H&R Block 1 U-Haul 2 Home Depot 1 UPS 2 JCPenney 1 Vans 2 Jamba Juice 1 Walgreens 1 Jones New York 2 Walmart 1
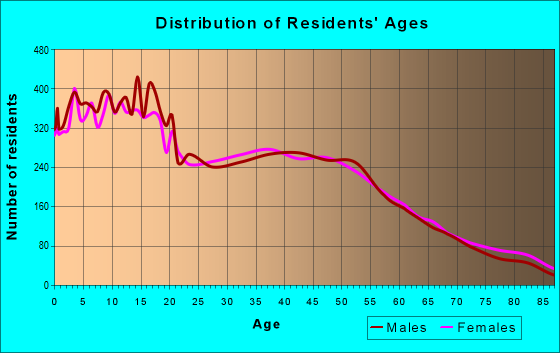
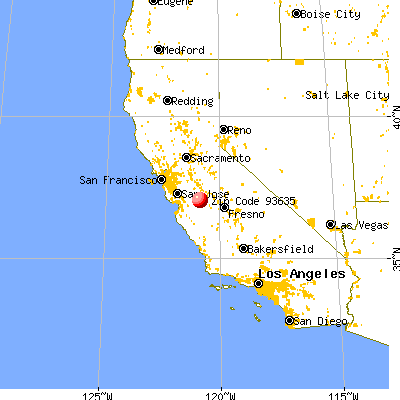


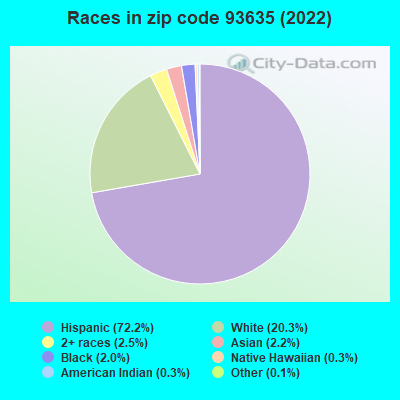


 Nearest zip codes: 95322, 93620, 93665, 95374, 95334, 95301.
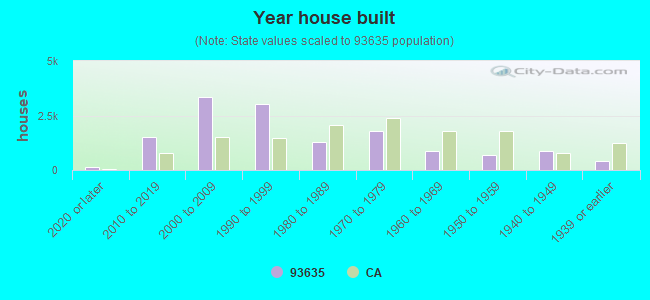
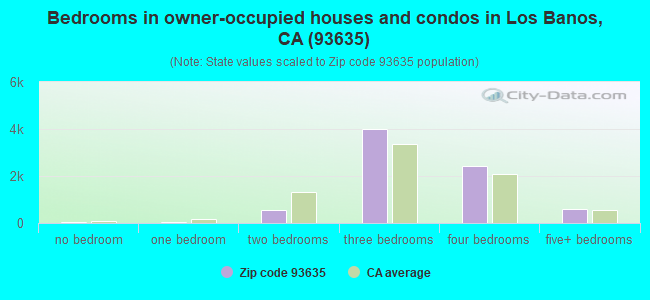
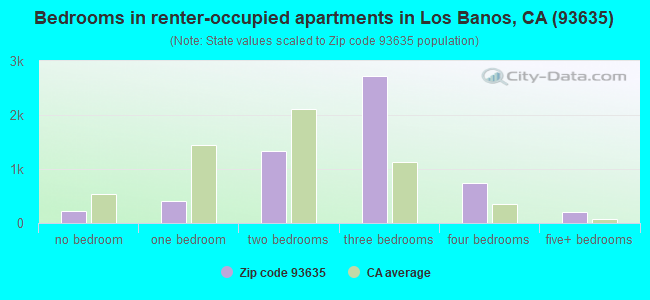
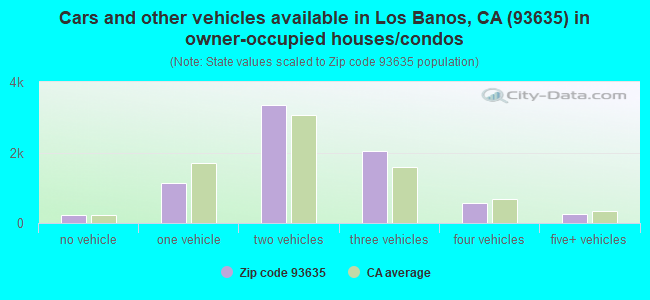
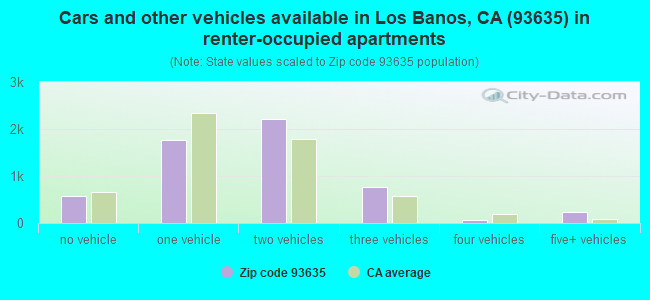


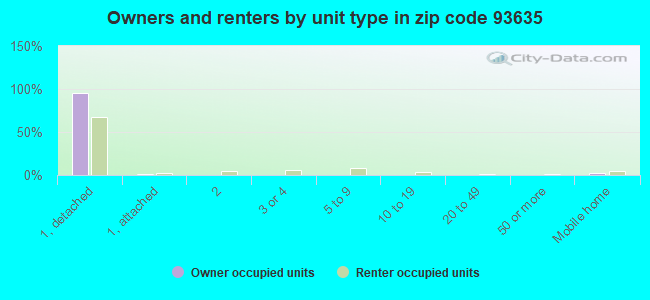
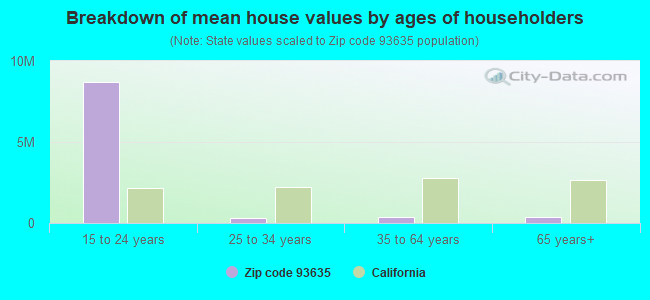


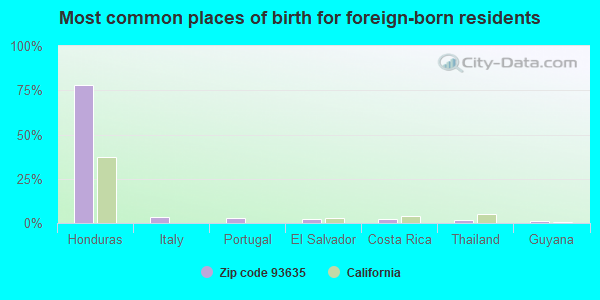
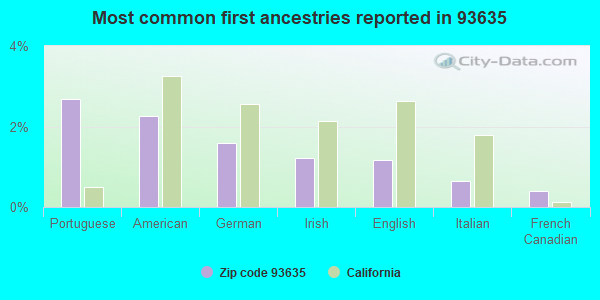
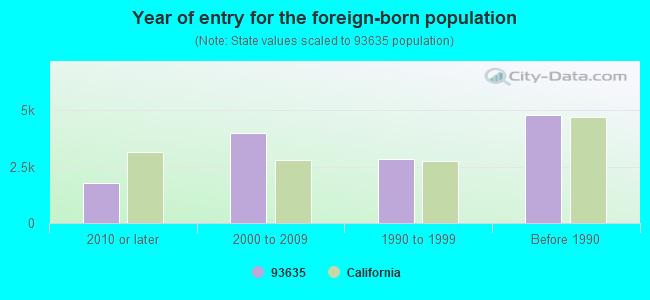


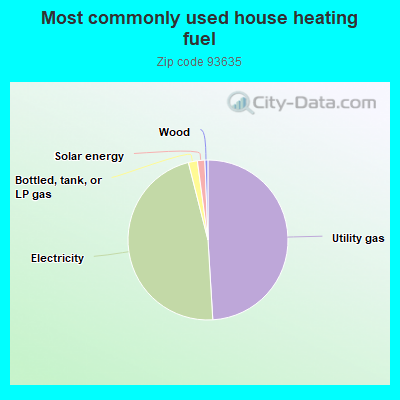
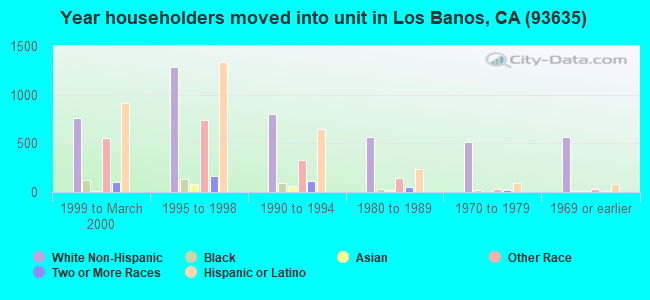
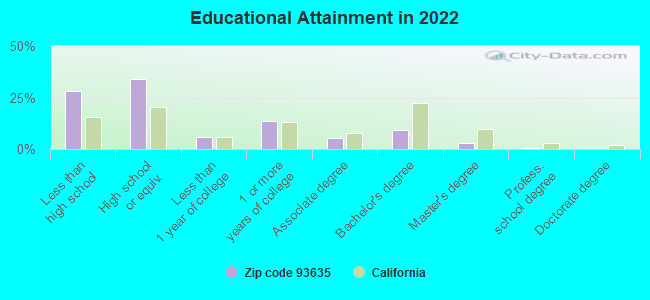
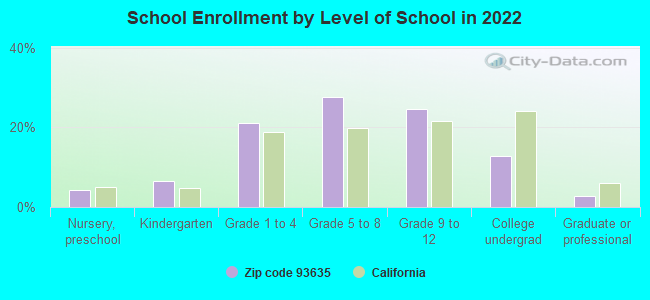
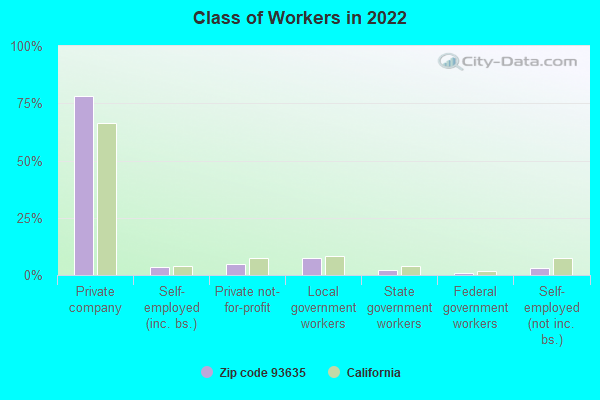
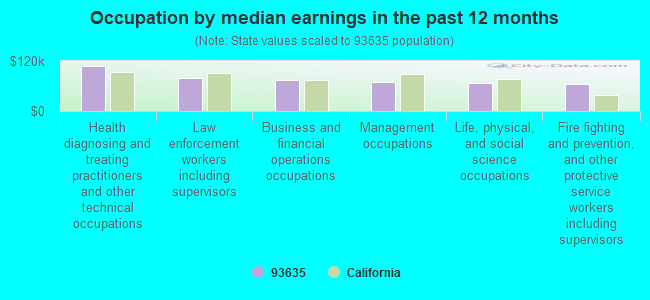
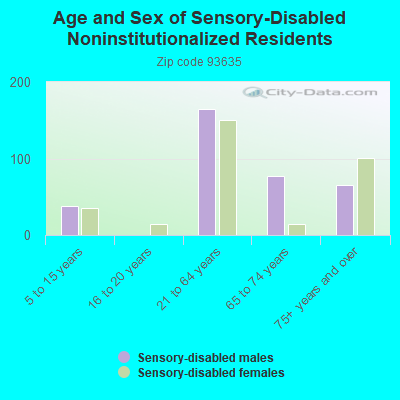
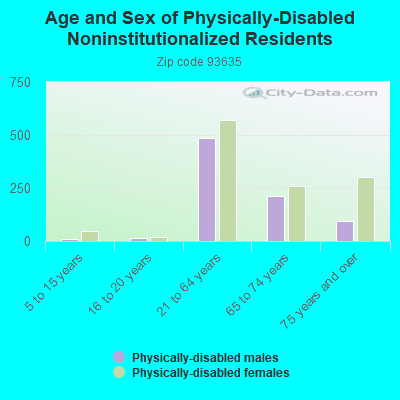
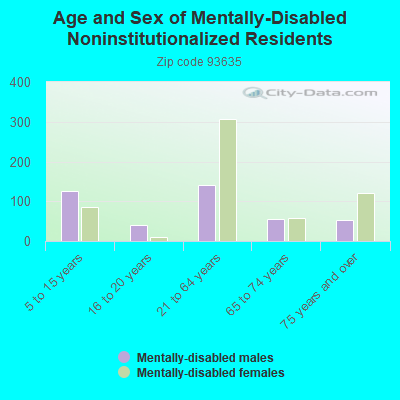
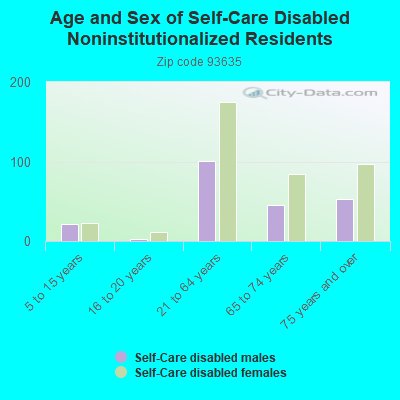
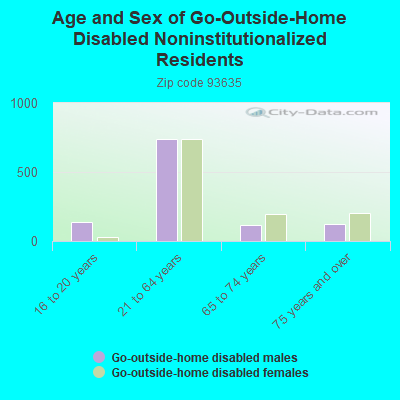
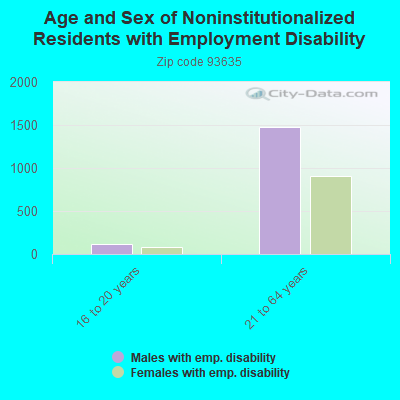
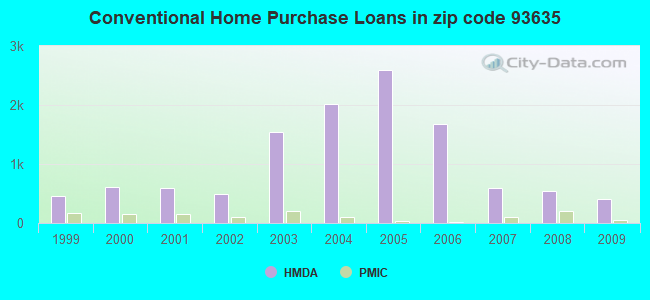
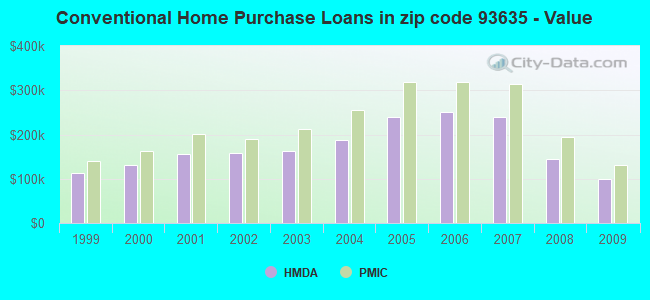
 According to the data from the years 2005 - 2018 the average number of fires per year is 128. The highest number of fires - 233 took place in 2015, and the least - 5 in 2006. The data has a dropping trend.
 When looking into fire subcategories, the most reports belonged to: Outside Fires (62.5%), and Structure Fires (17.8%).