Estimated zip code population in 2022: 17,158 Zip code population in 2010: 15,457 Zip code population in 2000: 12,666
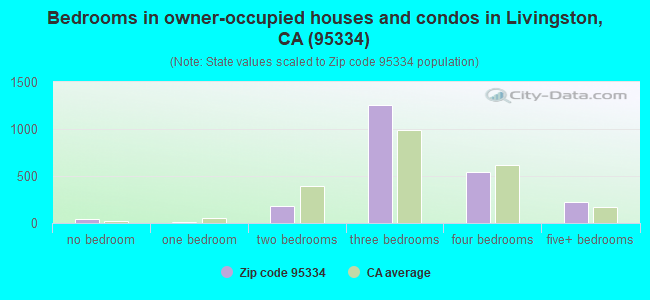
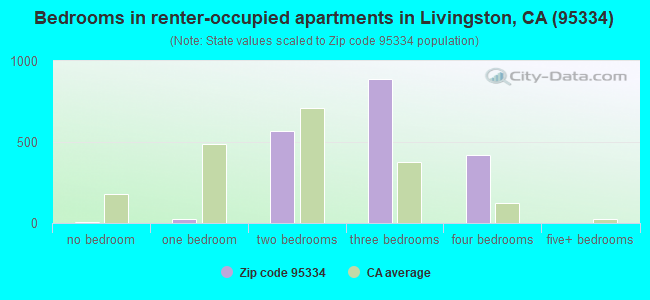
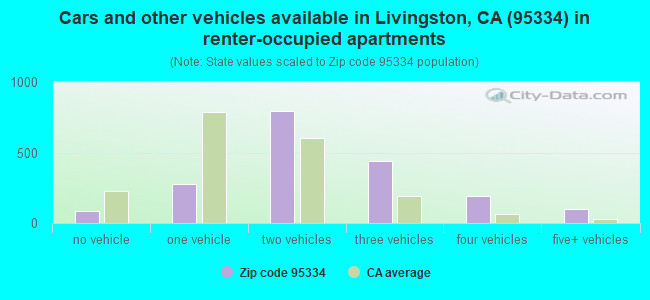
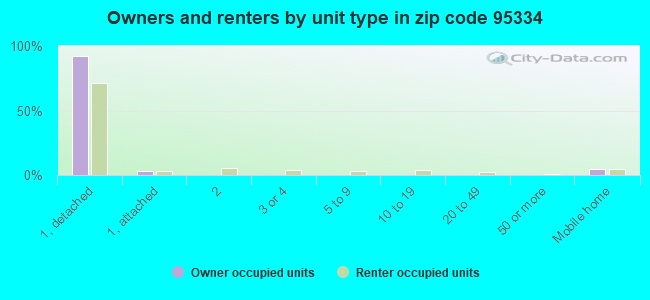
Houses and condos: 4,385 Renter-occupied apartments: 1,907
% of renters here:
46%
State:
44%
March 2022 cost of living index in zip code 95334: 93.1 (less than average, U.S. average is 100)
Land area: 56.0 sq. mi. Water area: 0.2 sq. mi.
Population density: 306 people per square mile
(very low).
OSM Map
General Map
Google Map
MSN Map
OSM Map
General Map
Google Map
MSN Map
OSM Map
General Map
Google Map
MSN Map
OSM Map
General Map
Google Map
MSN Map
Please wait while loading the map...
Real estate property taxes paid for housing units in 2022:
This zip code:
0.7% ($2,219)
California:
0.7% ($4,831)
Median real estate property taxes paid for housing units with mortgages in 2022: $2,890 (0.7%) Median real estate property taxes paid for housing units with no mortgage in 2022: $1,950 (0.7%)
Business Search- 14 Million verified businesses
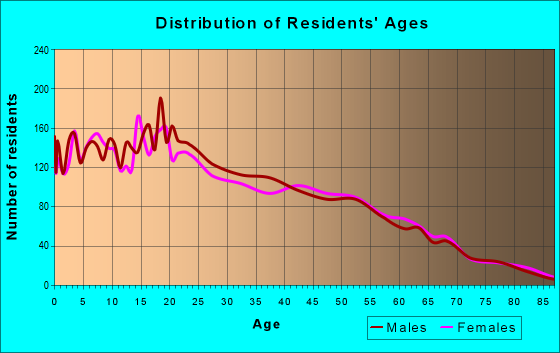
Males: 8,256
(48.1%)
Females: 8,902
(51.9%)
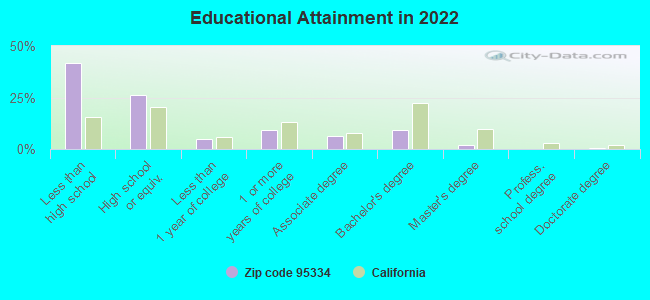
For population 25 years and over in 95334:
High school or higher: 58.2%
Bachelor's degree or higher: 11.6%
Graduate or professional degree: 2.5%
Unemployed: 7.5%
Mean travel time to work (commute): 21.8 minutes
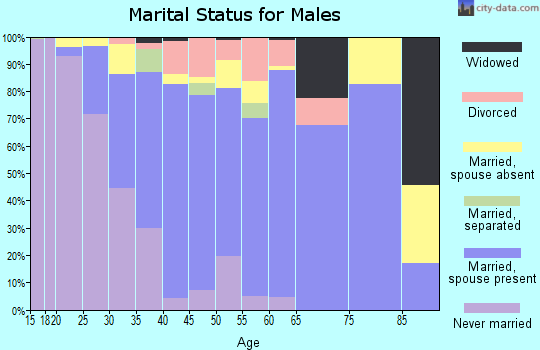
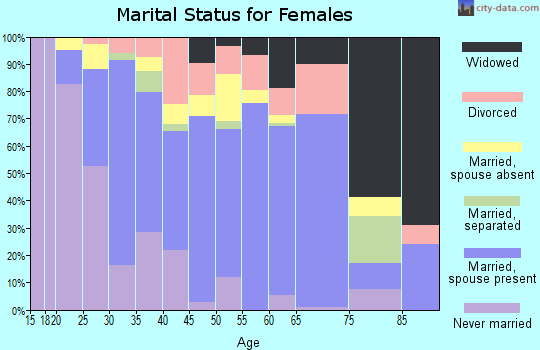
For population 15 years and over in 95334:
Never married: 39.7%
Now married: 45.4%
Separated: 2.4%
Widowed: 4.9%
Divorced: 7.6%
Zip code 95334 compared to state average:
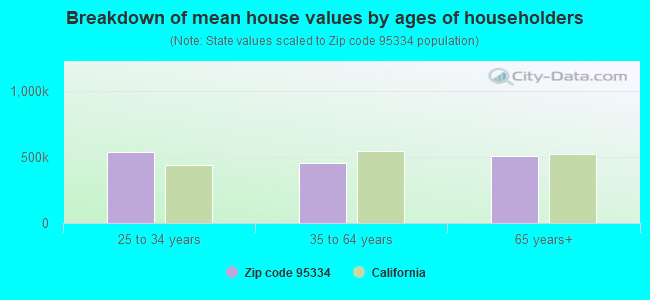
Median house value below state average.
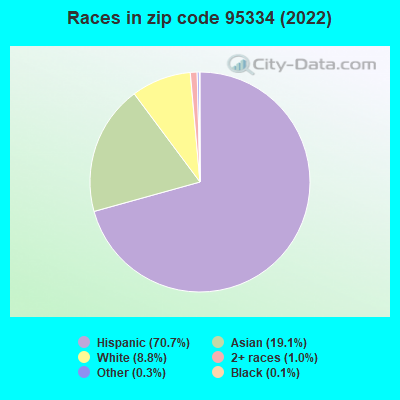
Black race population percentage significantly below state average.
Hispanic race population percentage above state average.
Median age below state average.
Length of stay since moving in significantly above state average.
Percentage of population with a bachelor's degree or higher significantly below state average.
Averages for the 2020 tax year for zip code 95334, filed in 2021:
Average Adjusted Gross Income (AGI) in 2020: $44,557 (Individual Income Tax Returns)
Here:
$44,557
State:
$95,910
Salary/wage: $40,936 (reported on 88.0% of returns)
Here:
$40,936
State:
$77,331
(% of AGI for various income ranges: 1591.8% for AGIs below $25k, 4492.6% for AGIs $25k-50k, 8680.0% for AGIs $50k-75k, 12167.7% for AGIs $75k-100k, 20863.8% for AGIs $100k-200k)
Taxable interest for individuals: $364 (reported on 22.9% of returns)
This zip code:
$364
California:
$2,294
(% of AGI for various income ranges: 4.6% for AGIs below $25k, 5.6% for AGIs $25k-50k, 13.7% for AGIs $50k-75k, 28.6% for AGIs $75k-100k, 74.6% for AGIs $100k-200k)
Ordinary dividends: $7,597 (reported on 4.5% of returns)
Here:
$7,597
State:
$10,949
(% of AGI for various income ranges: 2.8% for AGIs below $25k, 11.9% for AGIs $25k-50k, 73.2% for AGIs $50k-75k, 28.6% for AGIs $75k-100k, 450.0% for AGIs $100k-200k)
Net capital gain/loss in AGI: +$11,833 (reported on 5.2% of returns)
Here:
+$11,833
State:
+$49,306
(% of AGI for various income ranges: 2.8% for AGIs $25k-50k, 23.2% for AGIs $50k-75k, 50.9% for AGIs $75k-100k, 292.7% for AGIs $100k-200k)
Profit/loss from business: +$12,675 (reported on 12.7% of returns)
Here:
+$12,675
State:
+$15,671
(% of AGI for various income ranges: 139.9% for AGIs below $25k, 287.7% for AGIs $25k-50k, 393.3% for AGIs $50k-75k, 260.6% for AGIs $75k-100k, 461.5% for AGIs $100k-200k)
Taxable individual retirement arrangement distribution: $10,256 (reported on 2.1% of returns)
95334:
$10,256
California:
$23,505
(% of AGI for various income ranges: 15.4% for AGIs below $25k, 33.3% for AGIs $25k-50k, 51.9% for AGIs $50k-75k, 170.8% for AGIs $100k-200k)
Total itemized deductions: $29,781 (reported on 4.8% of returns)
Here:
$29,781
State:
$39,517
(% of AGI for various income ranges: 98.6% for AGIs $25k-50k, 247.1% for AGIs $50k-75k, 626.3% for AGIs $75k-100k, 1286.5% for AGIs $100k-200k)
Charity contributions: $6,842 (reported on 3.4% of returns)
Here:
$6,842
State:
$12,598
(% of AGI for various income ranges: 9.8% for AGIs $25k-50k, 44.7% for AGIs $50k-75k, 69.1% for AGIs $75k-100k, 307.7% for AGIs $100k-200k)
Taxes paid: $7,142 (reported on 4.8% of returns)
95334:
$7,142
State:
$8,807
(% of AGI for various income ranges: 22.9% for AGIs $25k-50k, 53.7% for AGIs $50k-75k, 185.7% for AGIs $75k-100k, 341.2% for AGIs $100k-200k)
Earned income credit: $2,331 (reported on 22.2% of returns)
Here:
$2,331
State:
$2,074
(% of AGI for various income ranges: 126.4% for AGIs below $25k, 106.7% for AGIs $25k-50k, 4.0% for AGIs $50k-75k)
Percentage of individuals using paid preparers for their 2020 taxes: 94.6%
Here:
95%
State:
92%
(% for various income ranges: 94.3% for AGIs below $25k, 94.2% for AGIs $25k-50k, 95.1% for AGIs $50k-75k, 96.5% for AGIs $75k-100k, 94.0% for AGIs $100k-200k, 100.0% for AGIs over 200k)
Averages for the 2012 tax year for zip code 95334, filed in 2013:
Average Adjusted Gross Income (AGI) in 2012: $33,340 (Individual Income Tax Returns)
Here:
$33,340
State:
$72,726
Salary/wage: $30,187 (reported on 90.8% of returns)
Here:
$30,187
State:
$59,079
(% of AGI for various income ranges: 82.8% for AGIs below $25k, 88.1% for AGIs $25k-50k, 85.6% for AGIs $50k-75k, 83.1% for AGIs $75k-100k, 88.9% for AGIs $100k-200k)
Taxable interest for individuals: $421 (reported on 22.3% of returns)
This zip code:
$421
California:
$2,146
(% of AGI for various income ranges: 0.3% for AGIs below $25k, 0.1% for AGIs $25k-50k, 0.2% for AGIs $50k-75k, 0.4% for AGIs $75k-100k, 0.8% for AGIs $100k-200k)
Ordinary dividends: $1,300 (reported on 3.3% of returns)
Here:
$1,300
State:
$9,308
(% of AGI for various income ranges: 0.1% for AGIs below $25k, 0.5% for AGIs $100k-200k)
Net capital gain/loss in AGI: +$6,959 (reported on 2.8% of returns)
Here:
+$6,959
State:
+$30,460
(% of AGI for various income ranges: 1.3% for AGIs $25k-50k, 5.7% for AGIs $100k-200k)
Profit/loss from business: +$13,216 (reported on 11.1% of returns)
Here:
+$13,216
State:
+$17,064
(% of AGI for various income ranges: 7.9% for AGIs below $25k, 4.7% for AGIs $25k-50k, 2.3% for AGIs $50k-75k, 3.3% for AGIs $75k-100k, 3.5% for AGIs $100k-200k)
Taxable individual retirement arrangement distribution: $13,179 (reported on 2.3% of returns)
95334:
$13,179
California:
$19,557
(% of AGI for various income ranges: 0.6% for AGIs below $25k, 0.3% for AGIs $25k-50k, 0.7% for AGIs $50k-75k, 5.0% for AGIs $75k-100k)
Total itemized deductions: $19,649 (29% of AGI, reported on 17.8% of returns)
Here:
$19,649
State:
$34,004
Here:
29.0% of AGI
State:
22.7% of AGI
(% of AGI for various income ranges: 3.8% for AGIs below $25k, 7.0% for AGIs $25k-50k, 13.5% for AGIs $50k-75k, 15.4% for AGIs $75k-100k, 17.8% for AGIs $100k-200k, 26.5% for AGIs over 200k)
Charity contributions: $2,651 (reported on 14.6% of returns)
Here:
$2,651
State:
$4,659
(% of AGI for various income ranges: 0.3% for AGIs below $25k, 0.7% for AGIs $25k-50k, 1.6% for AGIs $50k-75k, 1.8% for AGIs $75k-100k, 2.0% for AGIs $100k-200k, 3.0% for AGIs over 200k)
Taxes paid: $5,310 (reported on 17.8% of returns)
95334:
$5,310
State:
$14,448
(% of AGI for various income ranges: 0.7% for AGIs below $25k, 1.6% for AGIs $25k-50k, 3.5% for AGIs $50k-75k, 4.5% for AGIs $75k-100k, 5.6% for AGIs $100k-200k, 8.7% for AGIs over 200k)
Earned income credit: $2,532 (reported on 32.4% of returns)
Here:
$2,532
State:
$2,286
(% of AGI for various income ranges: 8.3% for AGIs below $25k, 2.1% for AGIs $25k-50k)
Percentage of individuals using paid preparers for their 2012 taxes: 77.3%
Here:
77%
State:
64%
(% for various income ranges: 76.5% for AGIs below $25k, 77.0% for AGIs $25k-50k, 79.7% for AGIs $50k-75k, 77.8% for AGIs $75k-100k, 81.2% for AGIs $100k-200k, 100.0% for AGIs over 200k)
Averages for the 2004 tax year for zip code 95334, filed in 2005:
Average Adjusted Gross Income (AGI) in 2004: $29,392 (Individual Income Tax Returns)
Here:
$29,392
State:
$58,600
Salary/wage: $26,517 (reported on 92.6% of returns)
Here:
$26,517
State:
$49,455
(% of AGI for various income ranges: 141.1% for AGIs below $10k, 87.6% for AGIs $10k-25k, 88.7% for AGIs $25k-50k, 88.7% for AGIs $50k-75k, 79.2% for AGIs $75k-100k, 44.4% for AGIs over 100k)
Taxable interest for individuals: $788 (reported on 33.4% of returns)
This zip code:
$788
California:
$2,365
(% of AGI for various income ranges: 3.5% for AGIs below $10k, 0.6% for AGIs $10k-25k, 0.6% for AGIs $25k-50k, 0.7% for AGIs $50k-75k, 0.6% for AGIs $75k-100k, 2.1% for AGIs over 100k)
Taxable dividends: $1,347 (reported on 4.6% of returns)
Here:
$1,347
State:
$4,746
(% of AGI for various income ranges: 0.7% for AGIs below $10k, 0.1% for AGIs $10k-25k, 0.1% for AGIs $25k-50k, 0.1% for AGIs $50k-75k, 0.6% for AGIs $75k-100k, 0.7% for AGIs over 100k)
Net capital gain/loss: +$18,166 (reported on 4.1% of returns)
Here:
+$18,166
State:
+$23,418
(% of AGI for various income ranges: 4.2% for AGIs below $10k, 0.0% for AGIs $10k-25k, 0.0% for AGIs $25k-50k, 0.2% for AGIs $50k-75k, 0.8% for AGIs $75k-100k, 18.9% for AGIs over 100k)
Profit/loss from business: +$11,803 (reported on 9.6% of returns)
Here:
+$11,803
State:
+$16,826
(% of AGI for various income ranges: 5.2% for AGIs below $10k, 4.4% for AGIs $10k-25k, 2.7% for AGIs $25k-50k, 2.8% for AGIs $50k-75k, 6.4% for AGIs $75k-100k, 6.1% for AGIs over 100k)
IRA payment deduction: $3,780 (reported on 0.8% of returns)
95334:
$3,780
California:
$3,192
Total itemized deductions: $17,656 (31% of AGI, reported on 21.6% of returns)
Here:
$17,656
State:
$28,113
Here:
30.5% of AGI
State:
25.3% of AGI
(% of AGI for various income ranges: 8.9% for AGIs below $10k, 6.0% for AGIs $10k-25k, 12.0% for AGIs $25k-50k, 16.6% for AGIs $50k-75k, 19.0% for AGIs $75k-100k, 19.3% for AGIs over 100k)
Charity contributions deductions: $2,630 (4% of AGI, reported on 19.0% of returns)
Here:
$2,630
State:
$3,923
Here:
4.4% of AGI
State:
3.3% of AGI
(% of AGI for various income ranges: 0.2% for AGIs below $10k, 0.6% for AGIs $10k-25k, 1.5% for AGIs $25k-50k, 2.1% for AGIs $50k-75k, 2.5% for AGIs $75k-100k, 3.5% for AGIs over 100k)
Total tax: $3,150 (reported on 56.9% of returns)
95334:
$3,150
State:
$10,761
(% of AGI for various income ranges: 3.2% for AGIs below $10k, 2.8% for AGIs $10k-25k, 3.9% for AGIs $25k-50k, 6.4% for AGIs $50k-75k, 9.5% for AGIs $75k-100k, 16.1% for AGIs over 100k)
Earned income credit: $1,924 (reported on 32.2% of returns)
Here:
$1,924
State:
$1,763
Percentage of individuals using paid preparers for their 2004 taxes: 77.0%
Here:
77%
State:
66%
(% for various income ranges: 72.5% for AGIs below $10k, 76.1% for AGIs $10k-25k, 79.5% for AGIs $25k-50k, 79.1% for AGIs $50k-75k, 77.1% for AGIs $75k-100k, 89.7% for AGIs over 100k)
Household received Food Stamps/SNAP in the past 12 months: 1,050 Household did not receive Food Stamps/SNAP in the past 12 months: 3,218
Women who had a birth in the past 12 months: 270 (133 now married, 138 unmarried) Women who did not have a birth in the past 12 months: 4,240 (1,375 now married, 2,877 unmarried)
Housing units in zip code 95334 with a mortgage: 1,190 (61 second mortgage, 3 home equity loan, 44 both second mortgage and home equity loan) Houses without a mortgage: 17
Median monthly owner costs for units with a mortgage: $1,644 Median monthly owner costs for units without a mortgage: $506
Residents with income below the poverty level in 2022:
This zip code:
16.9%
Whole state:
12.2%
Residents with income below 50% of the poverty level in 2022:
This zip code:
11.5%
Whole state:
6.2%
Median number of rooms in houses and condos:
Here:
5.7
State:
6.0
Median number of rooms in apartments:
Here:
5.5
State:
3.9
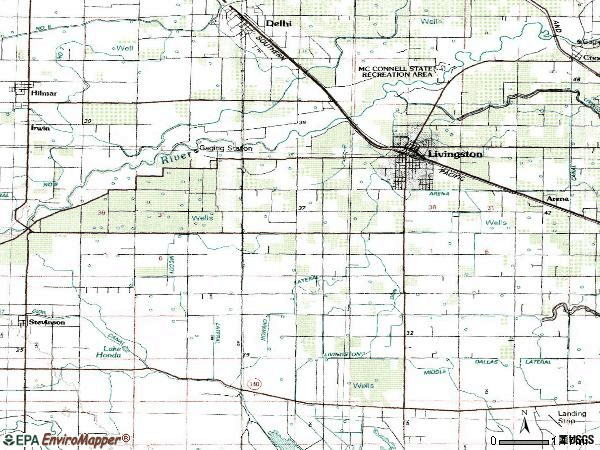
Notable locations in this zip code not listed on our city pages
Notable locations in zip code 95334: Camp McConnell (A), Gallo Bamboo Dairy (B), Gallo Bear Creek Dairy (C), Livingston Substation (D), Veterans Memorial Building (E), Livingston City Hall (F), Livingston Branch Merced County Library (G), Merced County Fire Department Station 96 Livingston (H). Display/hide their locations on the map
Churches in zip code 95334 include: Apostolic Assembly Church (A), Church of Christ (B), Our Redeemer Lutheran Church (C), Saint Judes Roman Catholic Church (D). Display/hide their locations on the map
In group quarters: 23 (-1 institutionalized population)
Size of family households: 704 2-persons, 750 3-persons, 620 4-persons, 817 5-persons, 329 6-persons, 277 7-or-more-persons
Size of nonfamily households: 469 1-person, 59 2-persons, 87 3-persons
1,963 married couples with children.
1,455 single-parent households (453 men, 1,002 women).
22.2% of residents of 95334 zip code speak English at home.
60.3% of residents speak Spanish at home (63% very well, 9% well, 13% not well, 15% not at all).
17.4% of residents speak other Indo-European language at home (50% very well, 16% well, 17% not well, 17% not at all).
1.1% of residents speak Asian or Pacific Island language at home (85% very well, 9% well, 6% not well).
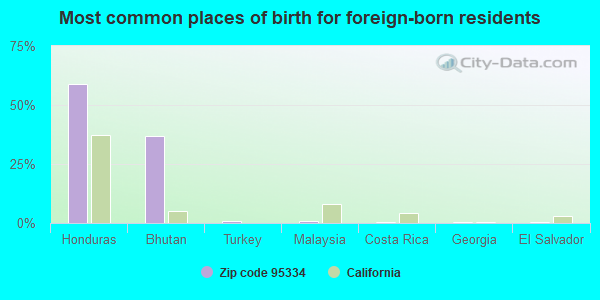
Foreign born population: 6,321 (36.8%) (49.2% of them are naturalized citizens)
This zip code:
36.8%
Whole state:
26.7%
59%Honduras
37%Bhutan
1%Turkey
1%Malaysia
0%Costa Rica
0%Georgia
0%El Salvador
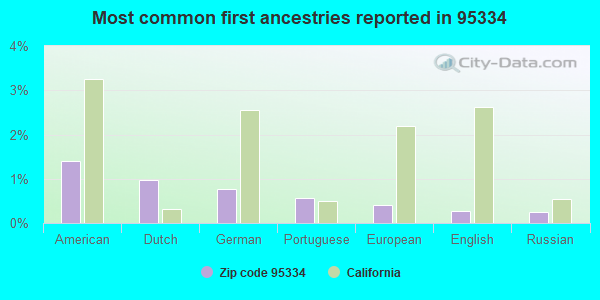
1%American
1%Dutch
1%German
1%Portuguese
0%European
0%English
0%Russian
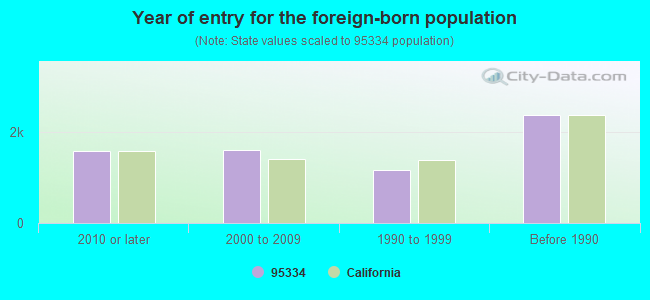
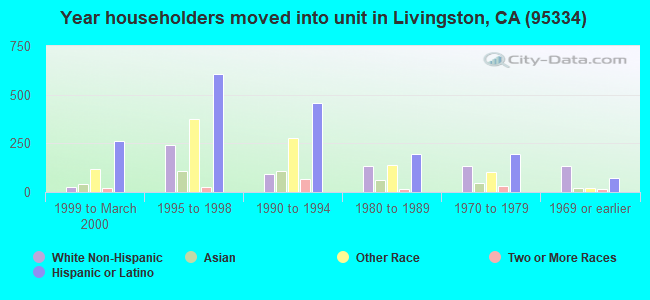
Year of entry for the foreign-born population
1,5792010 or later
1,6122000 to 2009
1,1561990 to 1999
2,372Before 1990
Major facilities with environmental interests located in this zip code:
FOSTER FARMS LIVINGSTON COMPLEX (843 DAVIS STREET in LIVINGSTON, CA)
AIR SYNTHETIC MINOR (AIRS/AFS) (Integrated Compliance Information System) - ICIS-09-1998-0117, FORMAL ENFORCEMENT ACTION CRITERIA AND HAZARDOUS AIR POLLUTANT INVENTORY (Inventory of air pollution sources) AIR MAJOR ("Best Available" air pollution technologies tracking) TRI REPORTER (Tracking of toxic chemicals releasing facilities) Business SIC classification: TREE NUTS; POULTRY HATCHERIES; POULTRY SLAUGHTERING AND PROCESSING; ANIMAL AND MARINE FATS AND OILS; LOCAL TRUCKING WITHOUT STORAGE; REFRIGERATED WAREHOUSING AND STORAGE; REPAIR SHOPS AND RELATED SERVICES Alternative names: FOSTER FARMS-RENDERING PLANT, FOSTER FOOD PRODUCTS, FOSTER FOOD PRODUCTS
FOSTER POULTRY FARMS (1000 DAVIS STREET in LIVINGSTON, CA)
STATE MASTER (California - Hazardous Waste Tracking) - HAZARDOU WASTE PROGRAM COMPLIANCE ACTIVITY (Tracking inspections of insecticide, fungicide, and rodenticide, and toxic substances) Small Quantity Generators, between 100 kg and 1000 kg of hazardous waste/month (Resource Conservation and Recovery Act (tracking hazardous waste)) Alternative names: FOSTER FARMS, FOSTER FARMS-LIVINGSTON COMPLEX
FOSTER FARMS FERTILIZER PLANT (12997 WEST STATE HWY 140 AT LINCOLN AVENUE in LIVINGSTON, CA)
(Integrated Compliance Information System) - ICIS-09-1998-0117, FORMAL ENFORCEMENT ACTION CRITERIA AND HAZARDOUS AIR POLLUTANT INVENTORY (Inventory of air pollution sources) TRI REPORTER (Tracking of toxic chemicals releasing facilities) Business SIC classification: BROILER, FRYER, AND ROASTER CHICKENS; POULTRY SLAUGHTERING AND PROCESSING; PREPARED FEEDS AND FEED INGREDIENTS FOR ANIMALS AND FOWLS, EXCEPT DOGS AND CATS; NITROGENOUS FERTILIZERS; FERTILIZERS, MIXING ONLY Alternative names: FOSTER POULTRY FARMS-KOPRO, KOPRO PROCESSING FACILITY
CHEVRON STATION NO 208575 (380 JOSEPH GALLO DR in LIVINGSTON, CA)
STATE MASTER (California - Hazardous Waste Tracking) - HAZARDOU WASTE PROGRAM Small Quantity Generators, between 100 kg and 1000 kg of hazardous waste/month (Resource Conservation and Recovery Act (tracking hazardous waste)) - notification Organizations: CHEVRON PRODUCTS CO (CONTACT/OWNER)
LIVINGSTON HIGH (1616 THIRD ST. in LIVINGSTON, CA)
(National Center for Education Statistics) - STATE ID-2433605 Organizations: MERCED UNION HIGH (SCHOOL DISTRICT)
LIVINGSTON MIDDLE (101 F STREET in LIVINGSTON, CA)
(National Center for Education Statistics) - STATE ID-6025514 Organizations: LIVINGSTON UNION ELEMENTARY (SCHOOL DISTRICT)
CAMPUS PARK ELEMENTARY (1845 H ST. in LIVINGSTON, CA)
(National Center for Education Statistics) - STATE ID-6025506 Organizations: LIVINGSTON UNION ELEMENTARY (SCHOOL DISTRICT)
ACOSTA GARAGE (1542 STATE HWY 99 in LIVINGSTON, CA)
Small Quantity Generators, between 100 kg and 1000 kg of hazardous waste/month (Resource Conservation and Recovery Act (tracking hazardous waste)) Organizations: SILVESTRE M ACOSTA (CONTACT/OWNER)
GALLO CATTLE BAMBOO DAIRY (2363 NORTH HOWARD ROAD in LIVINGSTON, CA)
National Pollutant Discharge Elimination System NON-MAJOR (Tracking pollutant discharge elimination systems) - permit Business SIC classification: DAIRY FARMS Alternative names: GALLO CATTLE CO
GALLO CATTLE WILLOW DAIRY (2977 NORTH WEIR RD in LIVINGSTON, CA)
National Pollutant Discharge Elimination System NON-MAJOR (Tracking pollutant discharge elimination systems) - permit Business SIC classification: DAIRY FARMS Alternative names: GALLO CATTLE CO, GALLO WILLOW DAIRY
JOSEPH GALLO VINEYARDS (4193 STATE HWY 140 AT HOWARD RD in LIVINGSTON, CA)
Small Quantity Generators, between 100 kg and 1000 kg of hazardous waste/month (Resource Conservation and Recovery Act (tracking hazardous waste))
FMC CORP AGRI CHEM GROUP (1205 COURT ST in LIVINGSTON, CA)
Small Quantity Generators, between 100 kg and 1000 kg of hazardous waste/month (Resource Conservation and Recovery Act (tracking hazardous waste))
JOE ALVERNAZ (5381 ARENA WAY in LIVINGSTON, CA)
Small Quantity Generators, between 100 kg and 1000 kg of hazardous waste/month (Resource Conservation and Recovery Act (tracking hazardous waste)) Business NAICS classification: ALL OTHER MISCELLANEOUS CROP FARMING.
Housing units lacking complete plumbing facilities: 0.6% Housing units lacking complete kitchen facilities: 0.8%
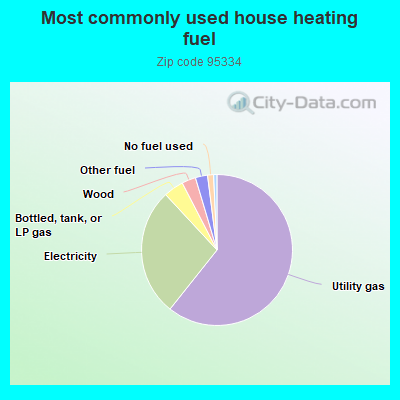
60.7%Utility gas
27.4%Electricity
4.3%Bottled, tank, or LP gas
3.0%Wood
2.6%Other fuel
1.3%No fuel used
0.7%Solar energy
Population in 1990: 10,994. Population change in the 1990s: +1,672 (+15.2%).
Place of birth for U.S.-born residents:
This state: 10,101
Northeast: 8
Midwest: 127
South: 123
West: 170
64% of the 95334 zip code residents lived in the same house 5 years ago. Out of people who lived in different houses, 76% lived in this county. Out of people who lived in different counties, 50% lived in California.
94% of the 95334 zip code residents lived in the same house 1 year ago. Out of people who lived in different houses, 60% moved from this county. Out of people who lived in different houses, 27% moved from different county within same state. Out of people who lived in different houses, 8% moved from different state. Out of people who lived in different houses, 9% moved from abroad.
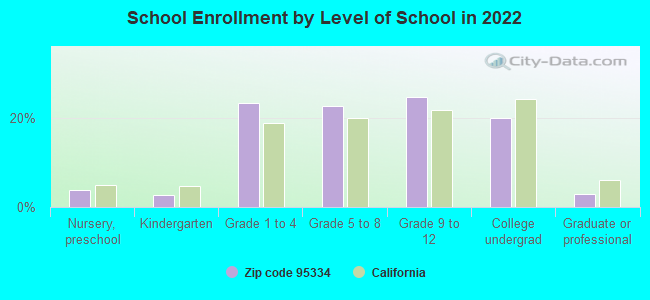
Private vs. public school enrollment:
Students in private schools in grades 1 to 8 (elementary and middle school): 136
Here:
6.3%
California:
10.5%
Students in private schools in grades 9 to 12 (high school): 77
Here:
6.6%
California:
8.5%
Students in private undergraduate colleges: 84
Here:
8.9%
California:
15.9%
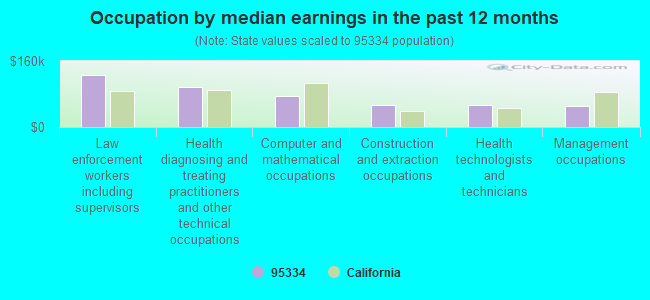
Occupation by median earnings in the past 12 months ($)
126,152Law enforcement workers including supervisors
96,762Health diagnosing and treating practitioners and other technical occupations
74,080Computer and mathematical occupations
53,388Construction and extraction occupations
53,105Health technologists and technicians
50,149Management occupations
Companies with federal contracts located in this zip code:
FOSTER POULTRY FARMS (1000 DAVIS ST in LIVINGSTON, CA) : $36,705,963 in 70 contractsfrom 2002 to 2006
Contracts for Food Items For Resale, Meat, Poultry, and Fish by Defense Commissary Agency, Agricultural Marketing Service, Department of Defense Signed by year:2000: $0; 2001: $0; 2002: $106,511; 2003: $71,540; 2004: $8,027,135; 2005: $19,640,180; 2006: $8,860,597.
Biggest contracts:
$7,345,611 with Defense Commissary Agency for Food Items For Resale. Signed on 2005-04-01. Completion date: 2005-08-31.
$6,546,658, same as above.Signed on 2004-10-01. Completion date: 2005-02-28.
$4,779,588, same as above.Signed on 2005-10-01. Completion date: 2005-12-31.
$3,579,819, same as above.Signed on 2006-01-01. Completion date: 2006-03-31.
Top industries in this zip code by the number of employees in 2005:
2006 - 2018 National Fire Incident Reporting System (NFIRS) incidents
Based on the data from the years 2006 - 2018 the average number of fire incidents per year is 53. The highest number of fires - 84 took place in 2007, and the least - 18 in 2006. The data has a rising trend.
When looking into fire subcategories, the most incidents belonged to: Outside Fires (53.1%), and Mobile Property/Vehicle Fires (22.3%).
Fire incident types reported to NFIRS in Zip Code 95334
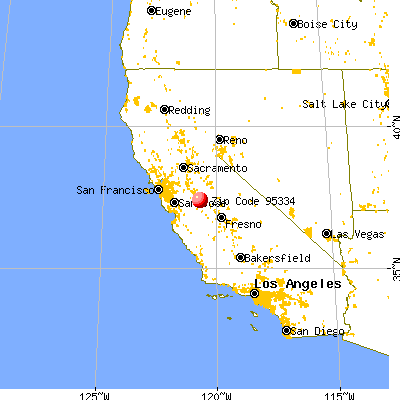


 Nearest zip codes: 95315, 95301, 95312, 95374, 95303, 95324.


 Based on the data from the years 2006 - 2018 the average number of fire incidents per year is 53. The highest number of fires - 84 took place in 2007, and the least - 18 in 2006. The data has a rising trend.
 When looking into fire subcategories, the most incidents belonged to: Outside Fires (53.1%), and Mobile Property/Vehicle Fires (22.3%).