Estimated zip code population in 2022: 1,567 Zip code population in 2010: 2,030 Zip code population in 2000: 1,943
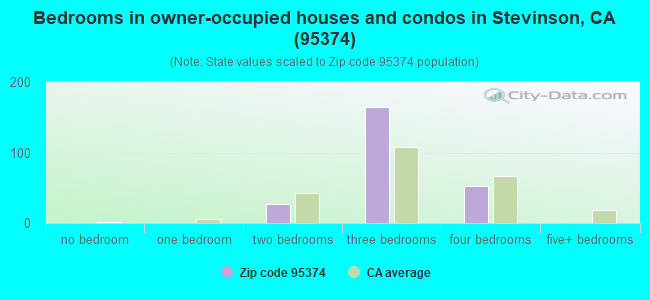
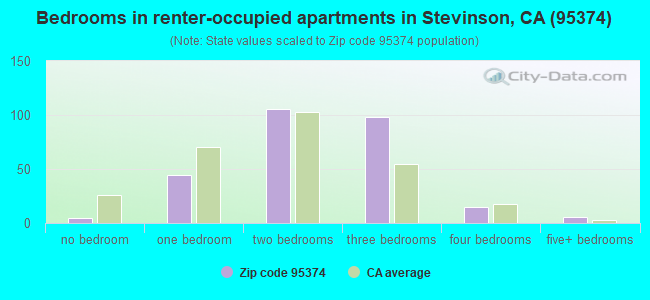
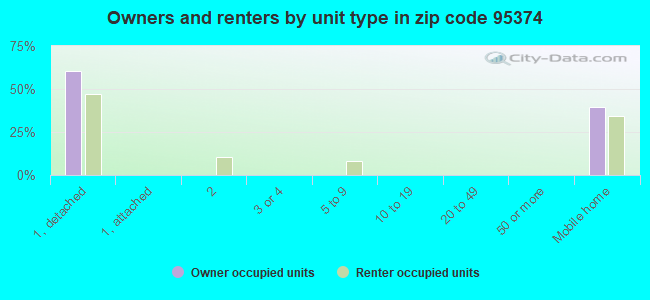
Houses and condos: 681 Renter-occupied apartments: 276
% of renters here:
53%
State:
44%
March 2022 cost of living index in zip code 95374: 98.6 (near average, U.S. average is 100)
Land area: 46.6 sq. mi. Water area: 0.5 sq. mi.
Population density: 34 people per square mile
(very low).
OSM Map
General Map
Google Map
MSN Map
OSM Map
General Map
Google Map
MSN Map
OSM Map
General Map
Google Map
MSN Map
OSM Map
General Map
Google Map
MSN Map
Please wait while loading the map...
Real estate property taxes paid for housing units in 2022:
This zip code:
0.5% ($2,154)
California:
0.7% ($4,831)
Median real estate property taxes paid for housing units with mortgages in 2022: $2,382 (0.5%) Median real estate property taxes paid for housing units with no mortgage in 2022: $1,987 (0.4%)
Business Search- 14 Million verified businesses
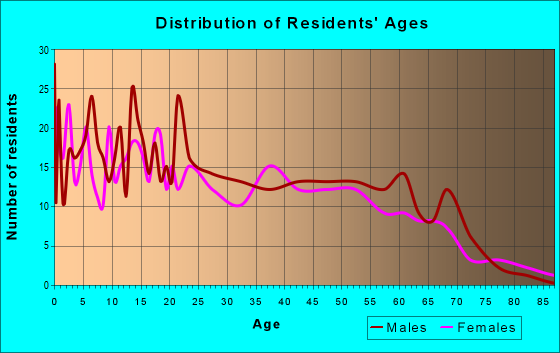
Males: 850
(54.2%)
Females: 717
(45.8%)
For population 25 years and over in 95374:
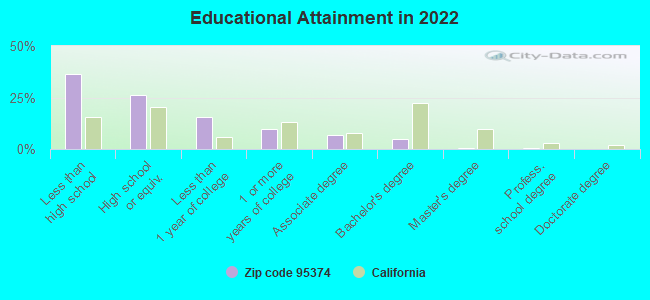
High school or higher: 62.4%
Bachelor's degree or higher: 5.8%
Graduate or professional degree: 0.9%
Unemployed: 8.3%
Mean travel time to work (commute): 31.7 minutes
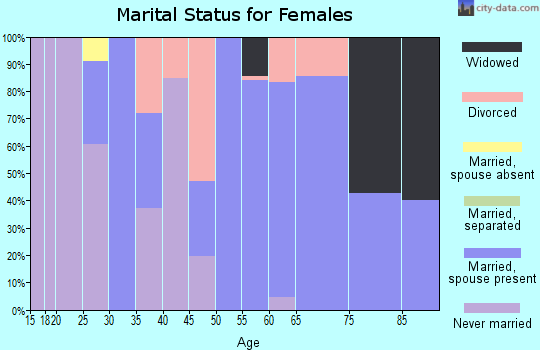
For population 15 years and over in 95374:
Never married: 26.7%
Now married: 62.2%
Separated: 2.6%
Widowed: 7.1%
Divorced: 1.4%
Zip code 95374 compared to state average:
Median household income below state average.
Median house value below state average.
Black race population percentage significantly below state average.
Percentage of population with a bachelor's degree or higher significantly below state average.
Averages for the 2020 tax year for zip code 95374, filed in 2021:
Average Adjusted Gross Income (AGI) in 2020: $46,190 (Individual Income Tax Returns)
Here:
$46,190
State:
$95,910
Salary/wage: $41,322 (reported on 83.1% of returns)
Here:
$41,322
State:
$77,331
(% of AGI for various income ranges: 1585.3% for AGIs below $25k, 4652.7% for AGIs $25k-50k, 8468.8% for AGIs $50k-75k, 13796.7% for AGIs $75k-100k, 14645.0% for AGIs $100k-200k)
Taxable interest for individuals: $471 (reported on 22.1% of returns)
This zip code:
$471
California:
$2,294
(% of AGI for various income ranges: 1.8% for AGIs below $25k, 4.0% for AGIs $25k-50k, 2.5% for AGIs $50k-75k, 50.0% for AGIs $75k-100k, 135.0% for AGIs $100k-200k)
Ordinary dividends: $4,075 (reported on 5.2% of returns)
Here:
$4,075
State:
$10,949
(% of AGI for various income ranges: 17.1% for AGIs below $25k, 446.7% for AGIs $75k-100k)
Net capital gain/loss in AGI: +$9,183 (reported on 7.8% of returns)
Here:
+$9,183
State:
+$49,306
(% of AGI for various income ranges: 34.1% for AGIs below $25k, 1643.3% for AGIs $75k-100k)
Profit/loss from business: +$2,240 (reported on 13.0% of returns)
Here:
+$2,240
State:
+$15,671
(% of AGI for various income ranges: 82.4% for AGIs below $25k, 76.7% for AGIs $25k-50k)
Taxable individual retirement arrangement distribution: $8,900 (reported on 2.6% of returns)
95374:
$8,900
California:
$23,505
(% of AGI for various income ranges: 104.7% for AGIs below $25k)
Total itemized deductions: $29,250 (reported on 5.2% of returns)
Here:
$29,250
State:
$39,517
(% of AGI for various income ranges: 2925.0% for AGIs $100k-200k)
Charity contributions: $4,150 (reported on 2.6% of returns)
Here:
$4,150
State:
$12,598
(% of AGI for various income ranges: 103.8% for AGIs $50k-75k)
Taxes paid: $7,225 (reported on 5.2% of returns)
95374:
$7,225
State:
$8,807
(% of AGI for various income ranges: 722.5% for AGIs $100k-200k)
Earned income credit: $2,700 (reported on 15.6% of returns)
Here:
$2,700
State:
$2,074
(% of AGI for various income ranges: 120.0% for AGIs below $25k, 80.0% for AGIs $25k-50k)
Percentage of individuals using paid preparers for their 2020 taxes: 92.2%
Here:
92%
State:
92%
(% for various income ranges: 89.7% for AGIs below $25k, 90.9% for AGIs $25k-50k, 92.3% for AGIs $50k-75k, 100.0% for AGIs $75k-100k, 100.0% for AGIs $100k-200k)
Averages for the 2012 tax year for zip code 95374, filed in 2013:
Average Adjusted Gross Income (AGI) in 2012: $37,352 (Individual Income Tax Returns)
Here:
$37,352
State:
$72,726
Salary/wage: $32,738 (reported on 83.3% of returns)
Here:
$32,738
State:
$59,079
(% of AGI for various income ranges: 71.5% for AGIs below $25k, 85.6% for AGIs $25k-50k, 75.3% for AGIs $50k-75k, 72.9% for AGIs $75k-100k, 51.0% for AGIs $100k-200k)
Taxable interest for individuals: $556 (reported on 24.2% of returns)
This zip code:
$556
California:
$2,146
(% of AGI for various income ranges: 0.2% for AGIs below $25k, 0.4% for AGIs $25k-50k, 0.3% for AGIs $50k-75k, 0.5% for AGIs $75k-100k, 0.4% for AGIs $100k-200k)
Ordinary dividends: $2,933 (reported on 4.5% of returns)
Here:
$2,933
State:
$9,308
Net capital gain/loss in AGI: +$17,775 (reported on 6.1% of returns)
Here:
+$17,775
State:
+$30,460
Profit/loss from business: +$10,490 (reported on 15.2% of returns)
Here:
+$10,490
State:
+$17,064
Taxable individual retirement arrangement distribution: $4,600 (reported on 3.0% of returns)
95374:
$4,600
California:
$19,557
Total itemized deductions: $20,131 (30% of AGI, reported on 19.7% of returns)
Here:
$20,131
State:
$34,004
Here:
29.6% of AGI
State:
22.7% of AGI
(% of AGI for various income ranges: 9.8% for AGIs $25k-50k, 13.4% for AGIs $50k-75k, 15.6% for AGIs $75k-100k, 14.5% for AGIs $100k-200k)
Charity contributions: $2,911 (reported on 13.6% of returns)
Here:
$2,911
State:
$4,659
(% of AGI for various income ranges: 0.8% for AGIs $25k-50k, 1.1% for AGIs $50k-75k, 1.8% for AGIs $75k-100k, 1.9% for AGIs $100k-200k)
Taxes paid: $5,085 (reported on 19.7% of returns)
95374:
$5,085
State:
$14,448
(% of AGI for various income ranges: 1.9% for AGIs $25k-50k, 2.5% for AGIs $50k-75k, 4.1% for AGIs $75k-100k, 5.3% for AGIs $100k-200k)
Earned income credit: $2,458 (reported on 28.8% of returns)
Here:
$2,458
State:
$2,286
(% of AGI for various income ranges: 8.5% for AGIs below $25k, 1.7% for AGIs $25k-50k)
Percentage of individuals using paid preparers for their 2012 taxes: 72.7%
Here:
73%
State:
64%
(% for various income ranges: 69.0% for AGIs below $25k, 73.9% for AGIs $25k-50k, 71.4% for AGIs $50k-75k, 75.0% for AGIs $75k-100k, 100.0% for AGIs $100k-200k)
Averages for the 2004 tax year for zip code 95374, filed in 2005:
Average Adjusted Gross Income (AGI) in 2004: $33,582 (Individual Income Tax Returns)
Here:
$33,582
State:
$58,600
Salary/wage: $30,678 (reported on 86.5% of returns)
Here:
$30,678
State:
$49,455
(% of AGI for various income ranges: 101.2% for AGIs below $10k, 81.9% for AGIs $10k-25k, 90.1% for AGIs $25k-50k, 84.5% for AGIs $50k-75k, 64.9% for AGIs $75k-100k, 53.4% for AGIs over 100k)
Taxable interest for individuals: $831 (reported on 34.5% of returns)
This zip code:
$831
California:
$2,365
(% of AGI for various income ranges: 1.2% for AGIs below $10k, 2.7% for AGIs $10k-25k, 0.3% for AGIs $25k-50k, 0.5% for AGIs $50k-75k, 1.1% for AGIs $75k-100k, 0.5% for AGIs over 100k)
Taxable dividends: $262 (reported on 6.4% of returns)
Here:
$262
State:
$4,746
(% of AGI for various income ranges: 0.1% for AGIs $10k-25k, 0.1% for AGIs $50k-75k, 0.1% for AGIs $75k-100k)
Net capital gain/loss: +$23,000 (reported on 7.2% of returns)
Here:
+$23,000
State:
+$23,418
(% of AGI for various income ranges: 6.1% for AGIs $10k-25k, 5.2% for AGIs $50k-75k, 23.1% for AGIs $75k-100k)
Profit/loss from business: +$6,541 (reported on 11.3% of returns)
Here:
+$6,541
State:
+$16,826
(% of AGI for various income ranges: 14.2% for AGIs below $10k, 3.3% for AGIs $10k-25k, 1.2% for AGIs $25k-50k, 4.3% for AGIs $50k-75k)
IRA payment deduction: $2,786 (reported on 2.1% of returns)
95374:
$2,786
California:
$3,192
Total itemized deductions: $19,075 (33% of AGI, reported on 24.5% of returns)
Here:
$19,075
State:
$28,113
Here:
32.8% of AGI
State:
25.3% of AGI
(% of AGI for various income ranges: 10.4% for AGIs $10k-25k, 12.7% for AGIs $25k-50k, 15.6% for AGIs $50k-75k, 15.0% for AGIs $75k-100k, 18.9% for AGIs over 100k)
Charity contributions deductions: $1,872 (3% of AGI, reported on 20.4% of returns)
Here:
$1,872
State:
$3,923
Here:
3.0% of AGI
State:
3.3% of AGI
(% of AGI for various income ranges: 0.8% for AGIs $10k-25k, 0.8% for AGIs $25k-50k, 1.3% for AGIs $50k-75k, 1.5% for AGIs $75k-100k, 1.7% for AGIs over 100k)
Total tax: $3,507 (reported on 66.8% of returns)
95374:
$3,507
State:
$10,761
(% of AGI for various income ranges: 2.7% for AGIs below $10k, 3.3% for AGIs $10k-25k, 5.3% for AGIs $25k-50k, 6.9% for AGIs $50k-75k, 9.7% for AGIs $75k-100k, 12.7% for AGIs over 100k)
Earned income credit: $1,923 (reported on 19.9% of returns)
Here:
$1,923
State:
$1,763
Percentage of individuals using paid preparers for their 2004 taxes: 66.6%
Here:
67%
State:
66%
(% for various income ranges: 58.5% for AGIs below $10k, 64.3% for AGIs $10k-25k, 68.3% for AGIs $25k-50k, 69.2% for AGIs $50k-75k, 87.1% for AGIs $75k-100k, 78.3% for AGIs over 100k)
Household received Food Stamps/SNAP in the past 12 months: 90 Household did not receive Food Stamps/SNAP in the past 12 months: 436
Women who had a birth in the past 12 months: 22 (22 now married, 0 unmarried) Women who did not have a birth in the past 12 months: 328 (192 now married, 133 unmarried)
Housing units in zip code 95374 with a mortgage: 102 (3 second mortgage, 3 both second mortgage and home equity loan) Median monthly owner costs for units with a mortgage: $1,649 Median monthly owner costs for units without a mortgage: $643
Residents with income below the poverty level in 2022:
This zip code:
15.4%
Whole state:
12.2%
Residents with income below 50% of the poverty level in 2022:
This zip code:
5.7%
Whole state:
6.2%
Median number of rooms in houses and condos:
Here:
6.0
State:
6.0
Median number of rooms in apartments:
Here:
4.8
State:
3.9
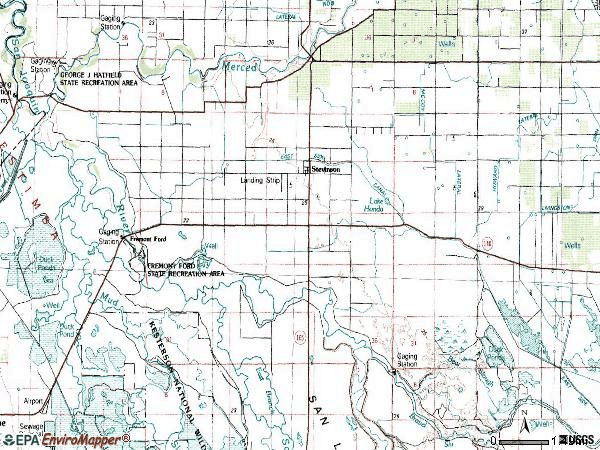
Notable locations in this zip code not listed on our city pages
Notable locations in zip code 95374: Anchor J Dairy (A), Dores Dairy (B), A and D Dairy (C), Modesto Gun Club (D), Stevinson Branch Merced County Library (E), Merced County Fire Department Station 97 Stevinson (F). Display/hide their locations on the map
Size of family households: 144 2-persons, 52 3-persons, 58 4-persons, 84 5-persons, 21 6-persons, 6 7-or-more-persons
Size of nonfamily households: 118 1-person, 35 2-persons
352 married couples with children.
0 single-parent households ().
41.1% of residents of 95374 zip code speak English at home.
49.0% of residents speak Spanish at home (50% very well, 21% well, 7% not well, 22% not at all).
10.5% of residents speak other Indo-European language at home (42% very well, 39% well, 19% not well).
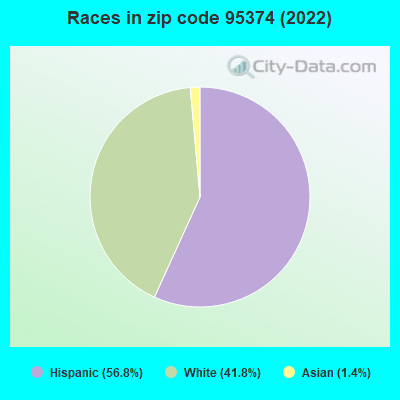
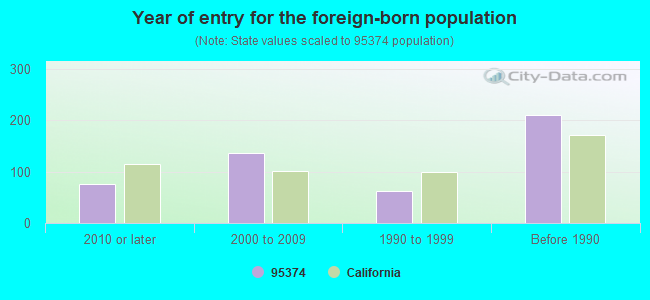
Foreign born population: 490 (31.3%) (35.1% of them are naturalized citizens)
This zip code:
31.3%
Whole state:
26.7%
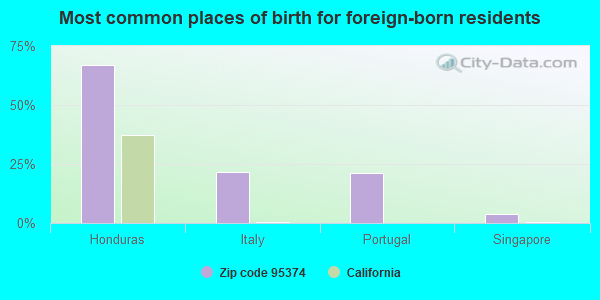
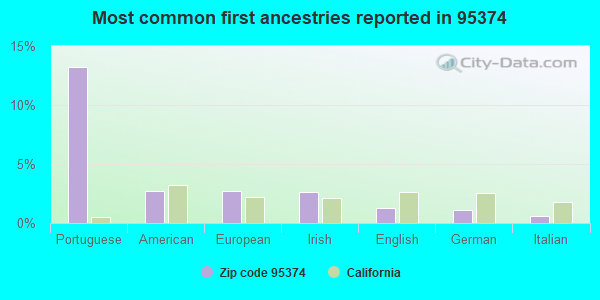
67%Honduras
22%Italy
21%Portugal
4%Singapore
13%Portuguese
3%American
3%European
3%Irish
1%English
1%German
1%Italian
Year of entry for the foreign-born population
752010 or later
1372000 to 2009
621990 to 1999
210Before 1990
Facilities with environmental interests located in this zip code:
MERQUIN ELEMENTARY (20316 W. THIRD AVE. in STEVINSON, CA)
(National Center for Education Statistics) - STATE ID-6025472 Organizations: HILMAR UNIFIED (SCHOOL DISTRICT)
Housing units lacking complete plumbing facilities: 3.9% Housing units lacking complete kitchen facilities: 3.6%
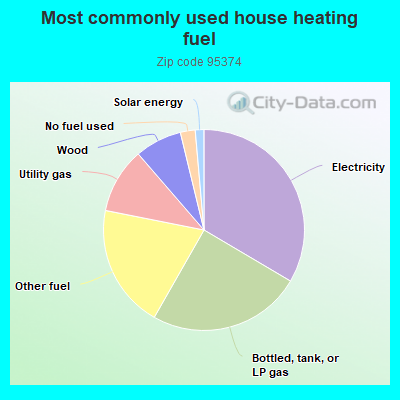
33.7%Electricity
24.9%Bottled, tank, or LP gas
20.0%Other fuel
10.6%Utility gas
7.6%Wood
2.4%No fuel used
1.4%Solar energy
Population in 1990: 1,564. Population change in the 1990s: +379 (+24.2%).
Place of birth for U.S.-born residents:
This state: 1,009
Northeast: 3
Midwest: 32
South: 14
West: 19
57% of the 95374 zip code residents lived in the same house 5 years ago. Out of people who lived in different houses, 46% lived in this county. Out of people who lived in different counties, 50% lived in California.
92% of the 95374 zip code residents lived in the same house 1 year ago. Out of people who lived in different houses, 77% moved from this county. Out of people who lived in different houses, 4% moved from different county within same state. Out of people who lived in different houses, 9% moved from different state. Out of people who lived in different houses, 8% moved from abroad.
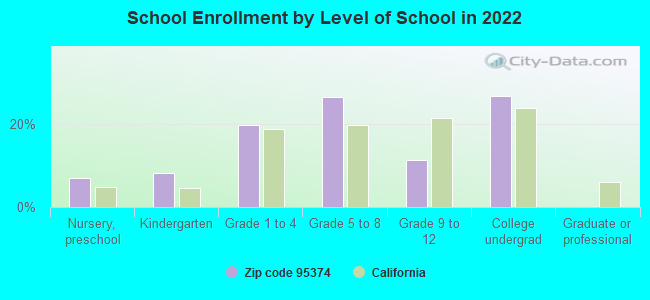
Private vs. public school enrollment:
Students in private schools in grades 1 to 8 (elementary and middle school):
Here:
0.0%
California:
10.5%
Students in private schools in grades 9 to 12 (high school):
Here:
0.0%
California:
8.5%
Students in private undergraduate colleges:
Here:
0.0%
California:
15.9%
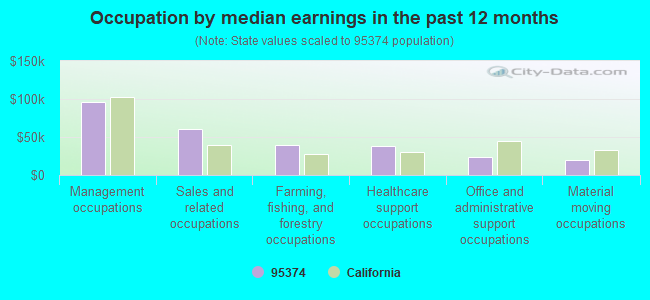
Occupation by median earnings in the past 12 months ($)
96,314Management occupations
60,782Sales and related occupations
38,949Farming, fishing, and forestry occupations
38,298Healthcare support occupations
23,244Office and administrative support occupations
20,084Material moving occupations
Top industries in this zip code by the number of employees in 2005:
Arts, Entertainment, and Recreation: Golf Courses and Country Clubs (50-99 employees: 1 establishment)
Construction: Site Preparation Contractors (10-19: 1)
Construction: Plumbing, Heating, and Air-Conditioning Contractors (5-9: 1)
Health Care and Social Assistance: Residential Mental Retardation Facilities (5-9: 1)
Accommodation and Food Services: Full-Service Restaurants (1-4: 3)
Administrative and Support and Waste Management and Remediation Services: Landscaping Services (1-4: 1)
People in group quarters in 2000:
13 people in homes for the mentally retarded
10 people in other noninstitutional group quarters
Fatal accident statistics in 2012:
Fatal accident count: 1
Vehicles involved in fatal accidents: 1
Fatal accidents caused by drunken drivers: 0
Fatalities: 2
Persons involved in fatal accidents: 3
Pedestrians involved in fatal accidents: 0
Fatal accident statistics in 2011:
Fatal accident count: 2
Vehicles involved in fatal accidents: 3
Fatal accidents caused by drunken drivers: 1
Fatalities: 2
Persons involved in fatal accidents: 4
Pedestrians involved in fatal accidents: 0
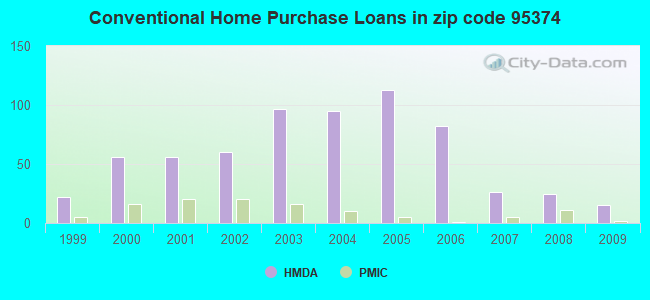
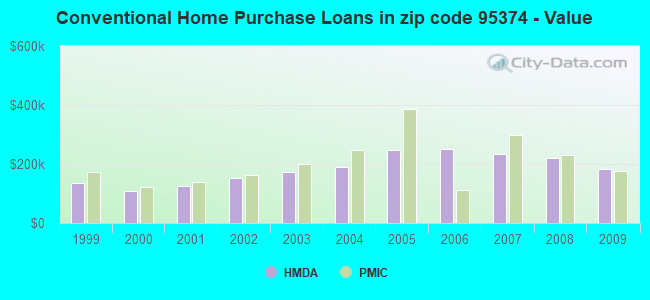
Home Mortgage Disclosure Act Aggregated Statistics For Year 2009 (Based on 2 partial tracts)
A) FHA, FSA/RHS & VA Home Purchase Loans
B) Conventional Home Purchase Loans
C) Refinancings
D) Home Improvement Loans
F) Non-occupant Loans on < 5 Family Dwellings (A B C & D)
G) Loans On Manufactured Home Dwelling (A B C & D)
Number
Average Value
Number
Average Value
Number
Average Value
Number
Average Value
Number
Average Value
Number
Average Value
LOANS ORIGINATED
15
$184,361
15
$183,765
38
$206,889
4
$91,768
8
$214,039
1
$145,040
APPLICATIONS APPROVED, NOT ACCEPTED
2
$161,195
0
$0
6
$247,693
1
$8,940
0
$0
0
$0
APPLICATIONS DENIED
8
$172,194
8
$207,852
41
$221,209
3
$68,283
6
$97,267
2
$156,040
APPLICATIONS WITHDRAWN
5
$259,562
2
$249,525
19
$249,382
1
$81,110
1
$122,360
3
$274,503
FILES CLOSED FOR INCOMPLETENESS
2
$191,785
0
$0
4
$241,105
0
$0
0
$0
1
$265,340
Aggregated Statistics For Year 2008 (Based on 2 partial tracts)
A) FHA, FSA/RHS & VA Home Purchase Loans
B) Conventional Home Purchase Loans
C) Refinancings
D) Home Improvement Loans
F) Non-occupant Loans on < 5 Family Dwellings (A B C & D)
G) Loans On Manufactured Home Dwelling (A B C & D)
Number
Average Value
Number
Average Value
Number
Average Value
Number
Average Value
Number
Average Value
Number
Average Value
LOANS ORIGINATED
8
$205,619
25
$221,618
47
$362,026
5
$83,312
14
$741,803
1
$28,180
APPLICATIONS APPROVED, NOT ACCEPTED
0
$0
5
$188,760
15
$289,121
1
$171,850
1
$204,850
3
$218,823
APPLICATIONS DENIED
3
$242,193
6
$152,145
45
$248,029
10
$122,082
9
$207,060
5
$90,462
APPLICATIONS WITHDRAWN
1
$281,150
3
$238,757
9
$217,371
3
$105,630
1
$192,470
2
$181,475
FILES CLOSED FOR INCOMPLETENESS
0
$0
3
$194,077
10
$206,357
2
$159,820
0
$0
0
$0
Aggregated Statistics For Year 2007 (Based on 2 partial tracts)
A) FHA, FSA/RHS & VA Home Purchase Loans
B) Conventional Home Purchase Loans
C) Refinancings
D) Home Improvement Loans
E) Loans on Dwellings For 5+ Families
F) Non-occupant Loans on < 5 Family Dwellings (A B C & D)
G) Loans On Manufactured Home Dwelling (A B C & D)
Number
Average Value
Number
Average Value
Number
Average Value
Number
Average Value
Number
Average Value
Number
Average Value
Number
Average Value
LOANS ORIGINATED
1
$189,030
26
$233,875
104
$246,737
21
$187,628
1
$266,020
6
$259,378
3
$112,503
APPLICATIONS APPROVED, NOT ACCEPTED
0
$0
10
$170,406
23
$253,023
5
$106,410
0
$0
2
$190,410
2
$219,625
APPLICATIONS DENIED
1
$228,220
25
$255,053
93
$270,880
19
$155,172
0
$0
7
$282,816
11
$107,297
APPLICATIONS WITHDRAWN
1
$225,470
9
$293,978
40
$227,203
5
$175,562
0
$0
2
$140,575
1
$304,520
FILES CLOSED FOR INCOMPLETENESS
0
$0
0
$0
14
$364,666
1
$94,170
0
$0
0
$0
1
$94,170
Aggregated Statistics For Year 2006 (Based on 2 partial tracts)
B) Conventional Home Purchase Loans
C) Refinancings
D) Home Improvement Loans
F) Non-occupant Loans on < 5 Family Dwellings (A B C & D)
G) Loans On Manufactured Home Dwelling (A B C & D)
Number
Average Value
Number
Average Value
Number
Average Value
Number
Average Value
Number
Average Value
LOANS ORIGINATED
82
$249,493
181
$269,298
47
$140,932
27
$398,387
5
$119,332
APPLICATIONS APPROVED, NOT ACCEPTED
29
$238,860
28
$290,525
6
$101,965
5
$352,086
3
$203,700
APPLICATIONS DENIED
41
$292,246
110
$306,593
22
$115,233
15
$313,088
10
$231,516
APPLICATIONS WITHDRAWN
24
$282,750
60
$259,757
6
$131,523
5
$422,614
0
$0
FILES CLOSED FOR INCOMPLETENESS
2
$317,580
11
$228,405
1
$388,380
1
$269,460
0
$0
Aggregated Statistics For Year 2005 (Based on 2 partial tracts)
B) Conventional Home Purchase Loans
C) Refinancings
D) Home Improvement Loans
E) Loans on Dwellings For 5+ Families
F) Non-occupant Loans on < 5 Family Dwellings (A B C & D)
G) Loans On Manufactured Home Dwelling (A B C & D)
Number
Average Value
Number
Average Value
Number
Average Value
Number
Average Value
Number
Average Value
Number
Average Value
LOANS ORIGINATED
113
$246,752
197
$230,143
30
$85,971
1
$218,590
19
$215,771
8
$239,044
APPLICATIONS APPROVED, NOT ACCEPTED
16
$200,678
30
$222,282
3
$213,093
0
$0
1
$284,580
3
$107,233
APPLICATIONS DENIED
45
$240,728
140
$248,957
21
$150,868
0
$0
10
$246,983
14
$183,732
APPLICATIONS WITHDRAWN
21
$250,017
114
$252,306
11
$159,289
0
$0
6
$205,303
4
$284,582
FILES CLOSED FOR INCOMPLETENESS
5
$244,440
41
$241,948
2
$135,420
0
$0
1
$332,700
1
$301,080
Aggregated Statistics For Year 2004 (Based on 2 partial tracts)
B) Conventional Home Purchase Loans
C) Refinancings
D) Home Improvement Loans
F) Non-occupant Loans on < 5 Family Dwellings (A B C & D)
G) Loans On Manufactured Home Dwelling (A B C & D)
Number
Average Value
Number
Average Value
Number
Average Value
Number
Average Value
Number
Average Value
LOANS ORIGINATED
95
$189,216
197
$182,929
25
$115,098
25
$159,807
8
$172,881
APPLICATIONS APPROVED, NOT ACCEPTED
19
$181,003
27
$181,957
4
$116,342
2
$149,510
1
$151,230
APPLICATIONS DENIED
29
$172,063
85
$178,182
23
$101,795
7
$182,554
6
$218,593
APPLICATIONS WITHDRAWN
14
$271,326
78
$167,743
10
$152,534
2
$255,025
1
$321,700
FILES CLOSED FOR INCOMPLETENESS
2
$230,965
23
$176,602
3
$167,953
1
$74,240
1
$167,730
Aggregated Statistics For Year 2003 (Based on 2 partial tracts)
A) FHA, FSA/RHS & VA Home Purchase Loans
B) Conventional Home Purchase Loans
C) Refinancings
D) Home Improvement Loans
F) Non-occupant Loans on < 5 Family Dwellings (A B C & D)
Number
Average Value
Number
Average Value
Number
Average Value
Number
Average Value
Number
Average Value
LOANS ORIGINATED
1
$315,520
97
$172,927
339
$145,449
11
$50,305
25
$124,529
APPLICATIONS APPROVED, NOT ACCEPTED
0
$0
15
$161,860
37
$140,527
5
$65,302
5
$109,160
APPLICATIONS DENIED
1
$81,800
24
$185,885
95
$158,268
8
$28,785
5
$168,276
APPLICATIONS WITHDRAWN
1
$87,990
14
$180,541
76
$149,844
4
$55,508
3
$102,423
FILES CLOSED FOR INCOMPLETENESS
0
$0
3
$247,693
10
$161,127
0
$0
1
$51,550
Aggregated Statistics For Year 2002 (Based on 2 partial tracts)
A) FHA, FSA/RHS & VA Home Purchase Loans
B) Conventional Home Purchase Loans
C) Refinancings
D) Home Improvement Loans
F) Non-occupant Loans on < 5 Family Dwellings (A B C & D)
Number
Average Value
Number
Average Value
Number
Average Value
Number
Average Value
Number
Average Value
LOANS ORIGINATED
12
$115,254
60
$152,660
173
$138,227
11
$25,121
16
$125,322
APPLICATIONS APPROVED, NOT ACCEPTED
1
$77,680
17
$117,505
21
$115,614
6
$19,247
3
$122,587
APPLICATIONS DENIED
0
$0
15
$155,169
59
$141,045
10
$27,427
0
$0
APPLICATIONS WITHDRAWN
0
$0
4
$150,540
43
$148,367
2
$34,370
3
$116,170
FILES CLOSED FOR INCOMPLETENESS
0
$0
0
$0
14
$166,842
1
$6,870
1
$63,240
Aggregated Statistics For Year 2001 (Based on 2 partial tracts)
A) FHA, FSA/RHS & VA Home Purchase Loans
B) Conventional Home Purchase Loans
C) Refinancings
D) Home Improvement Loans
F) Non-occupant Loans on < 5 Family Dwellings (A B C & D)
Number
Average Value
Number
Average Value
Number
Average Value
Number
Average Value
Number
Average Value
LOANS ORIGINATED
13
$126,428
56
$124,211
151
$116,111
10
$38,563
15
$91,699
APPLICATIONS APPROVED, NOT ACCEPTED
0
$0
9
$86,536
16
$133,656
2
$50,525
1
$55,680
APPLICATIONS DENIED
1
$100,360
23
$110,163
69
$122,696
12
$21,252
3
$166,580
APPLICATIONS WITHDRAWN
0
$0
10
$115,483
61
$127,225
5
$29,558
1
$52,930
FILES CLOSED FOR INCOMPLETENESS
1
$90,050
2
$291,460
8
$145,214
1
$59,120
0
$0
Aggregated Statistics For Year 2000 (Based on 2 partial tracts)
A) FHA, FSA/RHS & VA Home Purchase Loans
B) Conventional Home Purchase Loans
C) Refinancings
D) Home Improvement Loans
F) Non-occupant Loans on < 5 Family Dwellings (A B C & D)
Number
Average Value
Number
Average Value
Number
Average Value
Number
Average Value
Number
Average Value
LOANS ORIGINATED
12
$107,349
56
$107,062
31
$78,896
8
$19,849
5
$67,090
APPLICATIONS APPROVED, NOT ACCEPTED
1
$61,180
12
$85,008
14
$94,665
5
$17,322
1
$52,240
APPLICATIONS DENIED
1
$193,850
17
$67,001
54
$102,664
8
$30,160
3
$78,823
APPLICATIONS WITHDRAWN
1
$173,220
7
$104,190
28
$91,007
0
$0
1
$104,480
FILES CLOSED FOR INCOMPLETENESS
0
$0
3
$91,883
10
$93,555
0
$0
0
$0
Aggregated Statistics For Year 1999 (Based on 1 partial tract)
A) FHA, FSA/RHS & VA Home Purchase Loans
B) Conventional Home Purchase Loans
C) Refinancings
D) Home Improvement Loans
E) Loans on Dwellings For 5+ Families
F) Non-occupant Loans on < 5 Family Dwellings (A B C & D)
Detailed PMIC statistics for the following Tracts:0004.00
2005 - 2018 National Fire Incident Reporting System (NFIRS) incidents
Based on the data from the years 2005 - 2018 the average number of fires per year is 28. The highest number of reported fire incidents - 53 took place in 2008, and the least - 7 in 2006. The data has a growing trend.
When looking into fire subcategories, the most incidents belonged to: Outside Fires (59.1%), and Mobile Property/Vehicle Fires (23.9%).
Fire incident types reported to NFIRS in Zip Code 95374


 Nearest zip codes: 95324, 95334, 95315, 95380, 95382, 95301.


 Based on the data from the years 2005 - 2018 the average number of fires per year is 28. The highest number of reported fire incidents - 53 took place in 2008, and the least - 7 in 2006. The data has a growing trend.
 When looking into fire subcategories, the most incidents belonged to: Outside Fires (59.1%), and Mobile Property/Vehicle Fires (23.9%).